Comments not related to oil or natural gas production in this thread please, thanks.
Read MoreAuthor: Ovi
US August Oil Production Another Record High
By Ovi
All of the Crude plus Condensate (C + C) production data, oil, for the US state charts comes from the EIAʼs Petroleum Supply monthly PSM which provides updated information up to August 2024.
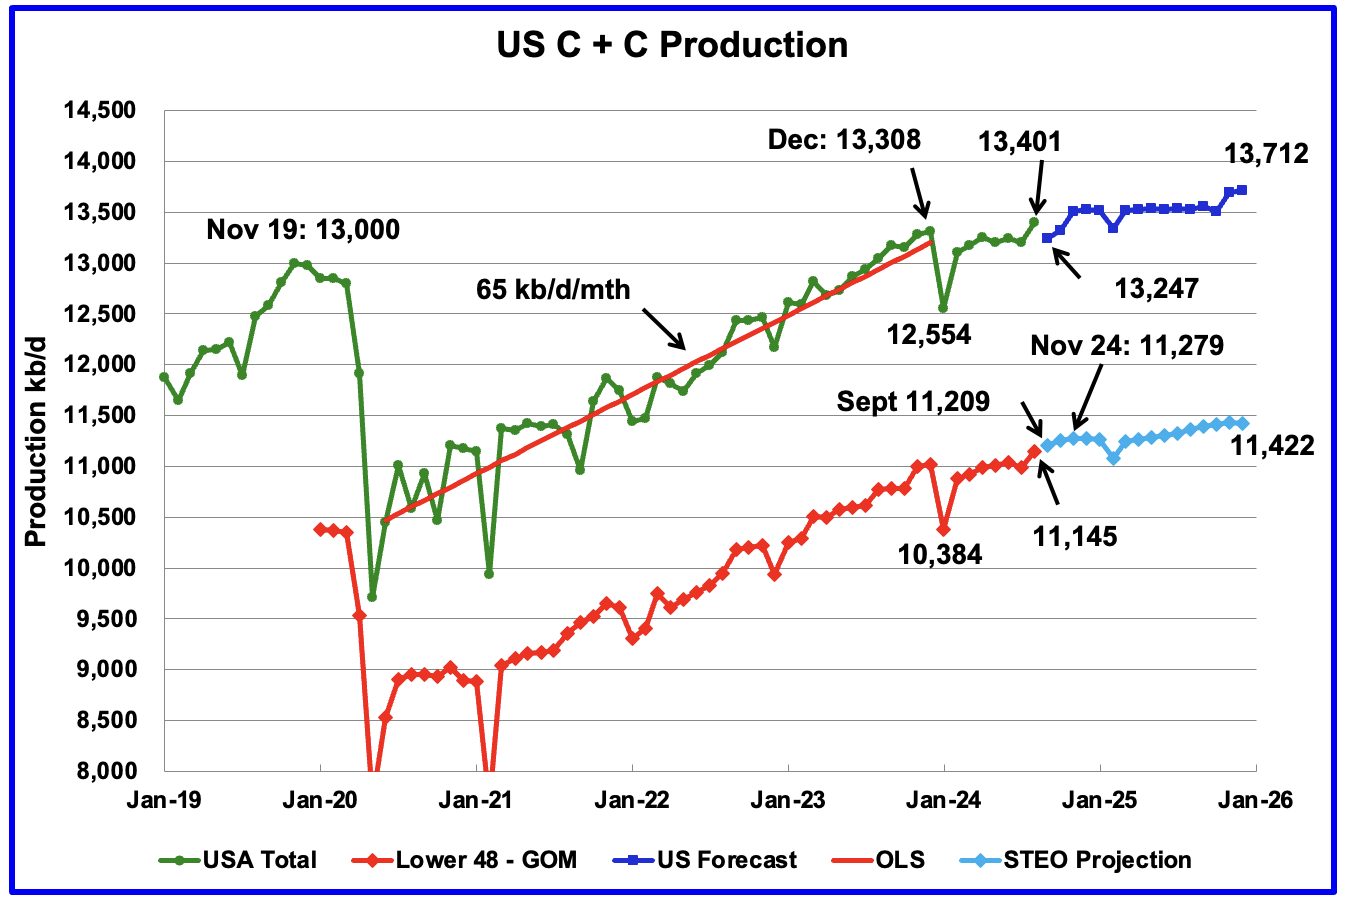
U.S. August oil production increased by 195 kb/d to 13,401 kb/d to another record high. The previous record was 13,308 kb/d in December 2023. The largest increases came from Texas, 99 kb/d and New Mexico, 57 kb/d.
Read MoreOpen Thread Non-Petroleum, November 5, 2024
Comments not related to oil or natural gas production in this thread please, thanks.
Read MoreJune Non-OPEC & World Oil Production
By Ovi
The focus of this post is an overview of World oil production along with a more detailed review of the top 11 Non-OPEC oil producing countries. OPEC production is covered in a separate post.
Below are a number of Crude plus Condensate (C + C) production charts, usually shortened to “oil”, for oil producing countries. The charts are created from data provided by the EIA’s International Energy Statistics and are updated to June 2024. This is the latest and most detailed/complete World Oil production information available. Information from other sources such as OPEC, the STEO and country specific sites such as Brazil, Norway and China is used to provide a short term outlook.
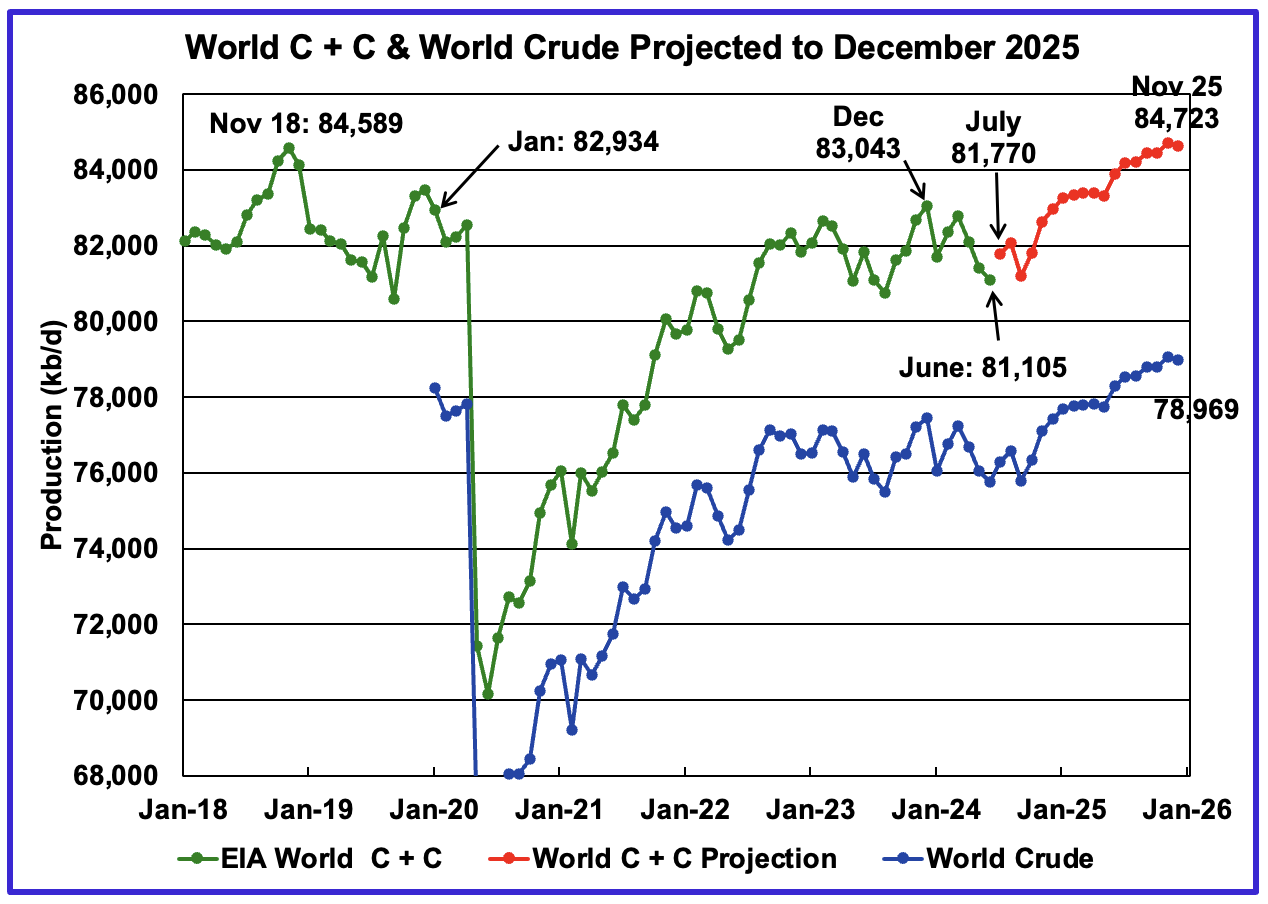
World oil production decreased by 299 kb/d in June to 81,105 kb/d, green graph. The largest decreases came from Saudi Arabai 350 kb/d and Russia 142 kb/d. July’s World oil production is projected to increase by 665 kb/d to 81,770 kb/d.
Read MoreOpen Thread Non-Petroleum October 12, 2024
Comments not related to oil or natural gas production in this thread please, thanks.
Read More