Please place all posts not related to oil or natural gas here. Thank you.
Author: Ovi
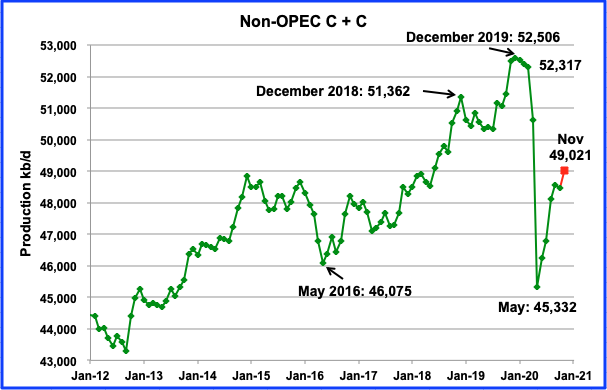
Non-OPEC July Output up by 1.2%
A post by Ovi at peakoilbarrel
Below are a number of oil (C + C ) production charts for Non-OPEC countries created from data provided by the EIA’s International Energy Statistics and updated to July 2020. Information from other sources such as OPEC, the STEO and country specific sites such as Russia and Norway is used to provide a short term outlook for future output and direction for a few countries.
Open Thread, Non-Petroleum, November 24, 2020
Please place all posts not related to oil or natural gas here. Thank you.
Open Thread Non-Petroleum October 31, 2020
A new open Thread Non-Petroleum has been posted
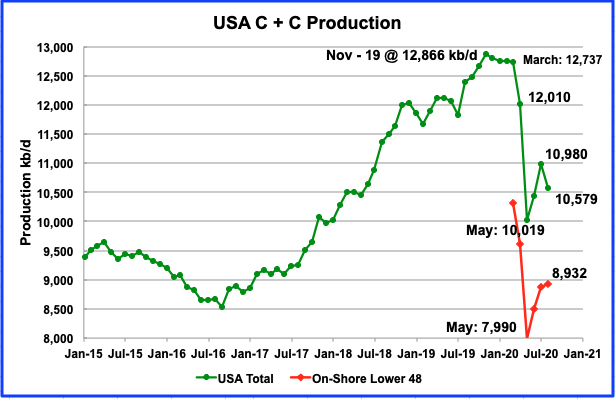
Hurricanes Impact US August Oil Production
A post by Ovi at peakoilbarrel.
All of the oil (C + C) production data for the US state charts comes from the EIAʼs Petroleum Supply monthly PSM. After the production charts, an analysis of three EIA monthly reports projecting future production is provided. The charts below are updated to August 2020 for the 10 largest US oil producing states.