Texas Update- November 2016

Edit 12/2/2016, 8:30 AM EST. A corrected chart for correction factors below and a new chart added.

Texaschart/

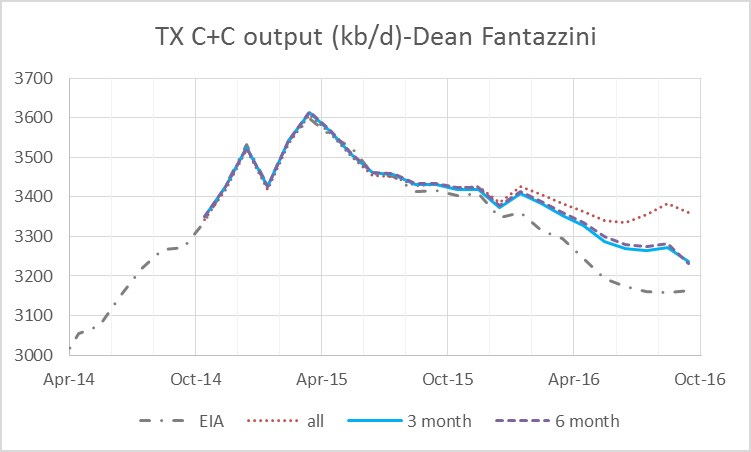
The railroad commission of Texas released September output data a few weeks ago and Dean Fantazzini made an estimate of the “corrected” data for crude plus condensate (C+C) and natural gas. Last month he found there had been a structural change in the data in March and provided a new estimate using only the most recent 3 months of data, I chose to use the most recent 6 months of data instead.

This month I will present the old estimate (labelled “all”) using all vintage data (dating back to April 2014) as well as the 6 month and 3 month estimate, which use the most recent 6 months and 3 months of data respectively. Read More

Eagle Ford and World Update-Nov 2016

Enno Peters recently reported on Eagle Ford output at shaleprofile.com, so I have updated my estimate of Eagle Ford output by utilizing his data. Enno reports horizontal well output from the Eagle Ford region so some output from other formations is included (Austin chalk, etc). To compensate for this I compare the data from shaleprofile to the output reported from the EIA for the Eagle Ford.

For Sept 2014 through Nov 2015 Enno’s data is about 52 kb/d higher on average each month than the EIA estimate, so I deduct this amount from my preliminary estimate to arrive at my final estimate. Enno’s data for each month from Sept 2014 to July 2016 is divided by Texas (TX) statewide C+C output from the RRC to find the percentage of Eagle Ford region to TX statewide output. This percentage is multiplied by Dean Fantazzini’s 6 month corrected estimate of Texas C+C output and then 52 kb/d is subtracted to arrive at my final Eagle Ford estimate.

The Chart below has my estimate labelled as Dennis and Enno’s Eagle Ford region estimate (horizontal wells only) labelled as Enno Peters. The EIA estimate is shown as well.

Transitionchart/
Read More