This is a Guest Post by Islandboy
Non-Petroleum comments should be in this thread.

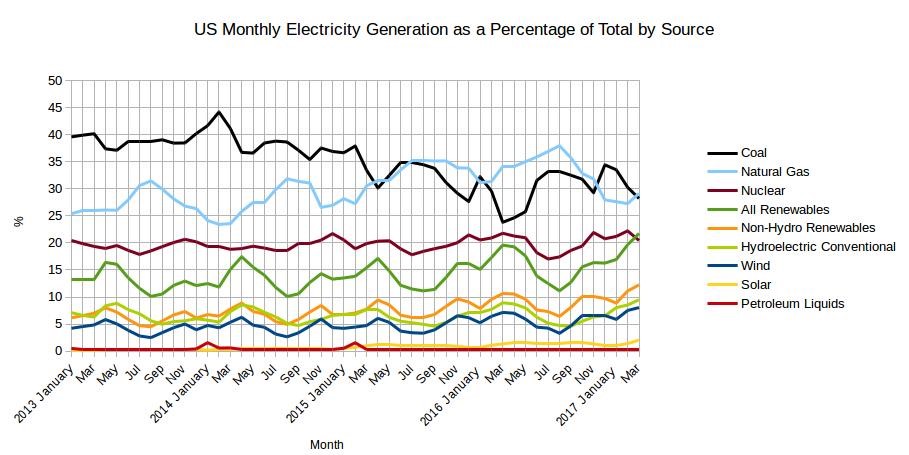
The EIA released the latest edition of their Electric Power Monthly on June 23rd, with data for April 2017. April data extends the milestones reached in March as follows:
- The contribution from solar reached 2.35%, up from 2%
- The contribution from All Renewables extended its lead over Nuclear by more than 2%
- The combined contribution from Wind and Solar reached 11%, up from 10%
- The contribution from Non-Hydro Renewables exceeded 13%, up from 12.24%