Comments not related to oil or natural gas in this thread please.
Author: D C
Open Thread Non-Petroleum, September 6, 2017
Comments not related to oil and natural gas in this thread please.
EIA’s Electric Power Monthly – August 2017 Edition with data for June
A Guest Post by Islandboy

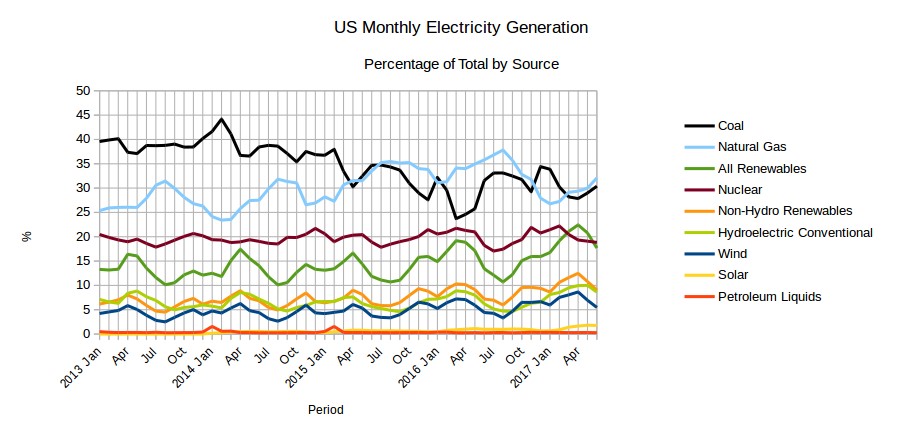
The EIA released the latest edition of their Electric Power Monthly on August 24th, with data for June 2017. With all the data for the first half of 2017 now available the half year performance of the various sectors can be assessed. As reported on the web site utilitydive.com “Coal tops gas as leading generation source in first half of 2017“. PV Magazine on their news web page chose to highlight that, “Renewables generate (almost) as much U.S. power as nuclear during H1 2017“. The highlights of the first half of 2017 include (See the YTD row of Table 2 below for data):
• Coal generated slightly more than Natural Gas
• Nuclear generated slightly more than All Renewables
• Conventional hydro generated slightly more than Wind and Solar combined
• Non-Hydro Renewables generated more than conventional hydroelectric
• Carbon neutral and zero emission sources combined generated more than either gas or coal Read More
Open Thread Non-Petroleum, August 24, 2017
Comments not related to oil or natural gas in this thread please.
