EIA’s Electric Power Monthly – June 2017 Edition with data for April

This is a Guest Post by Islandboy

Non-Petroleum comments should be in this thread.

chart/

chart/

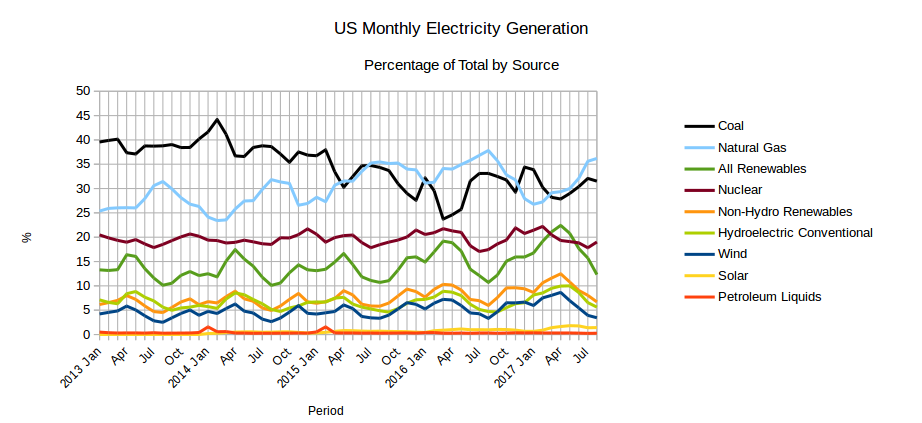
The EIA released the latest edition of their Electric Power Monthly on June 23rd, with data for April 2017. April data extends the milestones reached in March as follows:

  • The contribution from solar reached 2.35%, up from 2%
  • The contribution from All Renewables extended its lead over Nuclear by more than 2%
  • The combined contribution from Wind and Solar reached 11%, up from 10%
  • The contribution from Non-Hydro Renewables exceeded 13%, up from 12.24%

Read More

World Energy 2017-2050: Annual Report

A Guest post by:

Dr. Minqi Li, Professor
Department of Economics, University of Utah
E-mail: minqi.li@economics.utah.edu

This Annual Report evaluates the future development of world energy supply and its impact on the global economy as well as climate change. The report projects the world energy supply and gross world product (global economic output) from 2017 to 2050. It also projects carbon dioxide emissions from fossil fuels burning and the implied global average surface temperature from 2017 to 2100.

chart/

Figure 18
Sources: World historical oil, natural gas, and coal consumption from 1950 to 1964 is estimated from carbon dioxide emissions (Boden, Marland, and Andres 2017); world primary energy consumption and its composition from 1965 to 2016 is from BP (2017); world primary energy consumption and its composition from 2017 to 2050 is based on this report’s projections. Read More

EIA’s Electric Power Monthly – May Edition with data for March

This is a guest post by islandboy.

Any comments not related to petroleum (politics, renewable energy, or coal for example) should be in this thread, there will be a separate Open thread for Petroleum (oil and natural gas) discussion.

chart/

chart/

The EIA released the latest edition of their Electric Power Monthly on May 25th, with data for March 2017. March data includes some milestones which are significant in that these circumstances have not existed for a very long time, if ever. Read More

World Crude Plus Condensate and Conventional Oil

chart/

The EIA recently updated its International Petroleum statistics.  World Crude plus Condensate (C+C) output was 80,577 kb/d in Feb 2017 an increase of 72 kb/d from the previous month, this was 1695 kb/d below the monthly peak output of 82,273 kb/d in November 2016. The most recent 12 month average (centered on August/September 2016) was 80,501 kb/d, 3 kb/d less than the previous most recent 12 month’s output. The 12 month centered average peak output was 80,574 kb/d in June/July 2016 as previously predicted by Ron Patterson and currently the 12 month average output is 73 kb/d below the peak. Read More