Comments not related to oil or natural gas in this thread.
Thanks.
Comments not related to oil or natural gas in this thread.
Thanks.


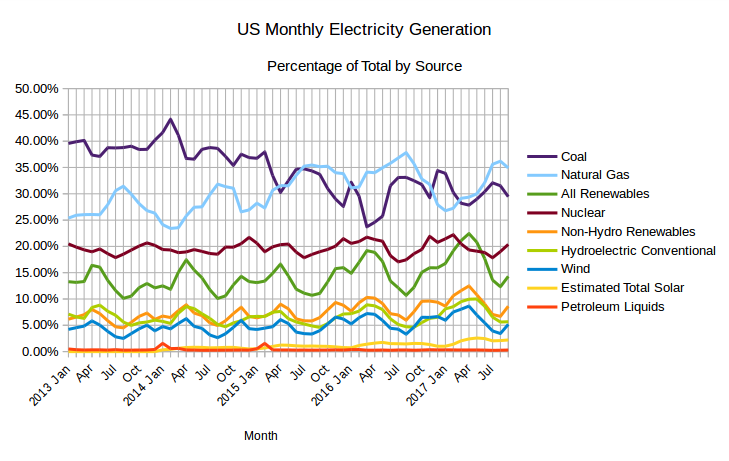
The EIA released the latest edition of their Electric Power Monthly on December 1st, with data for September 2017. The table above shows the percentage contribution of the main fuel sources to two decimal places for the last two months and the year to date. Read More
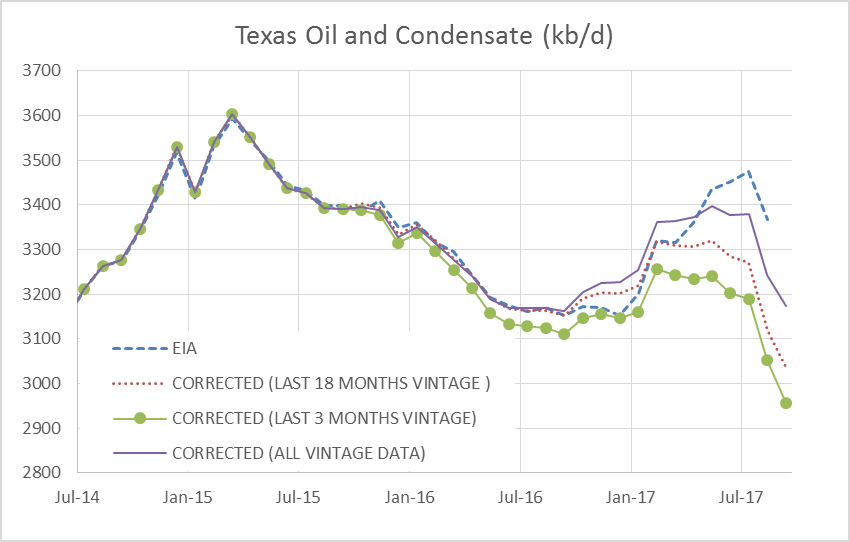
Dean Fantazzini has provided his latest estimates of Texas oil and natural gas output.
His analysis is based on RRC data only. Each RRC data set from Jan 2014 to Sept 2017 for crude and from April 2014 to Sept 2017 for condensate and natural gas are used in the “all data” estimate, the most recent 49 months of data are collected for each individual data set. After March 2016 there was a shift in the data for crude and condensate so for the C+C estimate, I include an estimate which uses all data from April 2016 to the most recent data point (“Corrected 18 month vintage”). Dean prefers to present an “all vintage data” estimate and an estimate using only the most recent 3 months “correction factors”. For Sept 2017 the all vintage data estimate is 3174 kb/d, the last 3 month vintage estimate is 2957 kb/d, and the last 18 month vintage estimate is 3039 kb/d with falls of 68, 96, and 80 kb/d respectively from the previous month.

Comment not related to Oil and/or Natural Gas in this thread please.
Thanks.
Comments related to oil and natural gas in this thread please.
Any Non-Petroleum comments should go under the Electric Power Monthly post below. Thanks.