OPEC Update and news from Iraq

The new OPEC Monthly Oil Market Report just came out with their Crude Only production numbers for May. All data in the OPEC charts are in thousands barrels per day.

OPEC 12

There was very little in production changes and no surprises in the May data. Total OPEC production was up 142,000 barrels per day and that was after the April numbers had been revised up by 29,000 bpd.

Iraq

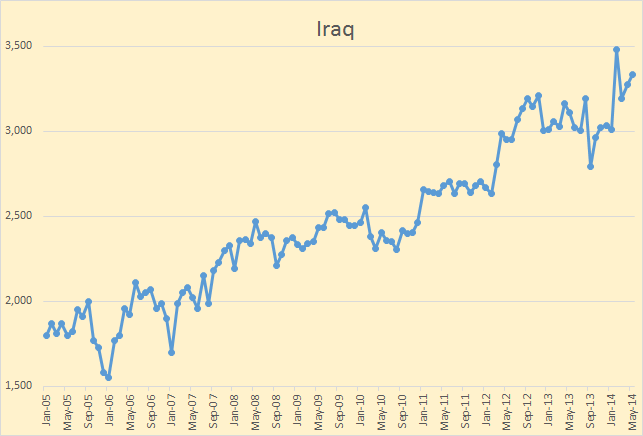
Everyone is concerned about Iraq. Iraq’s April numbers were revised down by 22,000 bpd and May production was up 18,000 above that revised number. Iraqi production stood at 3,331,000 bpd in May but I expect that number will change in June and most definitely in July.
Read More

The EIA’s Drilling Productivity Report and Other News

The EIA just released its latest Drilling Productivity Report which is a report on all major shale plays in the U.S. All the data below, unless otherwise noted, is in barrels per day.

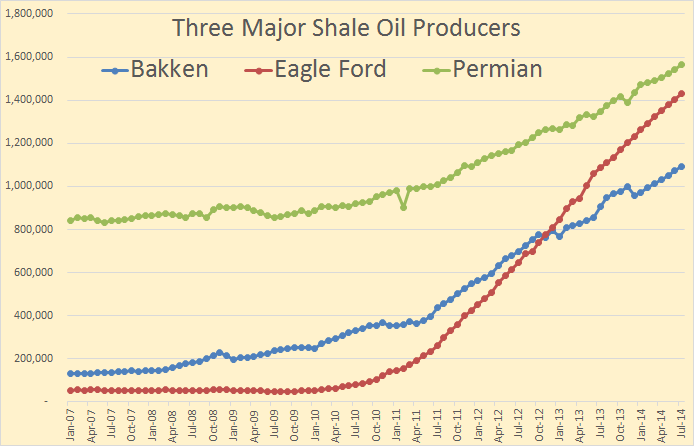
Three Plays

The EIA includes the Permian production as shale or light tight oil production. No doubt some tight oil is produced in the Permian but I think most Permian oil is conventional oil.

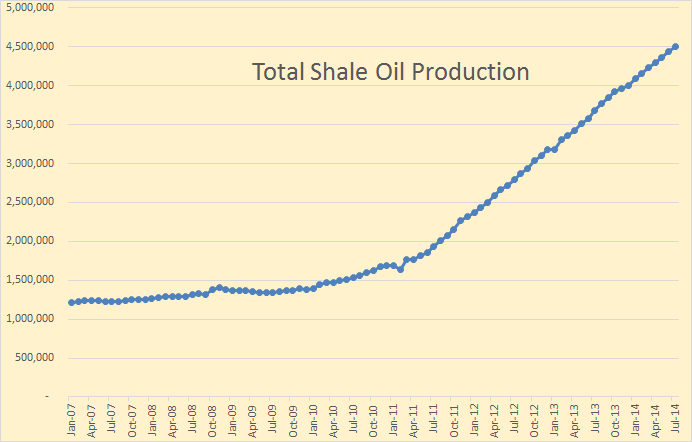
Total Shale Oil

Total shale oil production from all six shale plays. However I believe perhaps one million barrels of this is conventional production.
Read More

Gulf Of Mexico Crude Oil Production

Folks who follow this blog know that I am a data hog. That is I track data from the US as well as production from the rest of the world. But there are periods during the month when there is just no new data coming in. During the first 10 days or so of a month is such a time, almost no new data is posted anywhere. So I try to find something else to post. It is on the oil production in the Gulf of Mexico.

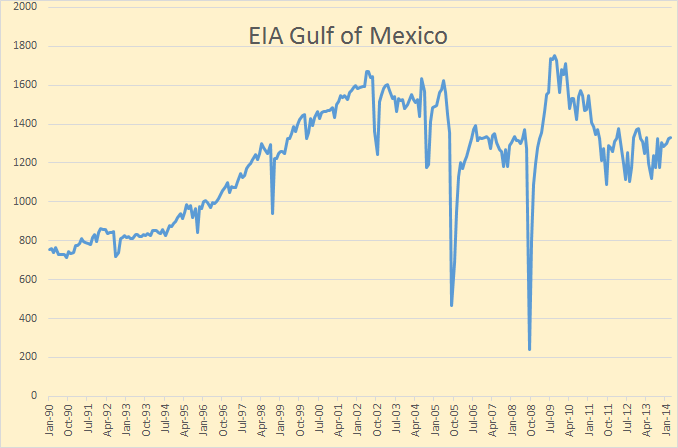
The last data point on all charts is March 2014. All data is in barrels per day except the first chart below which is in thousand barrels per day.

GOM Production

The EIA gets their data from BSEE, (Bureau of Safety and Environmental Enforcement), a branch of Department of the Interior, not the Department of Energy as you might expect.

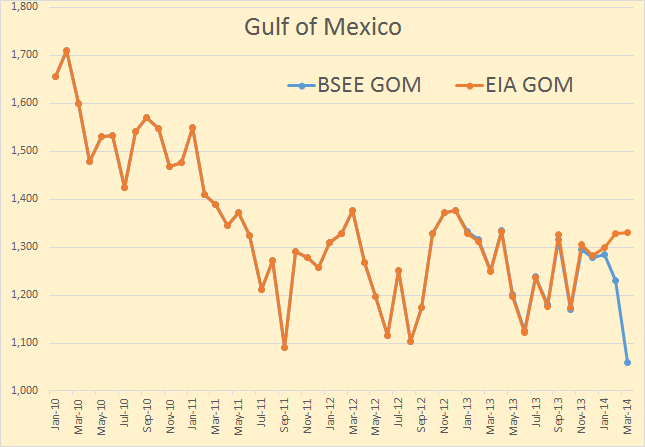
GOM BSEE

The BSEE is a little like the Texas RRC, that is they report the data they have even though they know it will be revised later. The EIA on the other hand, estimates where they think the data will be after it has all come in. So the chart above shows where they think production in the GOM will be after all the data comes in.
Read More

In North Dakota it is Mostly Just One County

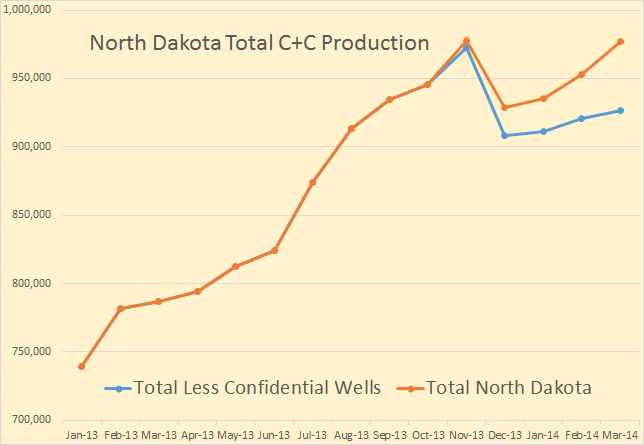
North Dakota publishes crude oil production numbers for each county. The problem is these numbers do not include confidential wells. Their totals for all North Dakota do include these wells however. I have figured out a way to estimate, pretty closely I believe, each county’s share of those unreported wells. That is take each county’s percentage of total production, then assume they would have the same percentage of confidential wells. It is not exact but close enough.

North Dakota Total

The data is published only as a PDF file and cannot be copied and pasted. Therefore I must input the data for each of 18 counties, each month, manually. That is very time consuming and I only had the patience to do 15 months. But that is plenty for what I am trying to show.

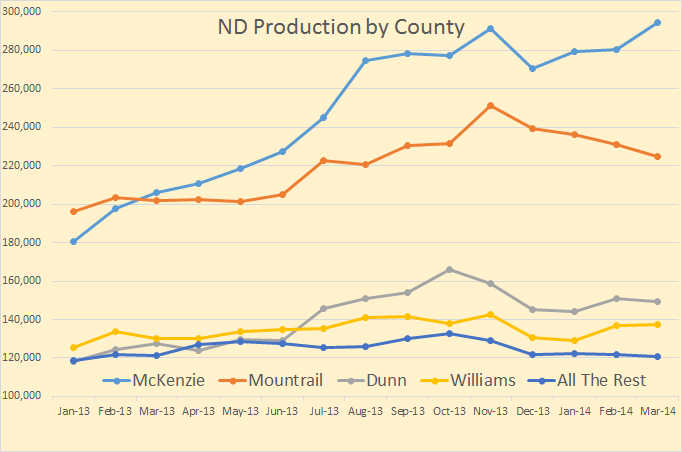
ND by County

All the rest of North Dakota combined produces less than the lowest of the big four.
Read More

US Individual States Production, Bakken Area and GOM

The EIA’s Petroleum Supply Monthly has been published with production data for all individual states and offshore areas.  All data is Crude + Condensate and in thousand barrels per day with the last data point March 2014.

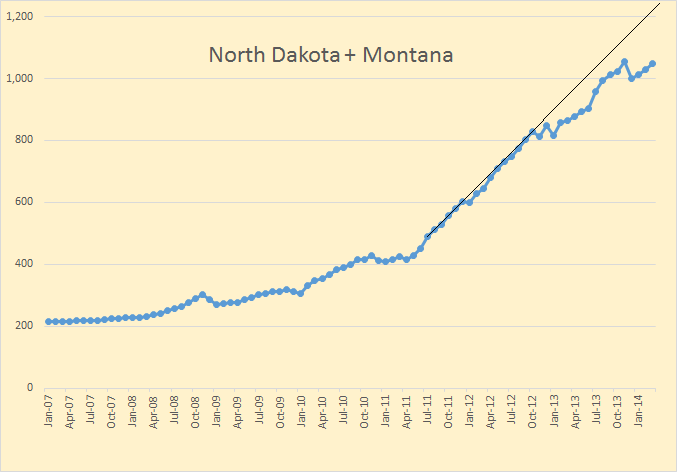
Mont+ND


Since the Bakken occupies part of two states, North Dakota and Montana, I have combined their production in order to get a better idea of what is really happening there. I have drawn a trend line from July 2011 through October 2012. That shows where production might have been if the fast decline rate and bad weather had not caught up with the. Production was 1,050,000 barrels per day in March, still 5,000 barrels per day below the point reached in November.

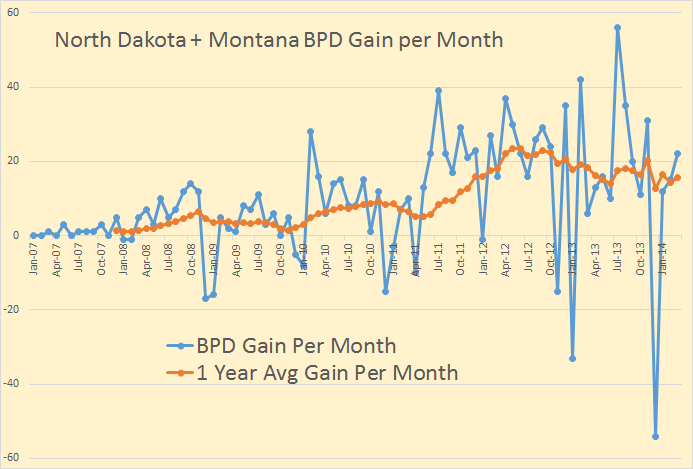
ND and Montana Change

I wanted to show this chart so we could get a better idea what is really going on in the entire Bakken area. Back in May and June of 2012 production was increasing by an average of 23,500 barrels every month. Now production is increasing by an average of 15,580 barrels per month.
Read More