EIA World Crude + Condensate Production Update

EDIT: The EIA updated their International Energy Statistics Monday with their January update. I spent several hours on that update, updating all my spreadsheets, updating the Non-OPEC Charts page, the World Crude Oil Production by Geographical Area page, and creating the post below. Then after I had finished all that they, the EIA, published another International Energy Statistics with the February production data. Sorry but I am exasperated, I will deal with the February update sometime next week. Below is what I prepared before that update. Anyway the emphasis is far more on the yearly numbers than the monthly numbers.
+++++++++++++++++++++++++++++++++++++++++++++++
The EIA finally published an update to their International Energy Statistics. They were over a month late. Last time they were a month late they published two months data. This time no such luck, the data is through January 2014. There was only large revision in the historical data, Canadian December Production was revised up by 298 kb/d. There were several much smaller revisions but World December production was revised up by 273 kb/d to 75,431,000 bp/d in December.
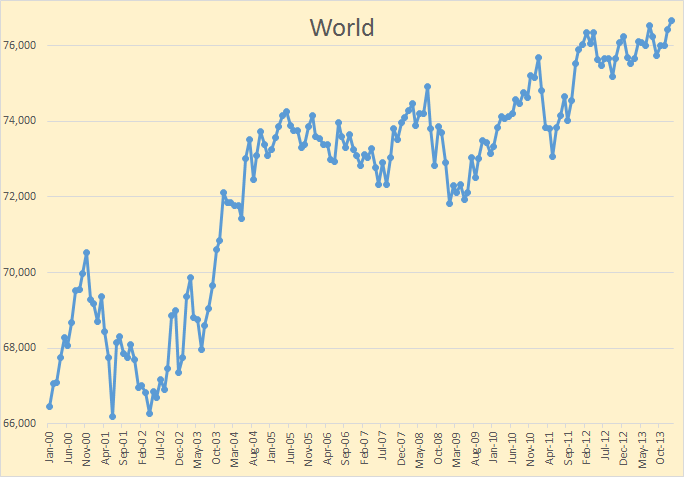
World World C+C was up to 76,662,000 barrels per day, an increase of 231 kb/d over December. Average world C+C production was up only 132,000 bp/d in 2013 over 2012.

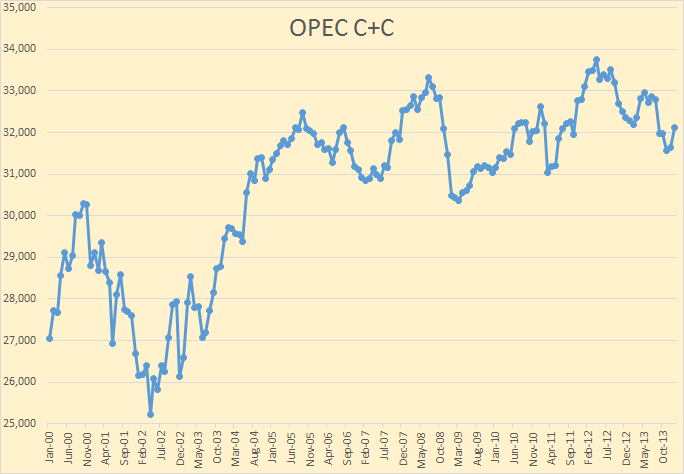
OPEC C+C

The Gain was all OPEC however. January OPEC Crude + Condensate production was up by 482,000 bp/d to 32,118,000 bp/d. This is considerably different from what the OPEC Monthly Oil Market Report reported. They had OPEC crude only production up by 147,000 bp/d in January to 29,855,000 bp/d. Understand this is crude only, not C+C. OPEC crude only seems to be holding relatively steady and stood ate 29,765,000 bp/d in May.
Read More
North Dakota and the Bakken by County

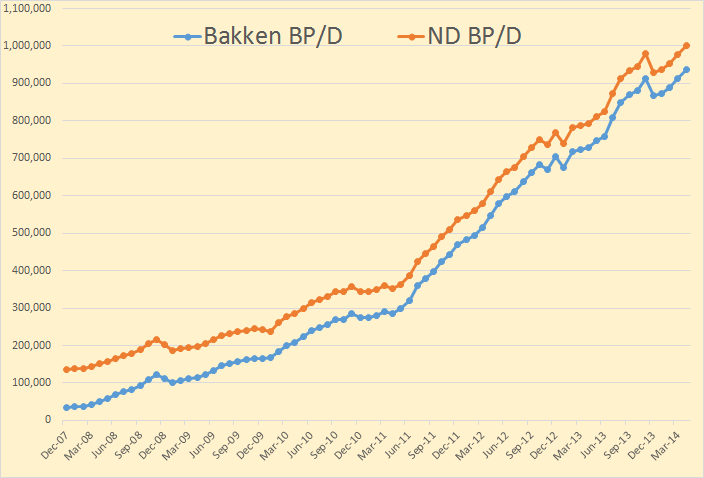
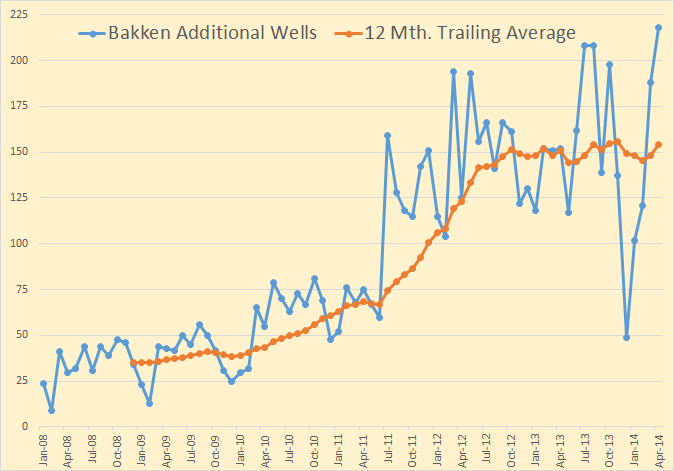
Looking at North Dakota oil production by county, and historical production by county, gives a better  perspective of what is happening in the Bakken and the rest of North Dakota than just looking at total production.

The data is available here: ND Historical Barrels of Oil Produced by County You will notice it says:(Confidential Wells are Not Included). However the total North Dakota does include confidential wells. And I have made adjustments for the confidential wells. The adjustment for March and April came from the NDIC here: State Summary Report April 2014.
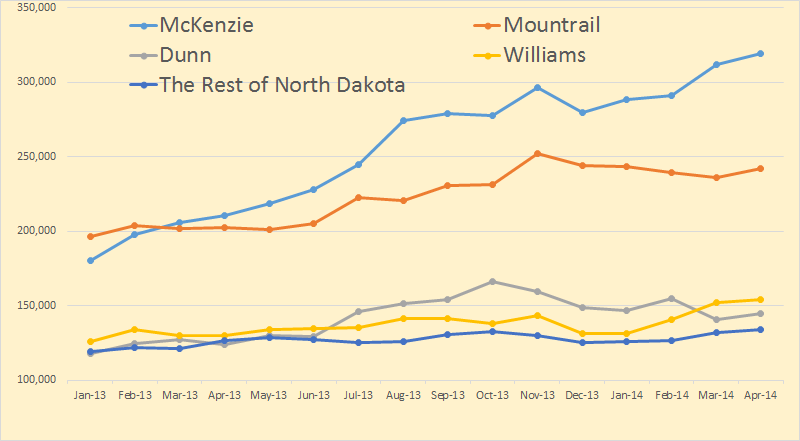
Bakken Counties

The above chart is after adjustment for confidential wells. Even the lowest producer of the big four, Dunn County, outproduces the rest of North Dakota combined.

McKenzie

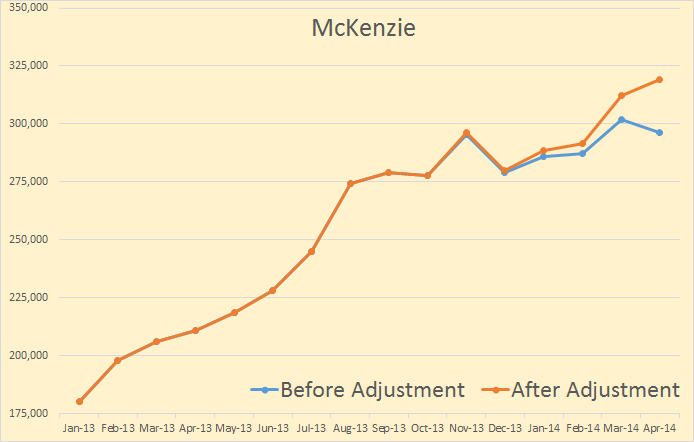
McKenzie was up 7,168 barrels per day after adjustment this month.
Read More

Texas RRC Report April Production Data

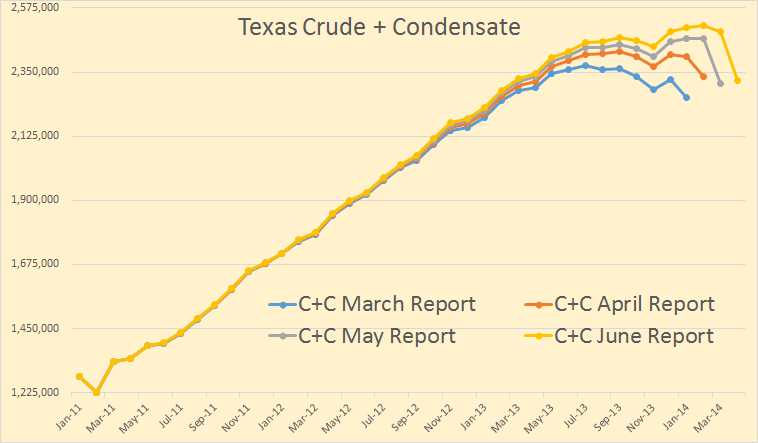
The Texas Rail Road Comission has released their latest report with oil, gas and condensate production for April. The RRC data is always incomplete however and takes many months for the all the data to trickle in. The below chart shows that problem.

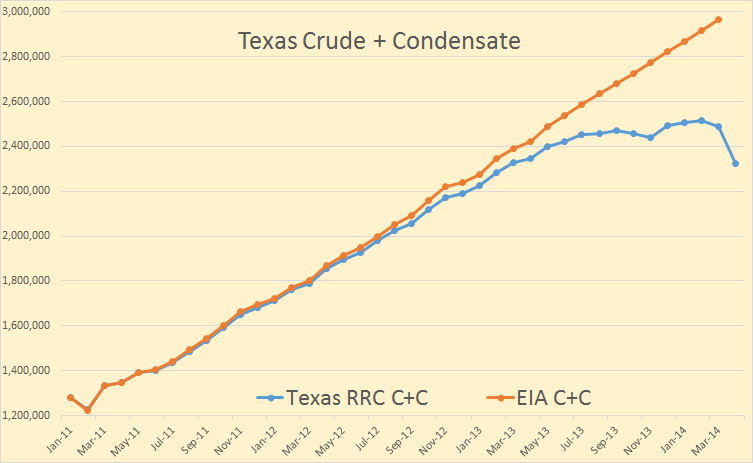
Texas RRC-EIA

The data is barrels per data with the EIA data through March and RRC data through April. The EIA has Texas C+C data is highly linear for the 10 months June 2013 through March 2014, increasing at 48 kb/d for 4 months, 41 kb/d for one month then 49 kb/d for the last 5 months.

The EIA has Texas C+C increasing at an average of 48.6 bp/d each month for the last two years. I think that is a little high. I think the production has been increasing at close to 43 kb/d each month but with a recent slow down in that increase.

Texas C+C

All Texas RRC June report data is through April. The RRC does not combine Crude with Condensate so I have to add the two. But here you can see the problem. Each month the reported data increases with the latest months showing the largest increase. However even if this is the case, the latest month should show an increase almost equal to the final total increase for that month. That was the case in the April Report, (January to February), but not the case for the last two reports.
Read More

BP Statistical Review of World Energy 2014

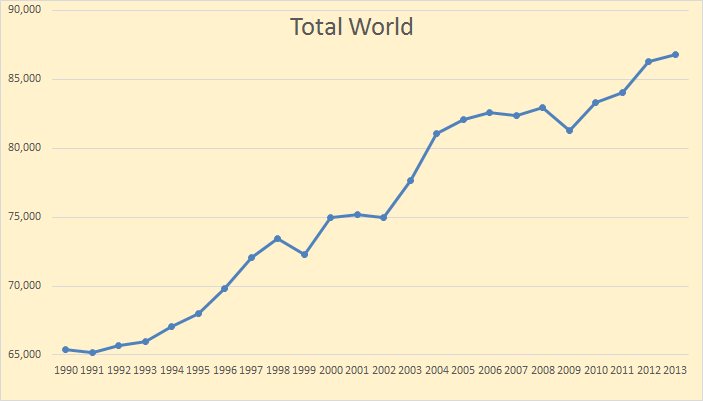
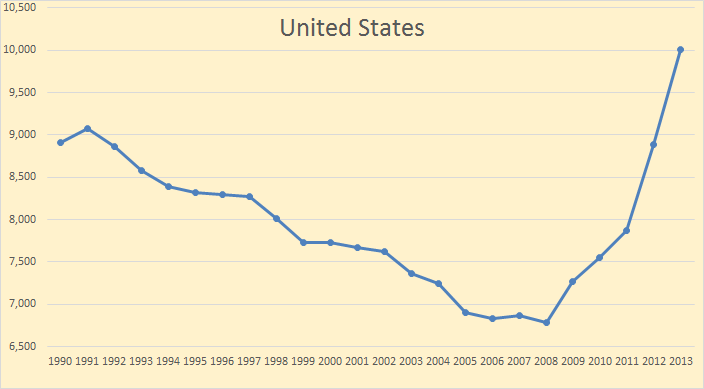
BP has released its Statistical Review of World Energy 2014. There are a lot of things in this report but I am only posting charts on liquid petroleum only. The BP report includes crude oil and NGLs. Their data does not include ethanol or any type of biofuels or process gain. The report actually has data from 1965 but I started all charts from 1990 in order to highlight more recent production. All data is in kb/d.

BP World

BP has World liquids output up 557 kb/d in 3013.

BP United States
Read More