All data below is from various sources. All US data is from the EIA. Unless otherwise noted is in thousand barrels per day.

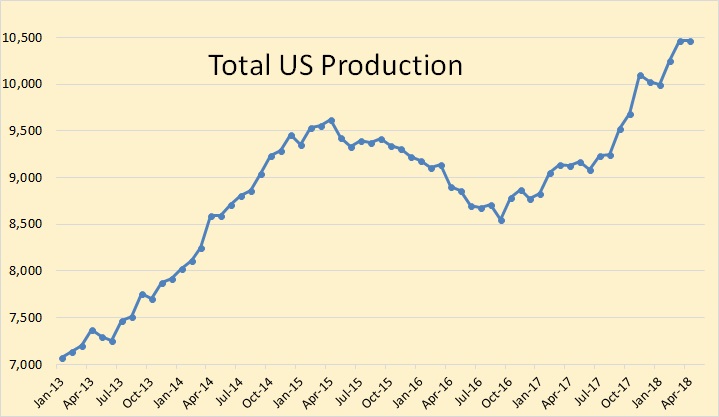
USA data is through April. C+C production was almost flat in April, down 2,000 bpd.
All data below is from various sources. All US data is from the EIA. Unless otherwise noted is in thousand barrels per day.

USA data is through April. C+C production was almost flat in April, down 2,000 bpd.
Please place all comments not related to gas or oil here.
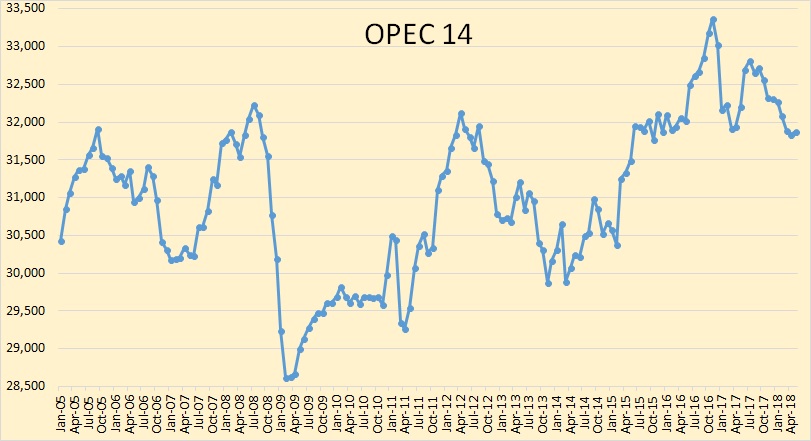
All OPEC data below is from the OPEC Monthly Oil Market Report. All OPEC data is in thousand barrels per day and is through May 2018.

OPEC 14 Crude oil production was up 35,000 barrels per day but that was after March production had been revised down by 32,000 bpd and April production was revised down by 89,000 bpd.
Comments not related to oil and gas go in this thread please.
All data below is from various sources. All US data is from the EIA. Unless otherwise noted is in thousand barrels per day.

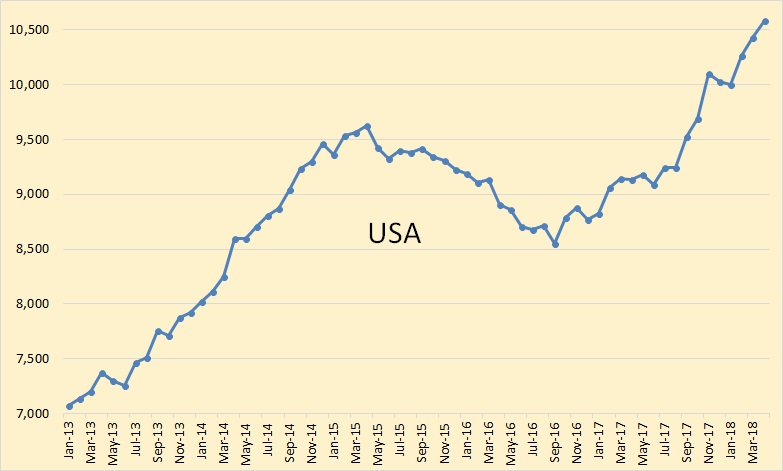
US C+C production through April, 2018. For the last 8 months, the average increase in US production has been 168,000 bpd. Most of this has come from the Permian.