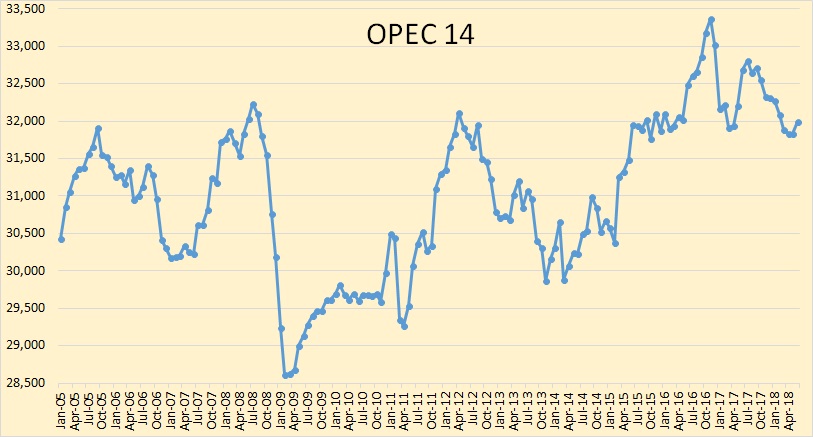
OPEC July Crude Production Data

All OPEC data is from the latest OPEC Monthly Oil Market Report and is in thousand barrels per day. All data is through July 2018.
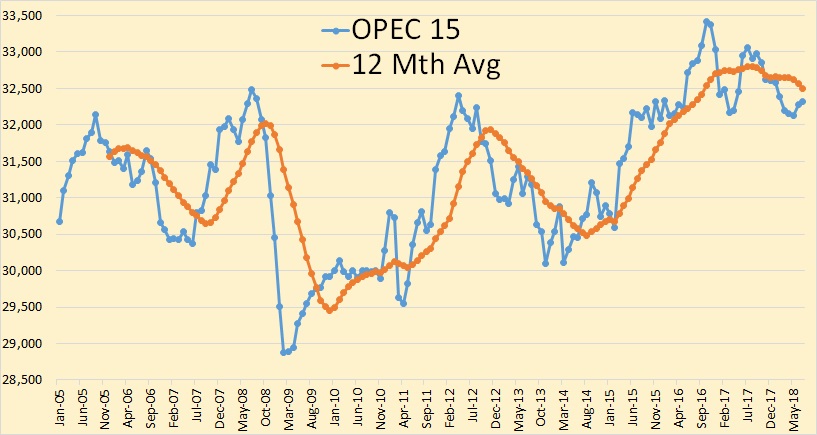
OPEC crude oil production was up 41,000 barrels per day in July but that was after June production was revised down by 43,000 bpd. So OPEC production is actually down 2,000 bpd from what was reported last month.
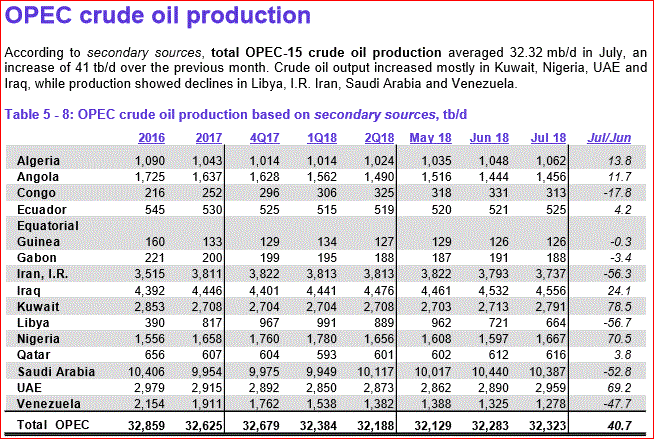
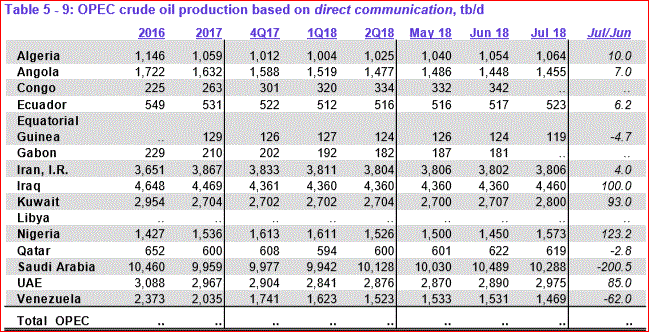
The big difference here is in what secondary sources says Saudi Arabia produced in July, down 52,800 bpd, and what Saudi says they produced, down 200,5000 bpd. What Venezuela says they produced has no basis in reality.

Read More

U.S. & World Oil Production and ExxonMobil Outlook

Here are the latest oil production numbers from the EIA. All data is in thousand barrels per day unless otherwise noted.

The USA through May 2018. The upward surge has stalled for the last two months. US production was down 30,000 bpd in May.

It is a little astonishing how close the Texas chart resembles the USA chart. Texas is, by far, the USA’s largest producer. As Texas goes, so goes the USA. Texas production was up 20,000 bpd in May.

Read More

OPEC June Production Data

All data below is from the OPEC Monthly Oil Market Report. All data is in thousand barrels per day and is through June 2018.

The Republic of the Congo was added to OPEC this month. The data below does not reflect that addition. I will try to add them next month.

OPEC 14 production was up 161,000 barrels per day in June. That does not include the Congo which was up 12 kbpd.

Notice: This is The Republic of the Congo, a much smaller nation than the DRC, or The Democratic Republic of the Congo.

May OPEC production was revised down 39,000 bpd. Saudi Arabia was revised up 28,000 bpd, Qatar was revised up 17,000 bpd while Nigeria’s May production was revised down 79,000 bpd.

Read More