Please place all comments not related to petroleum in this thread.
Author: Ron Patterson
OPEC August Production Data
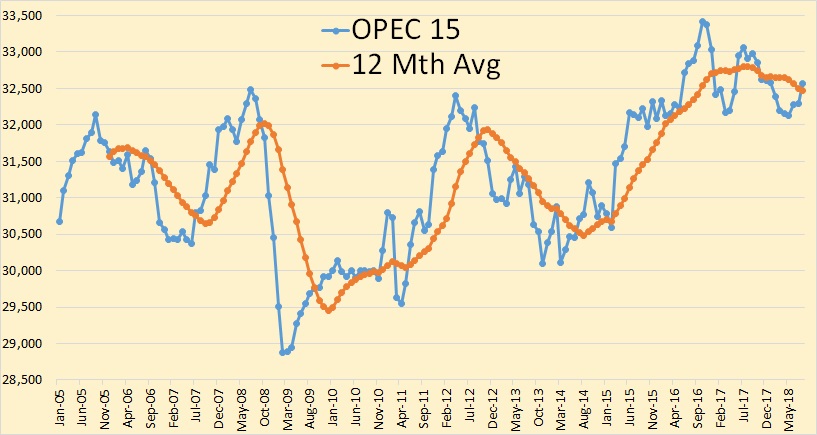
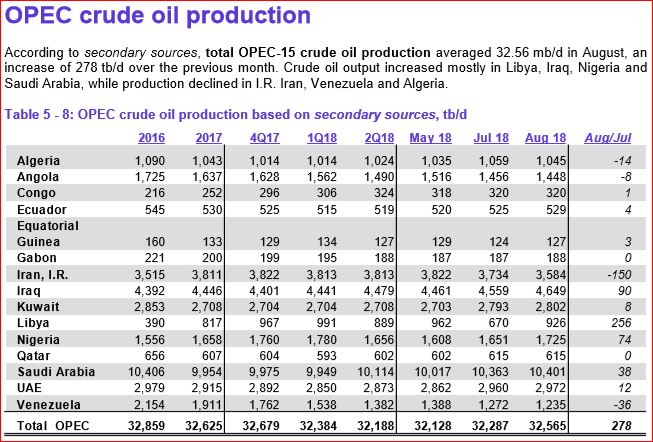
Data for the OPEC charts below are from the OPEC Monthly Oil Market Report. All OPEC data are through August 2018 and in thousand barrels per day.

OPEC 15 crude only production was up 278,000 barrels per day in August to 32,565,000 bpd. Most of that increase was Libya, up 256,000 bpd.

July OPEC production was revised down 38,000 barrels per day.
Open Thread, September 12, 2018
General comments not related to petroleum production should be in this thread.
Thanks
EIA’s Latest USA & World Oil Production Data
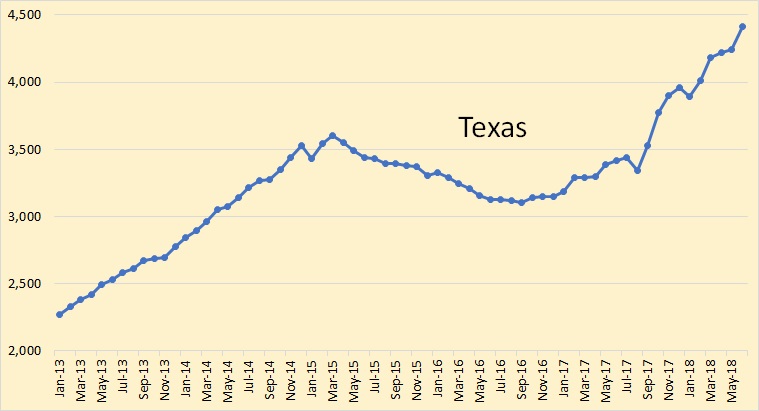
These first charts are taken from the EIA’s Monthly Crude Oil and Natural Gas Production. The data are through June 2018 and is in thousand barrels per day.

US C+C production was up 231,000 barrels per day in June to 10,674,000 bpd, an all-time high.

Texas was up 165,000 barrels per day in June to 4,410,000 bpd.
Open Thread, September 5, 2018
General comments not related to petroleum production should be in this thread.
Thanks.