The EIA Short Term Energy Outlook (STEO) was published recently. An estimate for World C+C output from November 2024 to December 2026 is presented in the chart below. This estimate is based on crude oil estimates in the STEO for OPEC12 nations, OPEC+ minus OPEC12 nations, and US C+C estimates and the trend in the ratio of the STEO crude estimates and C+C estimates from the EIA’s International Energy Statistics for OPEC12, OPEC+ minus OPEC12, and non-OPEC+ minus US C+C output from November 2018 to October 2024. For the next 4 charts the horizontal and vertical scales are the same, with 9 years on the horizontal axis and 12000 kb/d from the lowest to highest values on the vertical axis so the differences in rates of change are easier to compare. The thin line represents monthly data or forecasts after October 2024 and the markers with labels show the average annual output for each year.
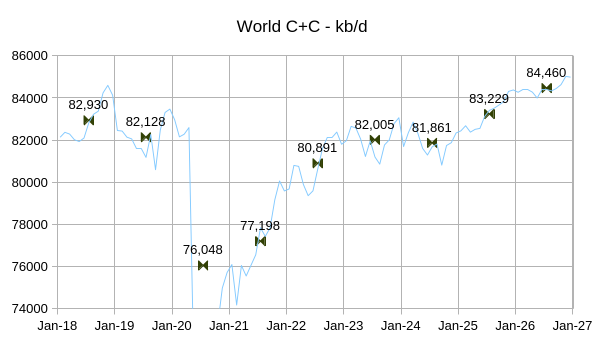
Last month’s estimates using a similar method for estimation had 2024 at 81,841 kb/d, 2025 at 83,176 kb/d, and 2026 at 84,420 kb/d, slightly lower than this month’s STEO. Note that this STEO forecast is different from my forecast which is 82,640 kb/d in 2025 and 83,090 kb/d in 2026 for average annual World C+C output.
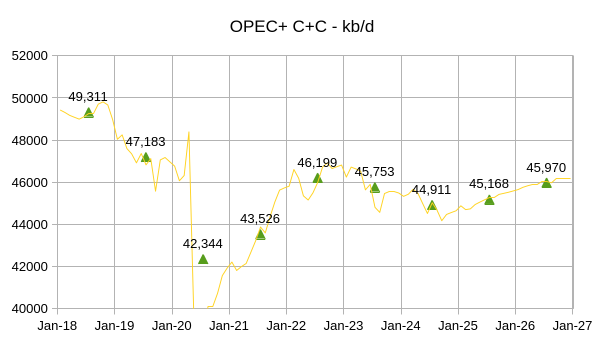
Last month’s estimate for OPEC+ was 44,903 kb/d in 2024, 45,183 kb/d in 2025, and 46,082 kb/d in 2026. OPEC+ output increases at an annual rate of about 530 kb/d from 2024 to 2026.
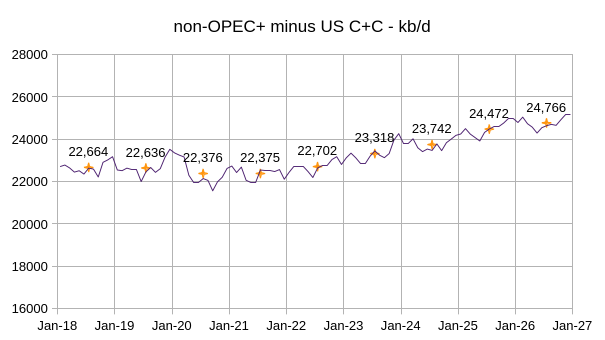
The Non-OPEC+ minus US estimate in last month’s report was 23723 kb/d in 2024, 24,449 kb/d in 2025, and 24,716 kb/d in 2026. The annual rate of increase from 2024 to 2026 for Non-OPEC+ minus US C+C is about 512 kb/d.
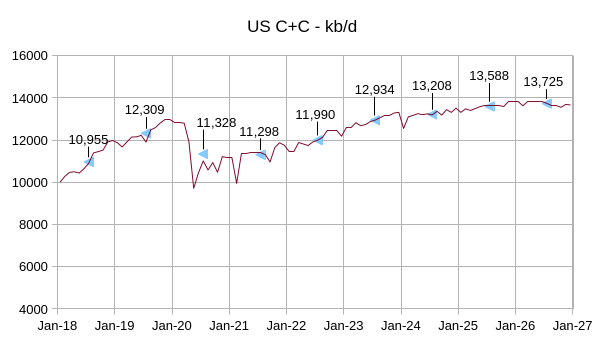
The US C+C estimate in last month’s report was 13,214 kb/d in 2024, 13,544 kb/d in 2025, and 13,623 kb/d in 2026. The annual rate of increase from 2024 to 2026 for US C+C is about 259 kb/d. To get a feel for how the STEO estimate might change over time I looked back at the US C+C STEO estimate from 12 months ago (estimate ended in 2025). The annual forecast for US C+C in that older report was about 100 kb/d lower then the current STEO forecast for both 2024 and 2025 even with higher oil price forecasts in the STEO from Feb 2024 compared with the current report. Natural gas prices were also forecast higher in 2024 in the Feb 2024 STEO, but 2025 Henry Hub spot prices were lower than the Feb 2025 STEO.
Note the big drop in oil prices forecast for 2026, this is the reason the EIA expects US C+C output will be nearly flat in 2026, the low oil prices are expected to lead to fewer new wells completed in tight oil plays and slower overall growth in tight oil which is barely high enough to offset falling output elsewhere in the US. US annual average C+C output rises by 137 kb/d in 2026 less than half of the increase in 2025 (380 kb/d).
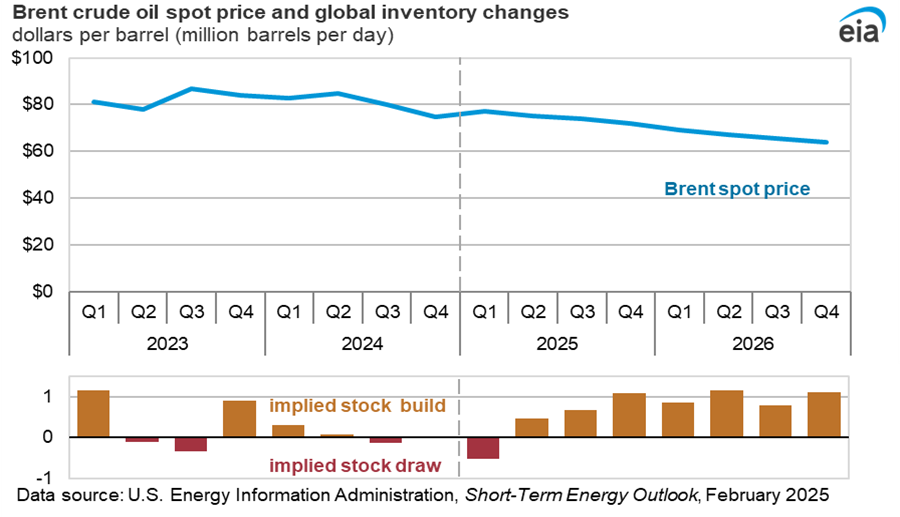
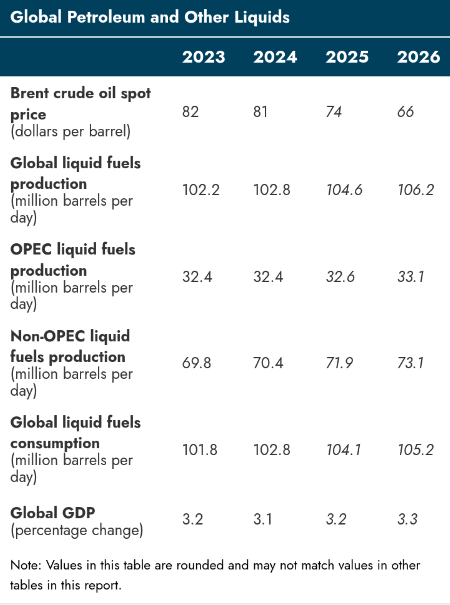
The high World liquids supply relative to World Consumption in 2025 and 2026 leads to stock builds which drives down Brent oil prices from $77.13/b in 2025Q1 to $64/b in 2026Q4 (WTI falls from $73.62 to $60/b over the same period in the STEO forecast.)
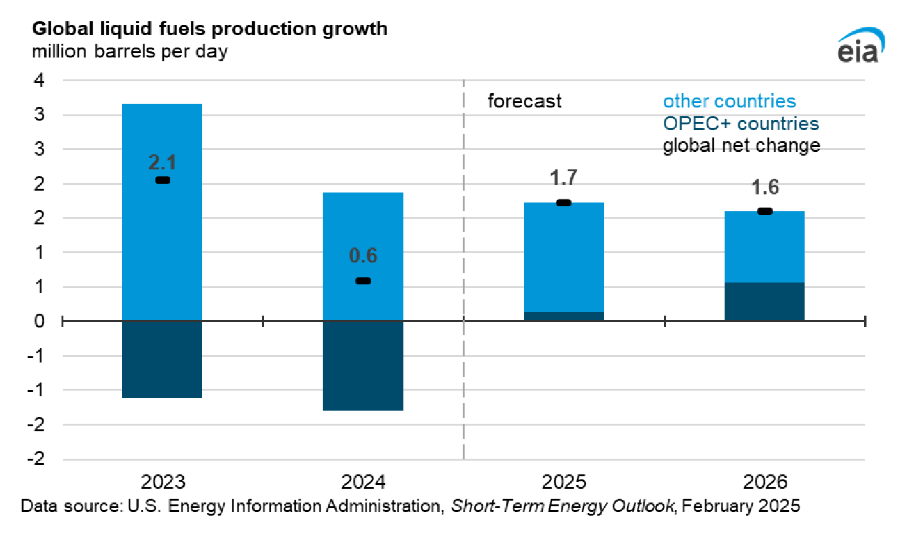
The forecast above for Global liquids production looks very optimistic given the low oil prices in the forecast. Either output will be lower or prices will be higher than the STEO forecast, probably a bit of both.
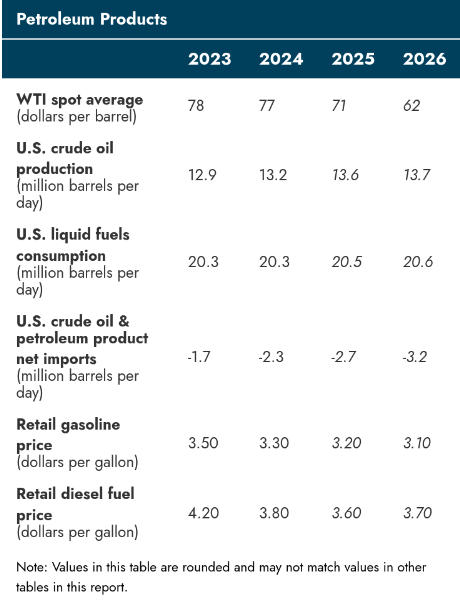
The EIA expects demand for distillate fuel and jet fuel to increase in 2025 and 2026, while improved fleet efficiency for passenger vehicles leads to lower demand for gasoline. Low crude oil prices in 2026 leads to low growth in crude oil output.
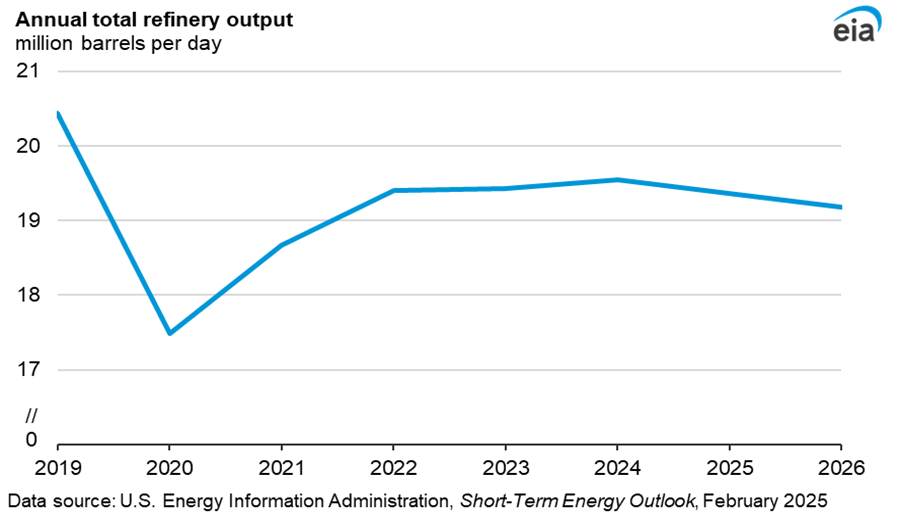
Two planned refinery closures in the US (about 400 kb/d capacity combined) in 2025 and 2026 leads to lower refinery output in 2025 and 2026, this is offset by a lower refinery exports forecast for 2025 and 2026.
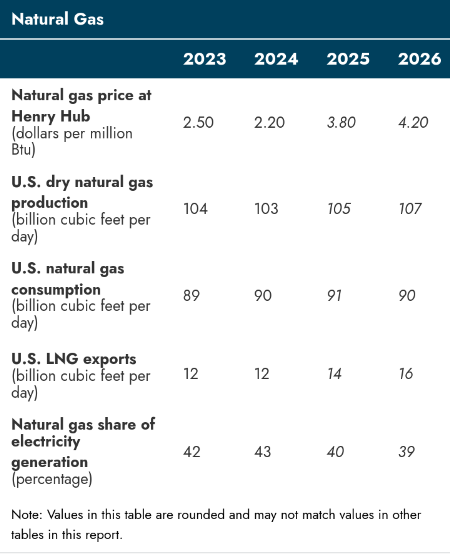
The higher natural gas prices in the forecast leads to higher US natural gas output and lower natural gas consumption in 2026. The share of natural gas used for electricity output falls from 43% in 2024 to 39% in 2026, in part due to higher natural gas prices.
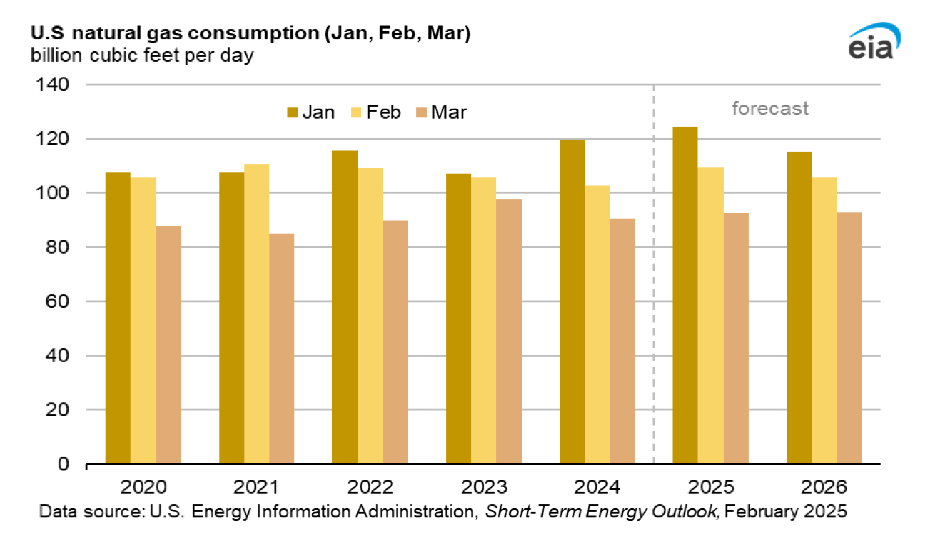
The severe winter weather in 2025Q1 is expected to lead to large stock draws in natural gas.
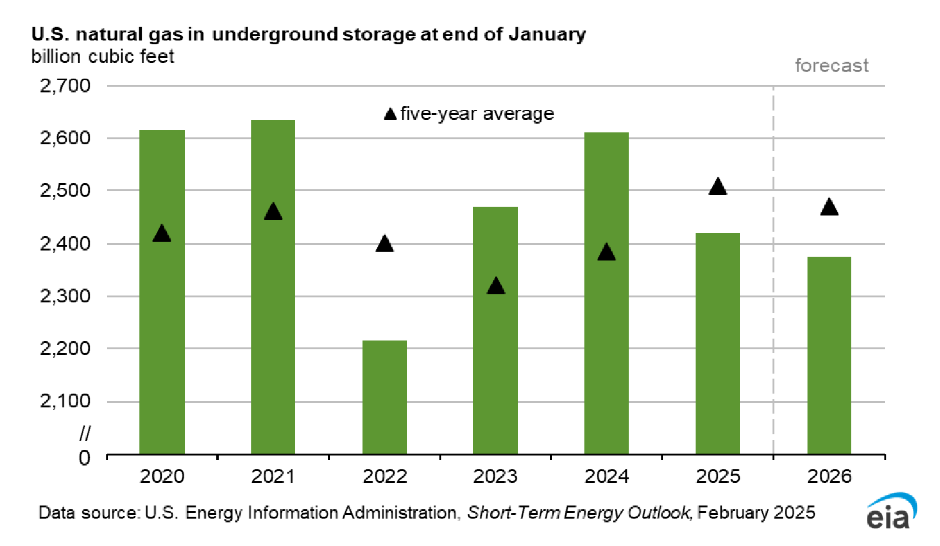
Low stock levels of natural gas in 2025 and 2026 compared to the 5 year average leads to the forecast natural gas price increases.
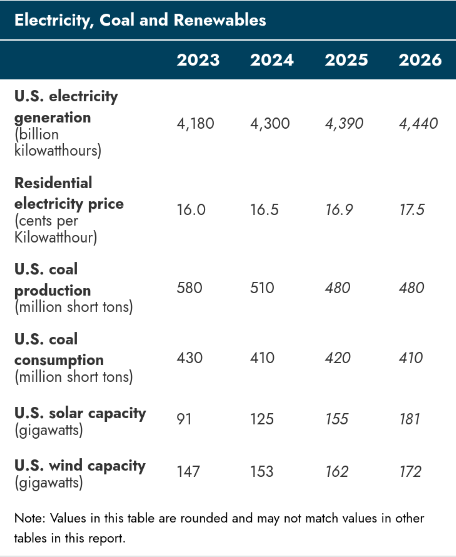

While demand for electricity is forecast to increase in 2025 and 2026 the trend in coal consumption for electric power is a lower share falling from 34% in 2015 to about 15% in 2026. Natural gas used for electric power saw an increase from about a 32% share in 2015 to 43% in 2024 which is forecast to fall to 39% in 2026. The overall share of coal and natural gas for US electric power output is forecast to fall from 66% in 2015 to 54% in 2026. Wind and solar power output is forecast to rise from a 6% share in 2015 to roughly a 19% share in 2026.
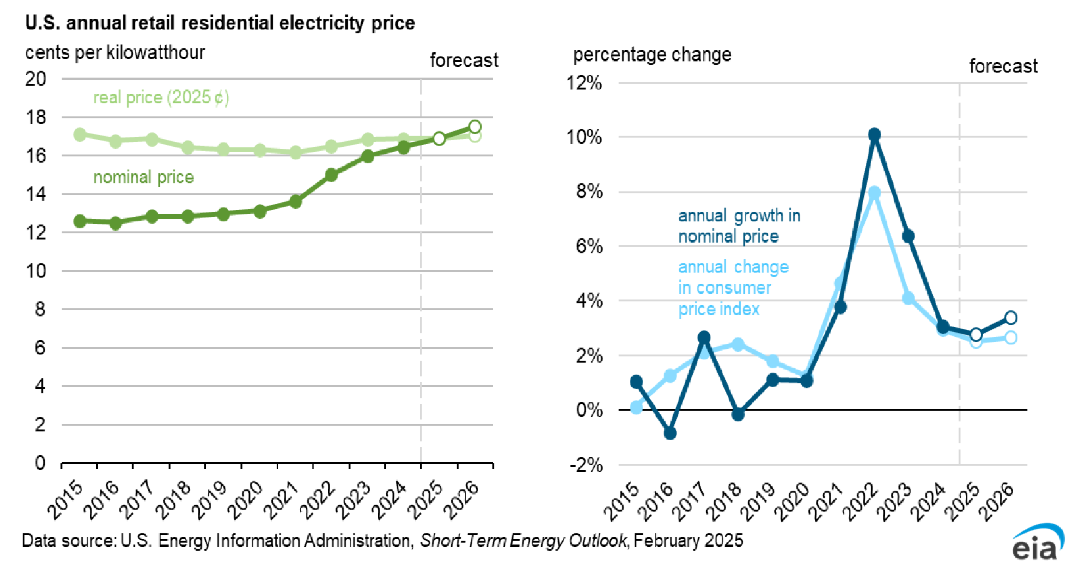
The rising real electricity prices in the US are due to needed grid modernization (see link for more detail).
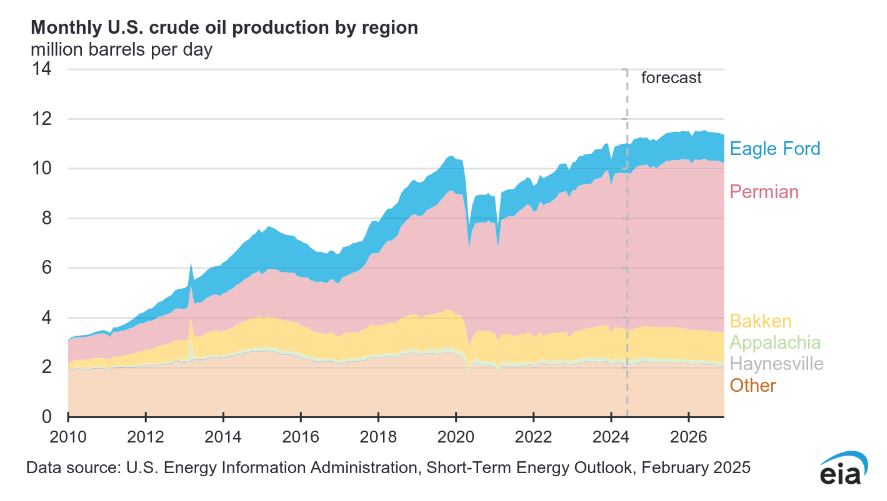
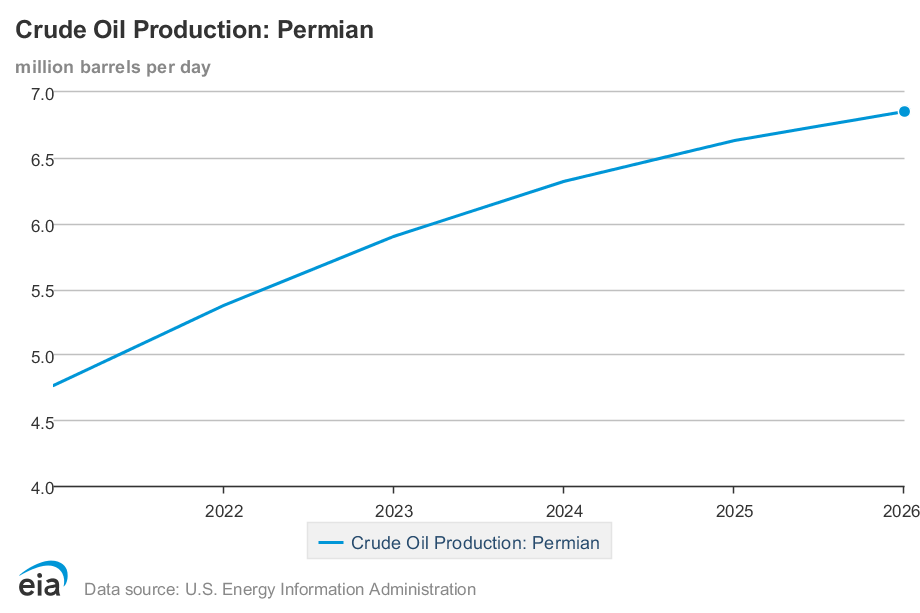
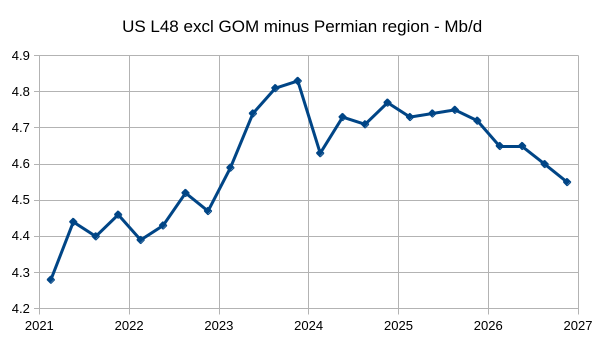
On an annual basis, Permian output continues to rise from 2025 to 2026, but the monthly forecast is pretty flat in 2026 probably due to the low prices in the STEO forecast. Other parts of the US lower 48 excluding Gulf of Mexico besides the Permian region see declining output in the second half of 2025 and most of 2026 (see chart below.)
Using Novi Data for Permian tight oil output and assuming conventional Permian region output is declining at about 3.5% per year, I get the following using EIA, RRC(TX), OCD(NM) data for the Permian region along with the Novi data through August 2023.
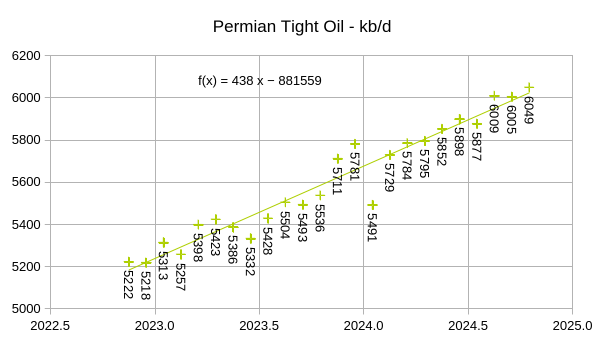
The estimate above only extends through October 2024 because typically there are future revisions to the most recent month estimate.
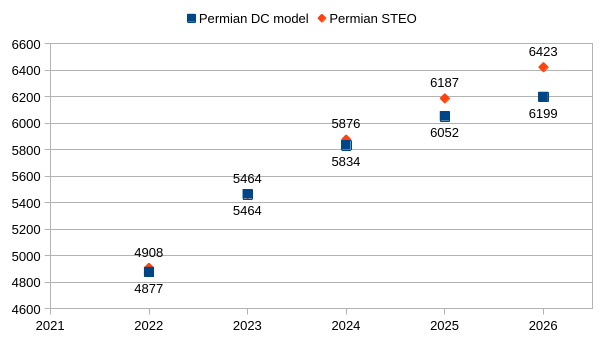
The chart above is in units of kb/d and represents Permian tight oil. The EIA STEO Regional Permian annual estimate had conventional output subtracted for 2025(443 kbd) and 2026 (427 kb/d). For 2024 the STEO Permian regional estimates for November and December 2024 were used with conventional output subtracted (453 and 451 for Nov and Dec respectively). The annual 2024 “STEO” estimate uses my Permian tight oil estimate for Jan to Oct 2024 along with the STEO Permian tight oil estimates from Nov and Dec 2024. The 2022 and 2023 annual “STEO” estimates are based on my Permian tight oil estimate (presented in previous chart) using TX, NM, EIA, and Novi data. The important differences are 2025 and 2026 where my estimate is considerably more conservative than the EIA estimate for Permian tight oil.
106 responses to “Short Term Energy Outlook, February 2025”
https://finance.yahoo.com/news/exxonmobil-seeks-permits-expand-oil-185600682.html
Exxon seeks permits to expand oil production in Guyana
Thanks for the report Dennis.
Interesting excerpt from your grid modernization link
https://www.eia.gov/todayinenergy/detail.php?id=63724
On electricity production costs over the last 20 years-
“Spending to produce electricity fell 24% from 2003 to 2023, mainly due to lower fuel costs and, to a lesser extent, the retirement of older, costlier-to-maintain fossil fuel plants. Fuel costs, the main operating expense, make up most of the production costs.
More recently, capital spending on electricity production increased by 23% ($4.7 billion) in 2023 compared with 2022. Most of this increase was driven by costs related to the construction of the Vogtle nuclear plant operated by Georgia Power. The fourth and final Vogtle unit entered commercial operation at the end of April 2024.”
On distribution- As pointed out earlier on the other thread, there is a big shortage and long lead time for electrical transformers, and the countries fleet of transformers is getting old.
https://www.utilitydive.com/news/electric-transformer-shortage-nrel-niac/738947/
Hickory,
You’re welcome, interesting piece, I was not aware there was such a problem with transformer availability.
We had two leases down for almost two months after our transformers were destroyed in a storm. Of course, we were towards the end on the priority list. That was March, 2023.
Several former collegues now works for Hitachi Energy Sweden (formerly ABB) and apparently they have a 5-6 year backlog, mostly HVDC things I think but probably lower voltage/AC stuff too, and seems to be worldwide, they are expanding and recruiting aggressively.
Perhaps a NG fueled genset powering the pumpjacks etc. would be a good insurance/investment, also in some cases reducing flaring. Perhaps not relevant in your case but the thought struck me.
Large distribution-scale transformers can have lead times of literally 2+yrs depending on the size and winding type. This is why a Carrington level event is such a scary thing. Transmission companies have been actively working with the government in getting critical spare units in place for just such an event for quite a while now. One large rectifier transformer we used in a previous project had a 36mo replacement lead time quoted so the owner bought a couple spares at the start of the project at the cost of about $10M just to have spares onsite if one were to fail. Many are made in China too.
A serious Carrington event, or large scale EMPs going off for some reason or not, then we would be in the stone age in about three days… At least locally/continentally,
Besides that, imagine what the less than 20 Yo´s would do without 4G? Stoneage would seem pretty nice indeed.
I think the idea that the US will provide Europe with oil and gas is at best an illusion. Maybe natural gas for some time, but both shale gas and especially tight oil will peak soon. 87% of US federal waters are off limits for oil exploration, so there might be more oil and gas on the East and West coast of America. Saudi Arabia is also probably close to maxed out production and will not be able to increase much more if the current White House administration demands it.
Thanks for great work Dennis, seems there will not be much increase in US oil production.
“I’m afraid we’ve never been this close to Orwell’s ‘war is peace, freedom is slavery, and ignorance is strength’ before.”
—Vít Rakušan, Czech minister of the interior, on X after U.S. President Donald Trump blamed Ukrainian President Volodymyr Zelensky for starting Russia’s war in Ukraine
I think he was refering to the 2015-2022 civil war in east Ukraine, and the shelling of Donbass and Luhansk, killing in the neighbourhoud of 14-16k, including a lot of civilians. Not mentioned a lot in western MSM btw., for some reason.
Btw. as mentioned much, much earlier, I more or less forced my then 15 yo daughter to read 1984, in english class.
Lets be clear.
-Russian Federation and Ukraine agreed to their border in 1994, after the fall of the Soviet Union, voluntarily and by mutual consent. Russia violated that in 2014 and 2022. Basic facts of the situation.
-The Russian invasions of Ukraine in 2014 and then in 2022 were both primarily about the taking of Ukrainian territory, and all of the economic assets contained…ports, rail, power plants, factories, farmland, and populations.
-The Ukrainian ‘civil war’ 2015-2022 did not involve any attack upon Russia.
-Zelensky was elected to office beginning in 2019.
Trump does not get to tear up history books.
[He does have immunity from crime committed while in office, as granted by his Supreme Court].
I beg to differ in some cases, primarily about 2014 but we can leave it at that for me. The future might tell.
To Alim, no infact I´m still waiting for my USAID check, hope it don´t bounce like last time… /s
Here is some on this topic
https://www.youtube.com/watch?v=_RNE3X41IvM
Many thanks, heard about it earlier but didn´t check it up, but it really covers a lot.
To new viewers, it´s Jefferey Sachs presentation to parts of the EU parliament, very well worth watching, should be mandatory to watch before engaging in any discussion about EU/Ukraine/Russia. It even includes Vickys “F the EU” quote btw., ~30 minutes in.
Hickory, I strongly suggest a view.
For me, not much new though.
I have listened to J.Sachs many times, so I know his views.
He has a big agenda which makes his stance on this matter about as right wing/pro-authoritarian as you can come up with.
I’m much more pro-democracy oriented. The extreme concentration of wealth among people like Sachs, Musk, Putin is a massive problem. He thinks its fun.
I think the order of magnitudes between Sachs and the others wealth are quite substantial.
Don´t shoot the messenger if you don´t like the news is my opinion.
Haha thank you Laplander for our weekly update of Kremlin propaganda. What would we do without you?
Hope you’re getting paid and aren’t just a useful idiot like Trump & co.
Lap,
Here is a better book:
THE ROSY CRUCIFIXION
You mean the Russian invasion of Ukraine 2015-2022
McKibben says the quiet part out loud about pending purchases of US LNG by Japan, India and Taiwan.
https://billmckibben.substack.com/p/nice-little-economy-youve-got-there
People, and countries, don’t like to be bullied. They do like to be shown respect.
These policies undercut the US foundation position in the world.
Big gift for China.
India and Japan already have in place large, long-term contracts to buy significant quantities of LNG from the US and have been doing so for about 7yrs now.
True enough… what is at a whole new level is the rude coercion directed at allies and trade partners.
“And by alienating our longtime allies and cozying up to Russia, we set ourselves up to be a pariah state.”
Pariah State. I never had thought of the US that way before. I guess others do, and with our help more and moreso.
Texas earthquake and exploding pipeline.
https://www.houstonchronicle.com/news/investigations/article/earthquakes-west-texas-pipeline-explosion-oil-20173749.php
Rig Report for the Week Ending February 21
– US Hz oil rigs increased by 8 to 448. Five were added in Oklahoma. The count is also down 11 rigs from April 19 and is up 21 relative to the recent lowest count of 427 on July 24th. The rig count has broken out of the very tight range between 427 and 442 in place since July and is on its way back heading for 450.
– The New Mexico Permian rigs dropped 1 to 95 while the Texas Permian added 2 rigs to 193.
– In New Mexico, Lea added 1 to 50 while Eddy dropped 2 to 45.
– In Texas, Midland was unchanged at 27 while Martin added 1 to 27.
– Eagle Ford added 1 to 43
– NG Hz rigs dropped 1 to 80.
Frac Spreads Rebound for the Week Ending February 21
The frac spread count rose by 7 to 210. It is also down 60 from one year ago and down by 31 spreads since October 11.
Seems to be a lot of trolling going on here of late. Very unappealing.
Regarding above about coercion in trade, the USA is in some trouble. We have a national debt of $37T. Last year we ran a budgetary deficit of $1.8T. We have an international trade deficit of $1T. If we don’t do something we’re going to go bankrupt. If the United States goes bankrupt, the world will revert to barbarism.
The only thing we might export to Taiwan, Japan and India (that they want or need) is the thing everyone needs: energy. The whole world is in the same (or worse) financial jam as America; therefore, they need cheap energy. Right now, unless we want them using more coal, that’s LNG. As noted, India and Japan have been buying LNG, but not nearly enough to narrow the trade deficit.
These countries, along with KSA and others, also want protection. It seems like a fairly good quid pro quo to me. Ukraine is the poster child for needing protection and wanting scads of money, with absolutely no quid pro quo. That dog won’t hunt, not now. I don’t especially like heavy-handed tactics but Ukraine will eventually sign a deal with the U.S. regarding the mining of rare earth elements in return for scads of money, war materiel, and perhaps even boots on the ground. The one-way street has more or less hit a dead end.
https://market-ticker.org/akcs-www?post=231949
Medicare and Medicaid is 2.2 trillion a year.
It is growing at 9% per year.
This is the source of all the budgetary problems.
It is due to monopolistic pricing practices, which are illegal, in the Healthcare industry.
Japan pays 80% less than the USA for the same procedures and technology.
This is not a Democrat or Republican thing, it is an existential threat.
If DOGE does not attack this all their efforts will fail.
The country will literally go bankrupt, the healthcare industry will implode and there will be rioting in the streets.
And the problem is Healthcare costs. If the Government were to cancel medicare…then the citizens will need to pay the exponentially growing costs.
Andre: You hit the nail squarely on the head. No one could have said it better.
Andre
It is not Medicare that is the problem, it is 150 million people who are overweight or obese and do little exercise and eat stuff that is full of artificial flavours and chemicals.
https://obesitymedicine.org/blog/health-economic-impact-of-obesity/
It is not just the costs of diabetes treatment or hip replacements but the fact that millions can’t do any work to pay tax.
Then the cost of crime, not just the police and courts and prisons, but the psychological and physical impact on millions of people, robbed, attacked defrauded, murdered.
https://www.researchgate.net/publication/358417739_The_Aggregate_Cost_of_Crime_in_the_United_States
A minimum of $2.2 trillion in total societal costs.
The U.S. has supplied about $150 billion in weapons and humanitarian aid to Ukraine in 3 years or about $50 billion per year. A fraction of what obesity and crime costs each year.
Ukraine is not bankrupting the United States. You need to look on your doorstep for that.
“It is not Medicare that is the problem”
The problem is that healthcare costs are growing at 9% per year due to monopolistic pricing practices and the end of this FY will be 2.4 trillion!!!!
This cannot be denied.
If you were to eliminate Medicare and everyone started eating vegetables and no sugar….the healthcare costs would continue to rise exponentially. Only the citizens would have to figure out how to pay for it not the government.
Seriously, look at a pie chart of government expenses. Medicare is obviously the biggest wedge and it is growing exponentially!!!!.
Andre
A few honest doctors have said 90% of patients who come to see them and then go on to have further treatment, have self inflicted conditions.
You could take your Medicare and reduce it by 90% if people were not so ignorant of how to keep healthy. The $2 trillion cost would be reduced to $200 billion. Regulation of costs would make it even cheaper.
Crime is causing even more destruction to the country with a total bill of up to €4 trillion a year.
If people were nice to each other we wouldn’t have war.
If people wouldn’t have sex we wouldn’t over populate the planet.
If people followed the law we wouldn’t have crime.
Healthcare costs are rising exponentially at 9% per year and it is because of illegal monopolistic practices. Enforce the law and the costs go down by 80%.
But it will destroy the industry (20% of GDP and growing) and it will need to be rebuilt.
The current US administration has no will to contain drugs prices in contrast of the efforts of the previous administration. It has even suppressed an office dedicated to that. The result is that with health spending per capita twice as high as in other health systems, Americans have a smaller offer of care than elsewhere. This is because the difference goes into the pockets of CEOs, shareholders and financial markets. By destroying the official systems, medicare and medicaid, the DOGE goes strictly in the opposite direction of what should be done. An unified healthcare systeme would have an enough weight to impose drastic decrease of price. And about the fight against the monopolistic positions in private sector, the Trump administration wants to suppress the FTC (Federal Trade Commission) while it is sharing with DOJ, in a spirit of cooperation and working in a complementary manner, the possibility of launching judicial proceedings for monopolistic positions. https://www.legaldive.com/news/lawmaker-wants-antitrust-consolidated-under-DOJ-Alden-Abbot-jon-dubrow/737608/
The problem with American healthcare is twofold: First, healthcare providers are paid for treatments instead of for cures. In other words if you get your knee operated on for $27 000 and have to go back for a follow up six weeks later, the second operation is likely to cost another $27 000. Obamacare addresses this to a certain extent, but not really.
The bigger problem is that insurers are allowed to screw the insured. This is a market distortion that drives prices through the roof. If the system worked properly, patients would pay insurers a monthly fee and insurers would pay their medical bills. If the bill seemed unreasonable to the insurer they would address the issue with the healthcare provider, not just screw the patient. An adversarial relationship between payer (the insurer) and healthcare provider is the only way to run a market based healthcare system.
The national debt can and will double without any real consequences. Our T-bills are the collateral that underpins the entire global monetary system. Notice that bank reserves created at the a FED don’t underpin the entire global monetary system. Bank reserves and therefore central banks don’t matter.
Commercial banks however have absolutely no problem creating loans or money to lend to the government. Only reason M2 has stayed flat over past 3 years is government spending financed by banks more than willing to lend to the government. Banks are buying government debt instead of making loans into the economy. Loan creation might look good on paper but it’s just an illusion.
The economy without the government spending would be in a massive contraction.
Yes some governments are selling US debt. But it’s because there is a dollar shortage they are trying to fill.
The government debt isn’t what we need to worry about. It’s the private debt that we worry about being serviced and repaid.
“The national debt can and will double without any real consequences”
That’s difficult to believe.
Your Bank Reserves arent real money and can’t be spent in the economy
and the FED doesn’t matter, is not what is taught in mainstream economics or finance.
There is no empirical evidence of this that I am aware of.
Yet there is lots of evidence of governments having debt problems.
https://en.wikipedia.org/wiki/List_of_sovereign_debt_crises
Andre,
Not all governments have the fortune of their short term debt being the collateral that underpins the entire global monetary system.
There is unbelievable demand for US T-bills. The US government is in no way shape or form in danger of not being able to fund itself.
The lie that central banks are the center of the monetary universe is perpetuated widely. But reality is commercial banks don’t need bank reserves to make loans. Never have and never will.
As unemployment picks up through out the rest of the year and demand along with long term bond yields fall. And oil prices fall, and interest rate cuts start happening rapidly. The interest paid on government debt will fall dramatically.
It’s just what a contraction looks like. There is a reason why the government is talking about giving every tax payer $5000.00 Which amounts to a stimulus check.
It would amount to a replay of pandemic stimulus. We’d see a weaker dollar for awhile while the stimulus ran it’s course then the dollar would spike higher as it would amount to a one off stimulus.
Growth nowadays requires artificial stimulus. Growth in China requires artificial stimulus in the US to create demand. Think about how profound that is.
Gerry
You say “Ukraine No quid pro Quo”
How do we the West put a price on what the Ukraine has done for us. Which country would have been next if the West didn’t step in. Recall that at first Russia attacked Georgia to test the West and we did nothing. Then little green men attacked Donetsk and Crimea and we did nothing.
This little country took on the world’s “Second most powerful Army” and showed how weak that military power is. Thanks to the US’ superior weapons and better intelligence along with the military and humane assistance from other allies, Ukraine has been able to almost bring Russia close to bankruptcy after three years of fighting.
It is unfortunate how the tide turned on January 20.
Hi Ovi: I suppose my point in including Ukraine (which shouldn’t have been involved in the discussion at hand about energy) is that the U.S. has “fed” the Ukrainian war effort to the tune of God only knows how many billions of materiel and dollars. And the U.S. is going bankrupt and can no longer act as the policeman for the world without getting something (tangible) back.
Your point is well taken: the whole western world got something back; we watched Putin retreat multiple times and his army die by the thousands. Look, my point is that the U.S. has such a massive national debt that the interest is greater than what we spend on defense, despite the world going crazier than a loon. We spent money to the tune of 1.8 trillion deficit last year. Andre is right: our medical system has become just another capitalistic tool where you grab all the money you can get, and that has resulted in an incredible burden with prolongation of expected life.
I am not Mr. Trump’s apologist; sometimes I look at what he says or does and groan. But a good point has been made by Ray Dalio and other financial wizards: if we don’t change things we are going bankrupt. HHH says no big deal; Jaime Dimon says it is. The European Union has to spend more on defense, and–please take this in the manner it is intended–so does Canada, as does all of NATO.
The war in Ukraine could grind on for another four years. At that point, with the amount of money the USA is throwing at it, and if we don’t change things, we will be bankrupt. We can’t do this much longer! I will give the Ukrainians all the kudos in the world, and even make a speech for the grit of the Balkan states of NATO, but this has become a transactional war (at least under this president). Quid pro quo will probably mean rare earth elements in exchange for help with the defense of Ukraine.
To complete the circle of this thought process, Taiwan is going to be in play at some point. Our only treaty is with mainland China, not Taiwan. The Taiwan Semiconductor Manufacturing Company is spending 70 billion on some fab plants in Phoenix. But we need something more to tie us to Taiwan and them to us. That thing is balanced trade: LNG v. chips. And when Mr. Xi decides to invade and take over Taiwan, in my opinion we should come to the aid of Taiwan, treaty or no.
And while I read some in this forum bash Elon Musk, I submit that if Mr. Musk hadn’t put the Starlink over Ukraine early in the war, all of Ukraine would be under control of Putin as we speak. The power of Starlink allowed geolocation, precise missile guidance, communication, and much more. That was done for a country that was said to be the most corrupt country in the world by a variety of geopolitical analysts. The Starlink was put in the sky purely as a humanitarian gesture, to give Ukraine a level playing field–it was a game-changer. But enough is enough. This damn thing has to end.
Gerry
It is unfortunate that Ukraine was so corrupt and riddled with Russian spies and Russo/Ukranian Oligarchs who didn’t know where their allegiance was. It is unfortunate that the KGB lied to P and told him their soldiers would be welcomed by cheering crowds. Regardless somehow in spite of all this Ukraine managed to survive.
With regard to the US debt, a more equitable tax regime might help. With regard to the money spent in helping Ukraine, I think the majority was spent in the US making military equipment which was then sent to U. From what I have read, those Bradley’s are awesome with their protective armour and their cannon takes out the best Russian tanks. Through the last three years, the US GDP has grown every quarter along with the stock market. Any idea how much this war has contributed to the US GDP and what happens to the US economy as militarily aid and spending is cut.
We all want this war to end. Can we find a way of ending it so that the world knows that another world threatening war should not be started.
yes, OVI,
lots of mis-informations from both sides, before and during the war,
Before the war:
Dugins in Russia: easy repeat of 2014, and west will give up Ukr, and Russia-US alliance will enable Russia to take huge influence of east EU and even much of northern CN (he mentioned Great Wall if not Yellow/Yangtz river) like after WW II
West Neocons: Putin’s Russia is like dictators in Color Revolution, like Gaddafi of Libya.
actually ending the war now is reducing the risk of the world, the Neocons have to face facts:
0. US and west failed to defeat Putin’s Russia and win the easy victory in first 2 years.
0.1. Even if putin got defeated but stay in power, the war might get out of control and become a NATO-Russia direct WW III
0.2. If it is an easy victory, like Putin got killed in coup and Russia disintegrate again, then that’s great for Neocons, but this did not happen, on the contrary
1. Russia got upper hand now in the 3rd year obviously, and China benefit and US and west economies also hurt
1.1 continue the attrition war although hurts Russia, but it also hurt US and west, and benefit China more
1.2 least: all young Ukraines die, no hope to win, unless new weapons much more powerful than current Starlink and UAVs could change the course
About Musk. He gave Starlink but only as it was profiting to him. He is ready to give starlink to Russia and did it because that’s bringing him some benefits. That was not humanitarian. About the money spend in Ukraine : 100 billions dollars in four years. If this war is still ongoing it is because of the nonsensic restrictions to the supply and use of occidental weapons to Ukraine. Nothing can be done seriously about transactional war with a US president obviously blackmailed by Russia, first by KGB at the end of the 1980s and by the FSB after. I am astonished that he is not able to go beyond that. People have voted for him despite all the pans that go with him. I don’t see what some old kompromats would have changed. That shows how a weak person he is.
More on US budget math
https://www.youtube.com/watch?v=TCyysMU66VA&t=50s
Dennis
That’s a lot of good work you put into this STEO report.
Took a look at the supply demand situation for All liquids in the Feb STEO. I find it almost impossible to believe.
From Jan 25 to December 26, 19 months are in a supply surplus. From Jan 25 to July 25, the STEO is showing a supply increase of 2 M/d. In Tab 3btab, of that 2 Mb/d, the STEO is showing a production increase of close to 800 kb/d each for US and Brazil. Difficult to believe.
This chart seems to be saying no OPEC increase for 2025.
Thanks Ovi,
I agree the STEO is very optimistic. Not sure how useful global liquids is as a measure as a larger and larger proportion is NGL, the crude plus condensate portion is of greater interest as that is the main input to gasoline, diesel and jet fuel which are the most important of the petroleum products that move people and goods on land and by air.
Dennis
Have you seen anything similar to world refinery inputs in the EIA data somewhere that could be used as a proxy for C + C demand?
Ovi,
I have been reproducing the OPEC estimates for World crude refinery input in the OPEC reports lately. In 2024 the average World refinery throughput was 80.84 Mb/d, about the same as 2023. Note that this table is from the January 2025 MOMR.
“the average World refinery throughput ”
this is the most important metric regarding trends in global oil
Updated refinery data from Feb 2025 MOMR, slight revisions to 2022 to 2024 World data compared to Jan 2025 MOMR. The largest revision was to the 2024 estimate as expected. 2022 revised up by 0.07 Mb/d, 2023 revised higher by 0.06 Mb/d, and 2024 revised higher by 0.21 Mb/d from the Jan 2025 MOMR to the Feb 2025 MOMR. It is likely there will be further revisions in future months, especially for 2024.
Click on chart for larger view.
can not believe France&UK&Germany refinery capability is so low, probably relocate to Singapore and S Korea and India
Sheng Wu,
In 2023 European consumption of gasoline, distillate fuel (diesel), jet fuel/kerosene, and residual fuel was 10973 kb/d according to EIA data, this tracks pretty closely to the European refinery throughput of 11850 kb/d estimated by OPEC.
For France, Germany, and UK their consumption is more than their refinery throughput for the primary 4 liquids so they likely import fuels from elsewhere in Europe.
There was some discussion here recently about the Moss Landing fire. Some interesting commentary here about this rapidly evolving part of the electric supply system and the reasons why this is likely not an indicator of future reliability.
https://www.canarymedia.com/articles/energy-storage/moss-landing-fire-reveals-flaws-in-the-battery-industrys-early-designs
Even more interesting is the dramatic 16%/yr drop in battery prices over the past 14 years and the example of what this can do for a grid. Article cites 11.2GW of installed battery capacity in CA at 2024 year end, with an example of the associated dramatic reduction in reliance on natural gas when the sun goes down.
https://www.canarymedia.com/articles/clean-energy/6-charts-that-show-how-the-grid-is-getting-cleaner
Leaving aside the black box academic analysis, this type of real world data certainly illustrates that there is a choice in how to move forward and still keep the lights on.
Above: It was I who voiced concern about the Moss Landing battery fire. The article you appended was well written but missed the point. This was a revolutionary electricity storage battery dump when constructed in 2020, but it was also very poorly thought out–not only in composition of batteries but in location. That was my purpose: to point out what something like this (the future, no doubt) can do to the environment. I did not point that out to defend any environmental hazard from fossil fuels but rather to illustrate that no form of energy comes free of charge, and we’d better be careful where we try something so new.
My research on the subject had to do with the fact that the old Moss Landing gas-powered utility plant, which had been in use since the twenties, was located 15 miles from my home in beautiful Carmel-by-the-Sea. The community was comfortable with it, and that the smokestacks were high enough to catch the prevalent ocean winds and disperse quickly. The gaseous effluent from that plant was nearly nulled out by dispersal, in fact, which is dramatically important when you consider where the plant is located—the exact site of the new Tesla lithium ion plant. If you drive over the little mountain range about fifteen minutes east, you come to the Salinas Valley, which is the salad bowl of America. If you drive north an equal amount of time you come to Watsonville, which is the strawberry patch of America. Within three miles of the plant is the Elkhorn otter sanctuary. Within seven miles is Pebble Beach, a rotating course for the U.S. Open and multiple other tournaments, as well as the largest car show in the world. In the nearby village of Carmel are residents who have come there to escape the hurried pace of the world.
From my friends who still reside there I receive reports of a high level of anxiety. New testing of soil and wind, not to mention the otters, is sure to reveal toxic levels of some very nasty gases. I am not an opponent of electricity storage; in fact, just the contrary, I think it’s a grand idea long in coming. My point was that a state that is prone to lecture the world about environmental hazards might consider putting a dangerous chemistry lab experiment somewhere less proximate to our food sources. The air quality was and is quite a bit worse than the author illustrated, and the threat to food supplies was/is substantially more vivid than one might imagine from reading this pro-battery article.
https://www.youtube.com/live/Hxa-hctXdIM?si=mOZ-K1eOBMi9akFl&t=61
Art talks about his changed view of peak oil
Sheng Wu
I have not followed Art enough to know what his changed view. Listening to part of the discussion I got the sense that for him peak oil was not an issue anymore. Is that correct?
I struggled a bit with the audio.
I should say Art has been more flexible or following the fact in shale patch than some other peakers.
Yes, he used to hold that shale oil and gas are not going to be profitable and not able to survive or count as real TRRs. Now, Art and we all have to face the fact that shale oil and gas survived low prices, and could produce quite some, 100GB oil TRR. According to Art, see video at 1:02:27, Art even put Saudi oil cost at $45 full-cycle cost (he probably included some social security cost in Saudi, when he only disputed the $3-4 cost as lifting cost), just $5 below permian oil.
yes, the detailed TRR numbers for oil and gas and the peak model are still to be debated, but the lowest realistic numbers have totally changed the old peak oil model
If I interpret Art updated logic, it should be — face the fact, price and technology will significanly enlarge the TRRs, almost enough when we add a lot more other energies, i.e. nuclear (fusion) renewable and battery assisted.
Sheng Wu,
As solar, wind, hydro, and nuclear power expand, the demand for oil and natural gas will fall and lead to lower oil and natural gas prices. This will reduce the economically recoverable resource (that which can be produced at a profit) to below the mean TRR estimates. Peak oil and natural gas will be less of a problem for those that see it coming and invest appropriately, China seems better positioned in this regard as they have focused on solar, batteries, and electric land transport and have left the west behind.
Sheng Wu,
That video from Art contained some outstanding information and I thank you for posting it.
(As an industry professional, your contributions greatly enhance the value of this site.
Along with most of the other industry professionals, your observations carry particular ‘weight’.)
Possibly the most important info on that video comes during a ~90 second clip – 21:20 to 23:10 mark – when Art disclosed that upcoming programs – funded by the DOE – aim to drop oil recovery costs down to the $15 to $25/bbl range. As this statement came after Art had a lengthy meeting with Chris Wright (an individual whom Dennis disparaged a few years back as “not being the brightest tool in the shed”. Hilarious , that one, Dennis), Art is almost certainly referring to EOR … Enhanced Oil Recovery.
Wright was leading Liberty when the truncated Stomping Horse EOR venture took place in the Bakken about 8 years ago.
Long story short, one can expect an uplift of 25% to 40% (or more) from existing wells that successfully employ re-injected natgas and/or water and/or CO2 into the surrounding matrix.
Those of us long time EOR advocates may get to see these efforts widely implemented throughout the oily shale basins.
Coffeeguyzz,
Just because a government program aims for low oil recovery costs does not make it a reality.
I will go with oil pros who suggest tight oil is not profitable at $70/bo in 2025$ for a wellhead price while natural gas remains at $3/MCF or less for most tight oil plays at the wellhead.
I will believe that the profits will occur at $20/bo (2025$) when I see it for a tight oil play in the US.
This one is like your claim that Bakken URR would be 30 Gb (or was it 50 Gb)? I don’t believe every word of hype ever written, you should try it.
There have been a number of studies on tight oil EOR, not clear that it has been shown to be cost effective.
The article below (from 2019) suggests in certain situations this can be effective, a fair amount seems to be happening in Eagle Ford.
https://jpt.spe.org/shale-eor-delivers-so-why-wont-sector-go-big
Here is a more recent update that suggests early optimism may not have been warranted.
https://jpt.spe.org/shale-eor-prospects-remain-dim-this-decade-yet-experts-call-for-sustained-investment-and-optimism
Excerpt:
Sahai pointed to Houston-based EOG Resources’ groundbreaking 15-well huff-and-puff pilot in the Eagle Ford Shale of south Texas that sparked sectorwide interest when it was announced in 2016. Uplift from the group of wells was initially projected to be between 30 to 70% above initial production. However, the reservoir engineer from Ascent said recent public data show their actual incremental recoveries are on the order of only 10 to 40%.
“What we learned from this is that gas injectivity is not a problem; we can inject and we can see pressure buildup. The issue is that recovery is significantly lower than what was actually touted back in 2016,” he said.
Coffeeguyzz,
Thanks for your compliments and encouragement always and I want to say your optimism has been an inspiration for me to stay in oil and gas!
I am actually a late new comer in oil & gas, including the peakers group only after 2015?
Just throwing some brick here and other media to sell my busines/services and learn something.
Here is another brick for the lower recovery at the peak model by Adam-Rozencwajg
The reason behind the smaller recovery at peak, i.e. 37~38%, for shale/tight oil, instead of conventional oil’s peak ~50% recovery, is lack of enhanced oil recovery. Tight oil could not use water flooding and other EOR techniques that conventional oil field has been using.
Sheng Wu,
Although water flooding cannot be used for shale EOR, it CAN and HAS been used to form an elevated pressure ‘boundary’ wherein 2 outermost laterals had water injected and several interior laterals were treated huff’npuff style with field gas.
A small Canadian outfit (Granite Oil) did this in the Bakken formation a decade ago with modest success. (Granite is no longer around).
The thing that caught my eye in regards to Art Berman’s comment regarding US government funding with the purpose of dramatically lowering oil recovery costs (EOR was not mentioned … just my speculation), was the government-funded impact on large volume, high pressure gas compressor manufacturing.
For about a year, I followed the quarterly reports from the few US companies that manufacture these units (the scarcity of which is mentioned in one of Dennis’ linked articles). The executives were ecstatic about the profitability of these units as US government funding/subsidizing – explicitly stated – played a large role in buyers being relatively unconcerned with their high cost. (The end use for these compressors was largely for CO2 sequestration projects).
High volume, high pressure, brief injections of wet field gas (y grade might be optimal but likely too impractical and expensive) seems to currently offer the best potential. Government backed research might go a long way in bringing these efforts to fruition.
LOTTSA oil still sitting underground, surrounded by bokoo infrastructure looking to be more efficiently utilized.
Do the contributors of this website believe that the banks and investors who put billions of dollars in the LNG industry, did they do the rigorous due diligence and believe that there are decades of natural gas reserves and demand to get their investment back. If so, it’s a bet against peak oil.
Banks and investors make bad investments all the time. Usually based on bad information. Commercial real estate never goes down in price, right?
Or collateral never gets repriced. Think, all the unrealized losses sitting on the banks balance sheet currently.
Speaking of collateral, when it comes to oil and gas. The stuff outside the core sweet spots. The goat pasture as Mike likes to put it. What happens to the value of the collateral out their in the pasture when you need higher prices to make it work but can’t seem to get higher prices?
A lot of the large LNG contracts are “take or pay”. The liquefaction facilities don’t want the exposure to E&P commodity prices and are not interested in owning the actual natural gas. They prefer to operate more as just a liquefaction service. They’ll liquefy the gas but it’s up to the end customer to source the gas and get it delivered, via pipeline, to the liquefaction facility. The facility then liquefies it and loads it onto the ship for the customer. What happens after that is up to the customer, the liquefaction facility doesn’t care. I guess what I’m getting at is that the LNG facility doesn’t care about reserves – that’s the customer’s problem.
The “take or pay” part of it comes into account should the customer not source any natural gas to the liquefaction facility. They can decide they don’t need any LNG, but they’re still going to have to pay the facility either way (or declare force majeure – contract penalties).
You can’t just start and stop these cryogenic processes at will without significant thermal stress on the various vessels or piping in the facility, so it’s in everybody’s best interest to keep them online if at all possible.
Thanks guys for the thoughtful responses.
I can’t comprehend that the LNG industry is based on the, Greater Fool, theory.
I certainly hope not.
The part I didn’t explicitly say in my above comment because I sort of assumed it implicitly…the customers who are sourcing the gas to these facilities aren’t idiots. They’re spending tens of billions of dollars in capex to pay for the construction and operation of these facilities. They aren’t going to enter into such a contract unless they’re confident the source gas is there, so they do their homework with the E&P companies ahead of time.
LNG Guy,
I think they may be fooled by the Potential Gas Committee and may be optimistic about how much of the claimed TRR is likely to be profitable to produce. Have you ever listened to an investor presentation? The presenters are very optimistic while claiming that their estimates are very realistic. If we use tight oil as an analogue and look at the oldest tight oil play (Bakken/Three Forks) the USGS mean TRR estimate is roughly 12 Gb for North Dakota Bakken Three Forks (where most of the tight oil has been produced for this play). A realistic ERR estimate for the play is about 8 Gb, so about 67% of the mean TRR ends up being profitable to produce. For US shale gas the USGS mean TRR is about 2300 TCF and 67% of that estimate is about 1540 TCF, with peak at about 50% of URR this implies a peak at 770 TCF. Shale gas has grown at about 1.8 TCF per year from 2008 to 2022 and if we assume that rate of growth continues from 2024 to 2050 we reach shale gas output of 50 TCF per year in 2035 at a cumulative shale gas output of 770 TCF. Scenario presented below. LNG facilities will be underutilized from after 2035 unless there is a sharp drop in US natural gas consumption that allows most natural gas to be exported.
Also keep in mind that conventional natural gas is likely to continue the 6% decline per year we have seen from 2008 to 2022.
I don’t have the patience to sit through investor presentations, though I have contributed to the actual presentations themselves when they are drafted. I’m just an engineer, and what the deal teams and executives do with my input after I’ve provided it (“massage” the data is the term we use) is on them. As long as I can go to sleep at night knowing I did thorough engineering diligence that’s about all I can ask of myself.
It’s up to the potential customers to do their own diligence on whether the reserves are there. Naturally the deal teams are going to present whatever data they have in the best light possible, they’re essentially salesmen when it boils down to it and have huge compensation structures in place to encourage them to make the deals happen.
I have been beating the shale “red-queen” horse for almost 20yrs now. Eventually it’ll happen, but if I had been in charge then the export facilities’ contribution to GDP would never have been made and many billions of dollars never moved to shareholders. Maybe that would have been a good thing, IDK. Like I said, I’m just an engineer when it comes down to it so am only a bit player in this market.
A number of these facilities were import terminals prior to being converted to export facilities. Worst case, they can pretty easily reverse the process and go back to importing again…assuming there’s somewhere to import the gas from.
LNGGuy,
The Genie cannot be put back in the bottle, but we could stop letting them out as it were and slow down the approval process for new LNG export facilities. I imagine the cryogenic equipment needed for the LNG trains is not cheap and it is a waste of money to build a lot of these facilities which later become stranded assets. The laissez faire doctrine that suggests perfectly competitive markets leads to the most efficient allocation of resources has a number of unrealistic underlying assumptions which renders the model fairly useless in the real world.
True the genie cannot be put back in the bottle. The permitting process does seem to have slowed down somewhat. Ultimately I believe all the gas will be used up one way or another, the question is just how fast. The export plants do make a lot of money for investors and the niche industries supporting the facilities and constructing/operating them. It’s easy GDP for politicians to tout so it continues to go on.
LNGGuy,
Somebody in the government needs to look at actual natural gas that can be produced and realize that too much export capacity is a waste of resources, in any case anyone investing in this space should consider the scenario I have outlined and whether the LNG projects currently being build or considered for FID will be profitable after 2035. In 10 years time (possibly 15 years if the rate of growth slows) US natural gas output is likely to be decreasing.
Dennis,
This shale gas peak and decline is much faster than shale/tight oil.
Consider Marcellus has a much slower decline and Permian has GOR going up, i.e. gas decline slower than oil.
I heard US E&P companies are also tapping for deep coal-bed methane now with the same fracing technology in shale gas, after the apparent success in China. Consider the US have just as much coal reserve than China if not more, the US probably has just as much coal-bed methane accessible with fracing as shale gas. Appalacian has tons of coal above Marcellus, and rumors say as thick as 1thousand feet coal bed.
Sheng wu,
The estimate is based on probable resources, and alternative scenario using 67% of the mean TRR estimate of the Potential Gas Committee further down the thread. The PGC evaluates coal bed mathane as well, those resources are included in the estimate.
How much coal bed methane does China produce per year? Not clear this is a profitable venture. The shape of the production curve is unlikely to look like my scenario, I did a very simple straight line up (at 2008-2022 average annual rate of increase) with a symmetric line down after reaching 50% of URR. The 67% of TRR for URR is based on North Dakota Bakken/Three Forks tight oil which has a TRR of around 12 Gb and a likely URR of about 8 Gb, for shale gas it might be higher or lower than 67% prices of natural gas and competing energy sources will play a role in determining the amount of TRR that is profitable to produce.
the coal-bed methane in China used to be strictly shallow (1500m, and could be produced efficiently with fracing in shale gas, each well could have over 3MCFPD easily, and the cost is usually lower due to still shallower depth and lower pressure of fracing.
The production of coalbed methane more than tripled in just 2 years, from 0.5 BCFPD to over 2BCFPD. Because coalbed methane is not as tightly monopolized by big 3 oil companies, and a lot more companies are jumping in. It is possible to surpass China’s shale gas this year, which is 2.5BCFPD. It is expected to increase to 5BCFPD in less than 3 years.
Sheng Wu,
For the US 5 BCF/d doesn’t really move the needle when total natural gas output is 100 BCF/d.
US Coalbed natural gas output was about 5.5 BCF/d in 2008, but has fallen to about 1.9 BCF/d as of 2023, gross gas production in 2023 averaged about 125 BCF/d with marketed production at about 118 BCF/d.
true, for over 30 years, China tried to copy first the Coal-bed methane (CBM) that the US had modest success before year 2000. China’s Coal-bed methane production never pickup really, hovering less than 0.5BCFPD until 2 years ago it start to fast track now to over 2.5BCFPD.
There are huge differences between CBM production “before 2000 in US and before 2019 in China”, aka BEFORE and now in China, aka NOW —
1. The CBM BEFORE was not targeting anything deeper than 1.5km, and in fact CBM BEFORE was considered impossible at over 1km. NOW, they are targeting over 1.5km to over 2km.
2. The CBM BEFORE was not using large scale water fracing, and CBM NOW uses similar water fracing in shale oil and gas.
3. The IP increased 10X or more and production much similar to shale gas.
4. The resources of CBM >1.5km is considered to be at least 3 times larger than the shallow <1km CBM now in China. Actually, the shallow CBM in China had been so much pain to develop that the TRR CBM had really been a Theoretical Recoverable, not Technically Recoverable number.
Sheng Wu,
Perhaps the US will go after this resource if it is profitable for a private enterprise. Sometimes the projects in China are supported by the State, less so in the US. The coal bed gas is more significant for China as 2023 dry gas production was only 23 BCF/d vs 104 BCF/d for the US. China has seen significant growth in natural gas output since 2013 with an average annual growth rate of about 7.5% based on EIA statistics. US growth in natural gas output was only 4.6% per year over the same period (using OLS exponential trendline).
https://www.eia.gov/international/data/world/natural-gas/dry-natural-gas-production?pd=3002&p=00g&u=0&f=A&v=mapbubble&a=-&i=none&vo=value&&t=C&g=none&l=249-000000020000000000000000000000000000000000000002&s=315532800000&e=1672531200000
Europe and Asia are buying delivered LNG at a price that is currently extremely profitable $3 for gas, $2 to liquify and ship, and $5 to $7 for profit split among all themiddlemen, liquifiers and shippers. The end user is paying $12 or so per mcf currently. That being the case, the price of the raw gas can go up to $8 or $9 per mcf and the system still works. How much gas is available at $8. How much is NA consumption going to fall at $8. How much coal is going to be burned for electricity at $8 per mcf wellhead price?
Yes gentlemen, there is a lot of gas available to feed the LNG plants.
C185 pilot,
The question is how long the natural gas will last and what will future demand for gas be? Note also that if natural gas prices are low, less of the remaining gas will be profitable to produce. The LNG facilities are designed to last at least 20 years, perhaps 30 years, if the gas to feed these plants (at a price that is competitive on the World Market) runs short in 5 or even 10 years, the return on investment for these LNG facilities will be very low, likely a loss. It would not be where I would be investing, betting the ponies would be lower risk.
Here is the potential gas committee estimate from year end 2022, note that the best estimate is the “probable” resources, this is the engineering best estimate where there is a 50/50 chance actual resources will be either higher or lower than the estimate.
Note that proved reserves of natural gas at the end of 2022 were about 625 TCF so for the TRR mean estimate we would have 625 plus 1077 TCF = 1702 TCF. US cumulative production up to Dec 2022 was 1422 TCF which implies a URR (if the probable resource estimate is correct) of 1422 plus 1702 equal to 3124 TCF of natural gas. If the peak occurs at the halfway point this implies a peak at 1562 TCF. At the end of 2024 US natural gas cumulative production has increased to 1498 TCF with about 38 TCF of natural gas produced in 2024. Thus 1562 TCF minus 1498 TCF is 64 TCF until peak which would be less than 2 years at the 2024 rate of output, so an implied peak in 2026 for US natural gas output.
There is less US natural gas resource than many are led to believe because often people look at the “possible” and “speculative” resources claimed by the potential gas committee and do not realize that there is about a 5% probability (or lower, speculative resources would be about a 1% probablility or less) that this much resource will actually be recovered.
From page 2 of document linked below
https://www.aga.org/wp-content/uploads/2023/09/PGC-2022-Report-Executive-Summary.pdf
click on chart for larger view
Dennis, I’m not too confident in that line of analysis that LNG export will run out of feedstock before making $$$. Proven reserve numbers are more for banks needing a worst-case scenario review. To me, they are a very lagging indicator and too overly conservative and not very good for predicting real world production deliverability and demand trends. From what I see while trolling nearly real time map and well data, deliverability of nat gas is ample to supply the LNG buildout and sustain it and our domestic demand for the reasonably foreseeable future.
Comstock’s recent confirmation and continued delineation of its Western Haynesville play is another example of our immense nat gas blessing in the USA. 11 wells now online at an average IP of 38,000 MCFGPD. Yes declines happen, but so far it’s not that aggressive…. an early well, the Neyland #1 came on line in Jan 2024 making about 28,000MCFGPD average the first full month and has since settled in around 18,000MCFGPD 12 months later. It has made 6.7 BCF and is still making half a BCF per month. This sucker will probably end up with a 65-75 BCF EUR eventually. Even at $2.00/MCF average, you’ve probably made a nice return.
With almost 700,000 gross acres in the play so far, that’s an awful lot of location running room to feed this production into the nearby LNG export hub.
https://investors.comstockresources.com/static-files/518d3af8-d51a-48a1-b799-78501da628b9
Now… what other plays are out there have yet to be discovered? Humans are exploring every day for the next one. It’s just my hunch, but proven reserve numbers do not seem to translate fully into what can be delivered in reality.
Gungagalonga,
These are not proved reserve numbers, they are 2P resource estimates, “possible” resources have about a 5% probability of being realized based on engineering best estimates, “speculative” resources perhaps a 1% probability of being realized. That’s for the Potential Gas Committee. If we look at USGS estimates which oil pros tell me are ridiculously optimistic for the mean TRR estimates, I take 67% of the mean TRR as being reasonable (this implies for example about 50 Gb URR for the Permian tight oil). Doing the same for shale gas I get about 1500 TCF for shale gas which will peak in 2035 if output increases at 1.8 TCF per year (the average rate of increase from 2008 to 2022 for US shale gas). This would mean that shale gas output increases from 30 TCF per year to 50 TCF per year over the 2025 to 2035 period and cumulative output reaching 750 TCF in 2035. The scenario assumes a drill baby drill mentality and full steam ahead on new LNG export facilities. US consumption has been about 33 TCF per year and has increased at about 0.7 TCF per year over the past 10 years, if we assume that rate of increase continues US consumption would be at 40 TCF by 2035 and we would be able to export 10 TCF per year (27 BCF/d), if output is 50 TCF per year in 2025 and consumption is 40 TCF per year. Note that recent exports of natural gas (most recent 12 months) was about 7.8 TCF per year with LNG exports being about 4.4 TCF per year with the rest being pipeline exports to Canada(1/3) and Mexico(2/3).
The EIA expects planned LNG facilities being built or already approved will bring US LNG capacity to 21.2 BCF/d by 2028 (or 7.7 TCF per year) when we add the pipeline exports (assuming these are unchanged from 2024) we have total exports of 11 TCF per year in 2028. We will have a problem if more capacity than this is built. See link below on LNG plans.
https://www.eia.gov/todayinenergy/detail.php?id=64224
Shale gas output has been stick at about 30 TCF per year for the past 18 months, Waha Hub prices were close to zero in early January (12 cents per MMBTU), higher prices might lead to increased output, note also that US export capacity for natural gas is expected to reach 8.94 TCF per year (24.5 BCF/d) by the end of 2025, this increased demand for natural gas may drive up prices and perhaps lead to higher shale gas output. In addition the higher natural gas prices may lead to more expansion of solar and battery projects as natural gas power may become less competitive in the power sector as natural gas prices rise. Also heat pumps may become more attractive with higher natural gas prices, further eroding natural gas demand. If demand for natural gas for heat and power in the US starts to fall, this could provide more natural gas for LNG export facilities. Much depends on the future price of natural gas as well as the price of electric power from solar and batteries compared to the price of electric power supply from natural gas, new small scale nuclear power could also be part of the mix.
Chart below is trailing 12 month average of shale gas output. Output of 1 TCF per year is 2.74 BCF/d, if you think in terms of BCF/d just multiply y axis by 3 to get a rough approximation of output. (For 12 months ending Dec 2024 average output was 82.5 BCF/d which is 30.2 TCF per year).
Gunga,
Don’t know if you saw my comment a few days back regarding my observation of the 4 well Indian Foot 102HC pad in Bradford county, PA from Expand Energy (current Chesapeake and Southwestern combined company).
In under 6 months online, these 4 wells have produced over 6 million barrels of oil in energy equivalence (~36 Bcf) with the most prodigious – Indian Foot 102HC – having output of almost 2 million Boe (10.6 Bcf).
Its first 2 months online, this monster flowed 77 Mcfd.
Simply staggering.
Taking a larger perspective, these better frac’d/drilled wells with longer laterals greatly expand future prospective lands vis a vis economic viability.
While Comstock is enlarging the Haynesville fairway, events like EOG’s 20 Trillion cubic foot Dorado play go virtually unnoticed.
Simply unfathomable amounts of natty out there.
Gungagalonga,
The US produces about 40 TCF per year of natural gas, so 20 TCF sounds like a lot, but it is 6 months supply. Also 700,000 acres also sounds like a lot, but if the well is 15k and spaced at 600 feet that is 204 acres per well, enough for 3400 wells if all of the acres can be utilized. Longer wells, say 20k would reduce the number of wells to 2566.
Note again the analysis is based on TRR not proven reserves.
Dennis,
While you are crunching numbers on potential future Haynesville wells, keep in mind that the Haynesville/Bossier has a couple of thousand feet thick of hydrocarbon bearing rock over much of the play.
The producing Cotton Valley overlies much of the H/B as well.
Dennis, thanks for the very detailed response at 8:40am, I am still reading it. It is very long and complex, I think that may be the gap here…. your analysis is based on very precise estimated and complicated values generated by generalized projected government numbers. Then you model them. Yes, say that three times fast, then laugh a bit.
I have almost no idea what your post was referencing above on reserves, it was very long and I’m having a glass of wine. I’m just telling you that those estimated reserve numbers and your projected 10 year peak supply for US gas production estimate is clashing with reality for what I see can be delivered based on real well data and mapping. The gov reserves numbers will be revised up over time as our tax dollars pay for crappy lag time data revisions.
I think over modeling the geologic unknown has limited use.
That’s just my opinion on this subject.
Coffeeguyzz,
USGS Mean TRR is about 253 TCF based in 2017 assessment for Haynesville/Bossier, cumulative production is about 42.5 TCF with about 4.3 TCF produced in most recent 12 months. If we assume 67% of TRR is economically recoverable that would be a URR of 169 TCF from Haynesville/Bossier play 50% of 169 is about 85 TCF. From 2017 to 2023 the Haynesville/Boss play increased output at an annual rate of about 45 BCF/year, if we assume this rate of increase occurs from 2025 to 2032 then cumulative output reaches 50% of URR in 2032 with output at 22 BCF/d.
Gungagalonga,
Perhaps the people who invest in LNG have the same attitude. Note that the TRR estimates for the North Dakota Bakken tight oil have been pretty stable since 2013 and the same methodology has been used by the USGS for shale gas and tight oil (both are what is termed “continuous resources” in USGS jargon.
USGS Shale gas mean TRR estimate is about 2300 TCF, economically recoverable resources will be about 67% of TRR = 2300*0.67=1540 TCF for shale gas URR. Assume peak occurs at 50% of URR=770 TCF cumulative output. As of Jan 2025 US shale gas cumualtive output is about 320 TCF. I assume future shale gas output increases at the average rate seen from 2017 to 2022 (about a 2 TCF annual increase in average annual output) over the 2025 to 2028 period. Cumulative output reaches 765 TCF in early 2037 and shale gas output has increased to 102.5 BCF/d at the plateau from 2029 to 2043 (from the earlier peak in 2023 of 84 BCF/d). It is assumed that no further LNG facilities ae approved after 2025Q1, probably a bad assumption given current administration.
slight error in finding future proposed LNG export facilities, earlier scenario assumed too low an export capacity with current approvals, revised scenario below with 4 BCF/d higher peak than earlier scenario.
Gungagalonga,
The important metric is how much the company makes on all of its wells, rather than cherry picking a few high impact wells. Comstock lost money in 2024, so on average they did not do well with the low natural gas prices. Click on chart for larger view, they lost 69 million in 2024.
If you are an importing nation who can you trust to uphold a long term contract on LNG supplies?
Of the top 6 exporters of LNG including Russia, US, Qatar,Malaysia, Algeria,
I would trust only one source named Australia.
I wouldn’t trust the motives or conduct of any of the others.
But that is my cultural/historical bias.
And I would not trust international maritime trade for something so critical, and explosive.
Are pipelines (Nord Stream for example) any more reliable?
It used to be.
An alternative natural gas scenario for US using marketed natural gas and Potential Gas Committee TRR estimate times 0.67 to account for likely economic barriers. URR is 3700 TCF (67% of PGC TRR estimate of 5532 TCF). Peak in 2030 at about 44 TCF. US annual production in most recent 12 months for marketed natural gas was 41.5 TCF. I assume a 10 year plateau at the peak level from 2026 to 2035, reaching Cumulative output of 1864 TCF (50.3%) at the end of 2030 at roughly the middle of the plateau.
Hickory: “And I would not trust international maritime trade for something so critical, and explosive.
Are pipelines (Nord Stream for example) any more reliable?”
Perhaps the most naive thing I’ve ever read. Did you miss the part about the Nord Stream pipeline explosion in September 2022?
Really, Russia is destroying communication and power cables lying on the bottom of the sea. The world is at war. What part don’t you understand ? The sarcasm. Can you spell Lusitania ?
“Those who cannot remember the past are condemned to repeat it,”
Gerry, you did not seem to have caught my drift…the explosion/sabotage was an exact example of my point.
You crack me up, Mr. Beach.
Are you trying to communicate with me? The REPLY button is on the bottom RIGHT hand side. Try to remember, like your political favor and mind set Dr. Mad. You disappoint me. I expected more from an educated man.
“First they came for the socialists, and I did not speak out. Then they came for the trade unionists, and I did not speak out—because I was not a trade unionist. Then they came for the Jews, and I did not speak out—because I was not a Jew. Then they came for me—and there was no one left to speak for me” is a quote by German pastor Martin Niemöller.
“Birds of a feather flock together”
HuntingtonBeach: “Are you trying to communicate with me?”
No, actually, I’m not. For one, I don’t think you have the basic understanding about geopolitics, oil and gas, and even alternative forms of energy to discuss much of anything with.
I was responding to Hickory, whom I respect as someone who has actually put in the hours to understand these things, and I was a little out of character (and place) in making a poorly thought out comment to his (now obviously sarcastic) note. Hickory and I are pretty obviously on different sides of the political divide but I do indeed respect him. You? Nah. Not much. Sorry, I’m not trying to be mean but you just haven’t impressed me that you know much of anything.
Frac Spread Analysis
The site below provides Frac Spread data. Unfortunately it is difficult to use. However with a bit of work and persistence data can be extracted. The only reason this is being mentioned is that while I think the results look fine, there could be some errors because many steps have to be taken to make the file workable and errors are possible. Nevertheless the results seem reasonable.
The attached table shows the distribution of Frac spreads vs the three Big States for the week ending January 31. The largest number of frac spreads are in Eddy and Lea counties. In Texas, the greatest number are in Martin, Reeves, Loving and Reagan. Surprising is Midland with 3 and this may reflect the dropping rig count there.
https://fracfocus.org/data-download
Ovi,
Great stuff, thanks. Maybe repost in new thread so people don’t miss this?
New posts are up
https://peakoilbarrel.com/opec-update-february-2025/
and
https://peakoilbarrel.com/open-thread-non-petroleum-february-26-2025/