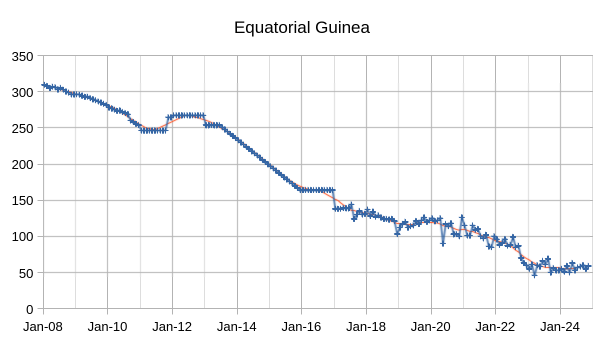
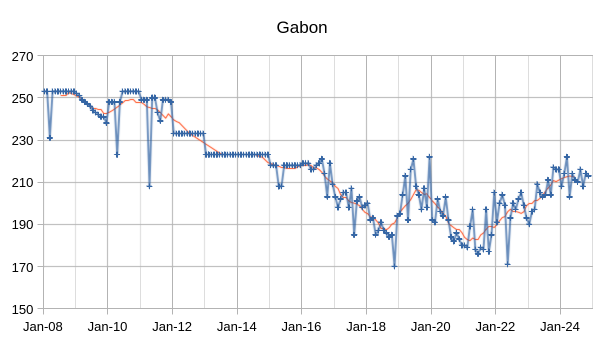
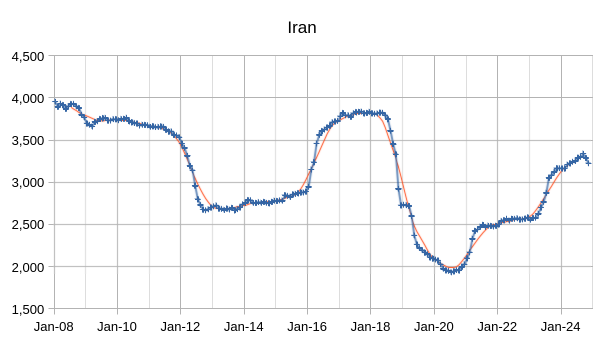
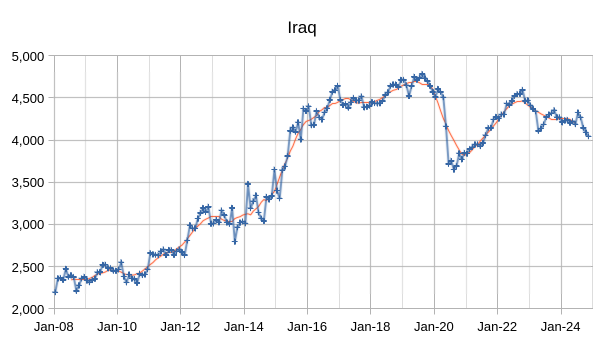
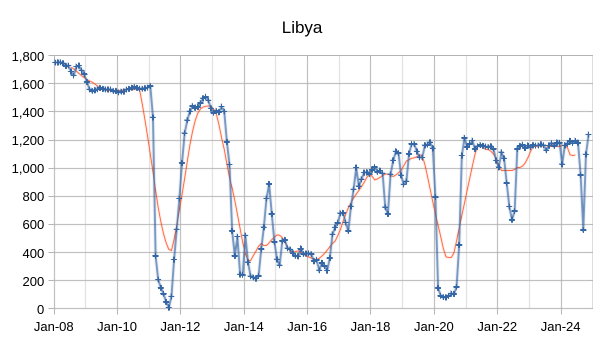
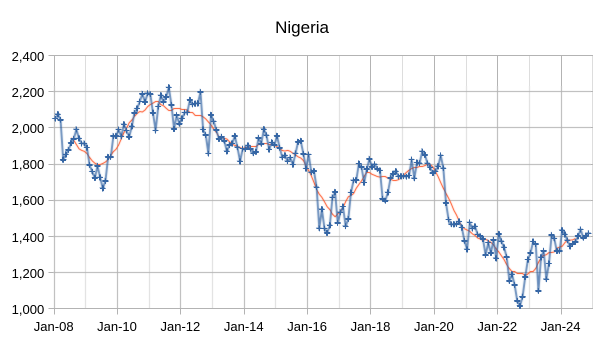
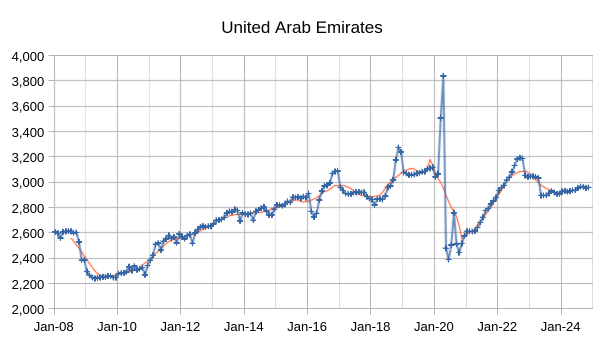
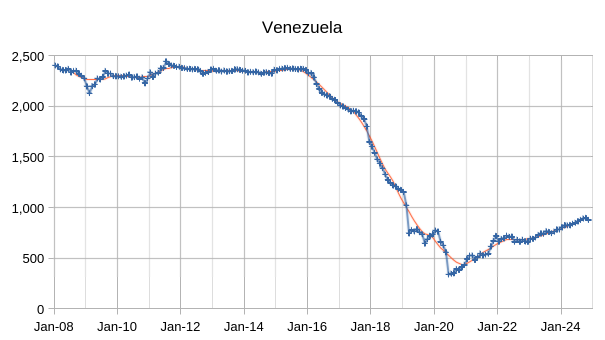
The OPEC Monthly Oil Market Report (MOMR) for December 2024 was published recently. The last month reported in most of the OPEC charts that follow is November 2024 and output reported for OPEC nations is crude oil output in thousands of barrels per day (kb/d). In the OPEC charts below the blue line with markers is monthly output and the thin red line is the centered twelve month average (CTMA) output.
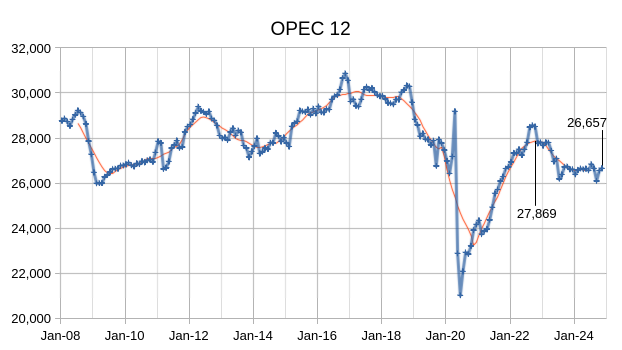
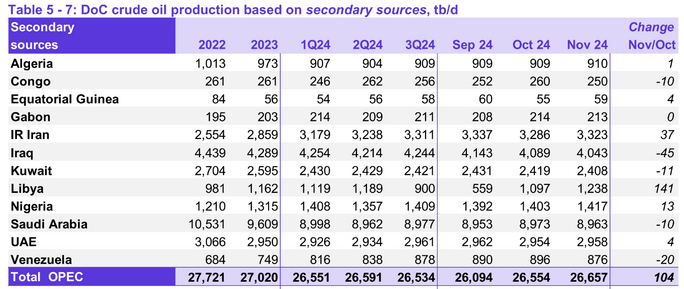
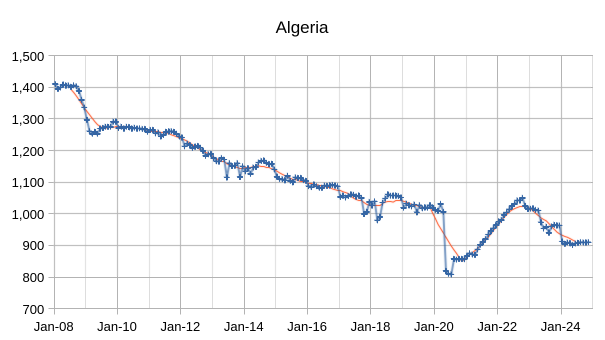
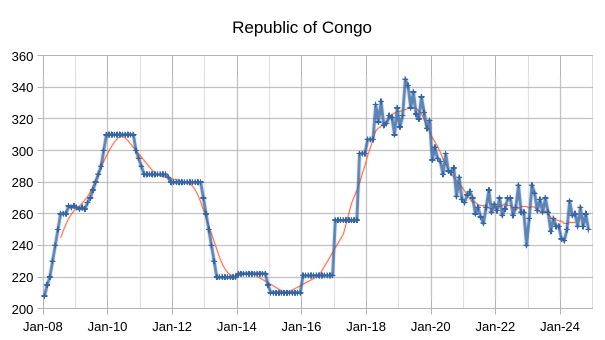
Output for October 2024 was revised higher by 19 kb/d and September 2024 output was revised higher by 25 kb/d compared to last month’s report. OPEC 12 output increased by 104 kb/d with most of the increase from Libya (141 kb/d.) Iran also increased by 37 kb/d while Iraq saw a decrease of 45 kb/d. Other OPEC members had small increases or decreases of 20 kb/d or less.
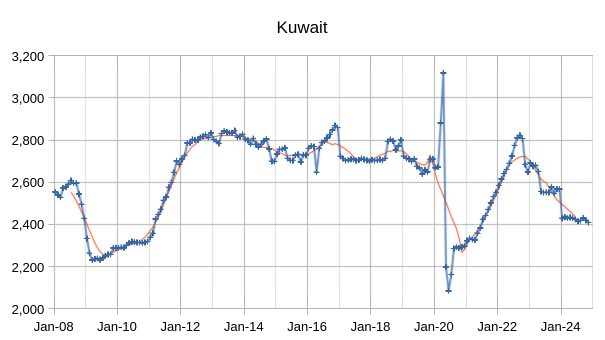
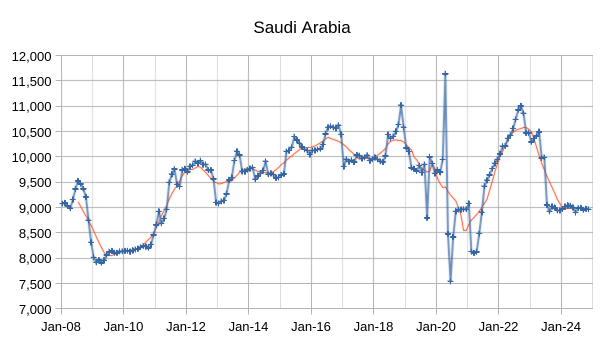
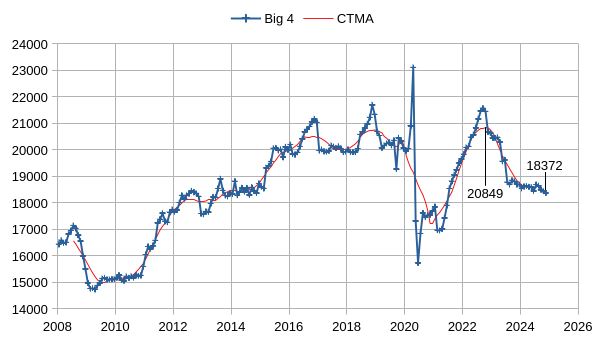
The chart above shows output from the Big 4 OPEC producers that are subject to output quotas (Saudi Arabia, UAE, Iraq, and Kuwait.) After the pandemic, Big 4 average output peaked in 2022 at a centered 12 month average (CTMA) of 20849 kb/d, crude output has been cut by 2477 kb/d relative to the 2022 CTMA peak to 18372 kb/d in November 2024. The Big 4 may have roughly 2477 kb/d of spare capacity when World demand calls for an increase in output.
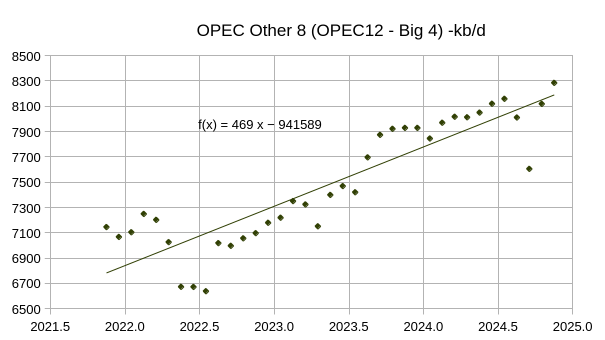
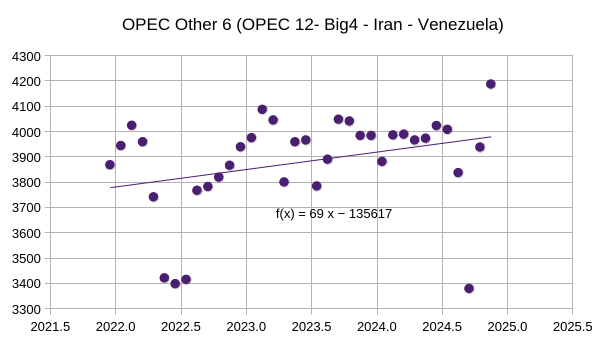
Most of the increase in the Other 8 OPEC nations (those OPEC 12 nations that are not part of the Big 4) came from Iran and Venezuela (about 400 of the 469 kb/d average annual increase), with the remaining 6 nations that were subject to quotas having relatively flat output over the 37 month period covered in the chart above (November 2021 to November 2024) . See chart below for OPEC Other 6 (OPEC 12 minus Big 4 minus Iran minus Venezuela) with an average annual increase of only 69 kb/d over past 3 years.
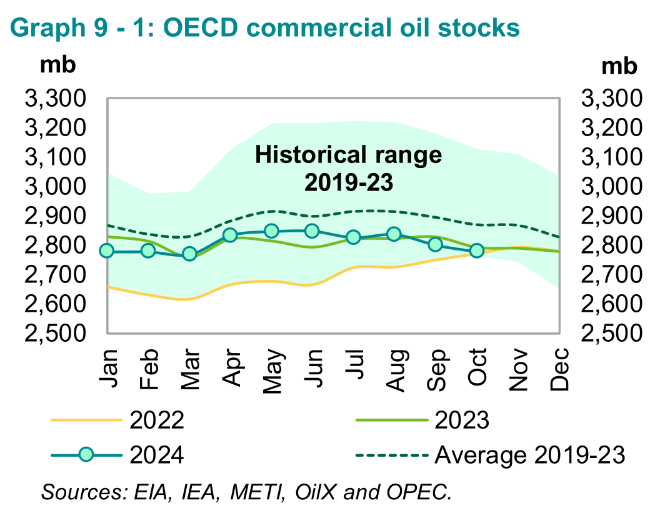
OECD Commercial petroleum stocks are near the bottom of the 5 year range from 2019 to 2023, so far the market seems to need less oil than earlier periods as oil prices remain relatively low.


OPEC has reduced its estimate for World liquids demand growth in 2024 by 200 kb/d compared to last month’s oil report, but the expected growth in 2025 is unchanged.
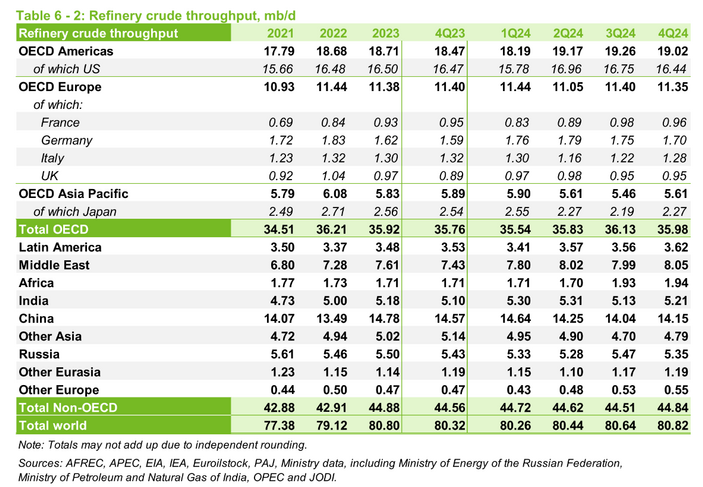
The chart above is included to show that demand for crude oil (input of crude to refineries constitutes most of crude oil demand) has actually decreased from 80.8 Mb/d in 2023 to 80.54 Mb/d in 2024, a decrease of 260 kb/d. So the petroleum liquids demand increase of 1600 kb/d in 2024, plus the 260 kb/d crude demand decrease would suggest NGL and other liquids demand increased by 1860 kb/d in 2024. Recent levels of output for non-crude liquids is around 25 Mb/d, so this would be a 7.4% increase in non-crude liquids demand, if both World liquids demand estimate and the refinery throughput estimates by OPEC are correct. I expect OPEC will eventually revise its demand estimate lower to match reality.

The tight oil estimate for 2023 was revised higher by 30 kb/d compared to last month’s report, the 2024 tight oil output estimate is unchanged so that growth is 30 kb/d lower than last month, tight oil growth in 2025 was also revised lower by 20 kb/d compared to last month.
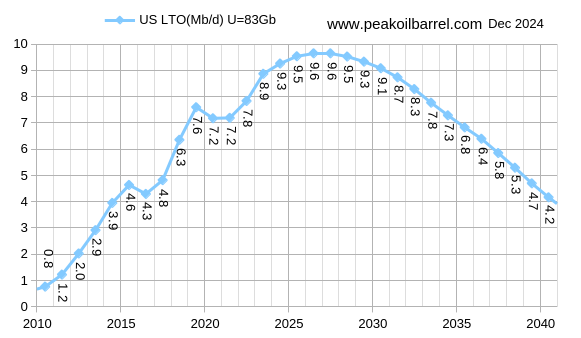
My best guess tight oil estimate for the US has been revised from what I reported last month, primarily due to new estimates for the Permian basin based on regional output data for the Permian based on Texas RRC data, New Mexico OCD data and EIA estimates for Texas and New Mexico, along with rig counts from Baker Hughes. The peak is 9644 kb/d in 2026 for this scenario compared to a 2024 peak at 8810 kb/d in the scenario presented last month.
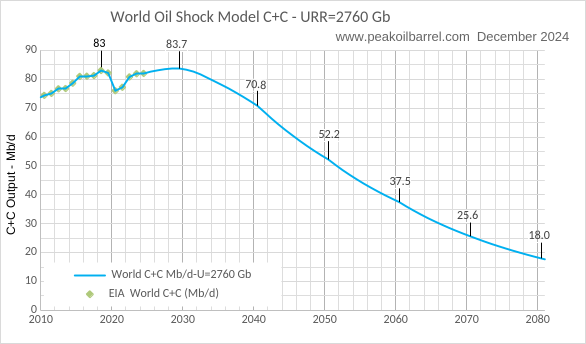
The World C+C estimate gets revised when using this updated tight oil scenario as in the chart above with a peak at 83.7 Mb/d in 2028 and a URR of 2760 Gb (2658 Gb produced by 2100). For those who understand that climate change may be an existential environmental crisis, the scenario above would be considered pessimistic. An optimist might believe there is less crude oil that will be extracted, but I believe that is wishful thinking. I hope I am wrong, but think I am not.
https://oilprice.com/Energy/Gas-Prices/Gas-Car-Ban-Hinges-on-Upcoming-EPA-and-Supreme-Court-Decisions.html
Click link for entire piece above, excerpt below:
The Biden administration is expected to permit the U.S. Environmental Protection Agency (EPA) to grant permission to 12 states, including California, this month to ban the sale of new gasoline-powered cars by 2035. If the move goes ahead, it would be one of the most ambitious U.S. climate policies to date, alongside the 2022 Inflation Reduction Act (IRA). However, President-elect Donald Trump could revoke this permission once he takes office, which falls in line with his plans to reduce the reach of the IRA and other climate policies.
…
On 13th December, the U.S. Supreme Court said it would consider whether business groups be permitted to challenge the EPA’s waiver programme for California. The groups, which include fuel producers and sellers, told the court that its intervention was required to prevent the Golden State from effectively setting national policy. “Without this court’s immediate review… California’s unlawful standards will continue to dictate the composition of the nation’s automobile market,” they stated in their petition seeking review. Decisions from both the Supreme Court and the Biden administration will determine the legality of the EPA waivers and will decide whether the gasoline car ban will go ahead in 12 states.
Novi labs has now taken down any free data access on their blog that used to be provided when Enno Peters was there. So we are now flying blind.
Oh oh, must have insulted the Novi Labs execs somehow.
Tangentially related note. This FT article claims that the Australia Bureau of Meteorology (BoM) stopped their El Nino forecast web page because it was essentially ineffective
https://www.ft.com/content/4c5da16b-e85e-4828-8f07-873c229aaa3c
Information is apparently dangerous. Ask the Italian seismologists who have gotten sued.
I doubt they care too much about POB. They’re not scared of it. You overdramatize the importance of peak oil commentary. Just like nobody in real oil and gas academics cares about the fringe, lower tier publications from the “shock model”. It’s not even on anyone’s radar.
The evolution of SP is more the natural progression of things, given that SP developed into a (part of) a real money making company with real money paying customers and real employees that they need to pay real salaries to so they can buy real roasts for real Xmas dinner that real wives and real kids eat. SP is not an ad hoc peak oil speculation analysis tool any more.
If you want access to the dashboards, I’m sure they will sell you a license. I don’t think they are scared of the blog posts you post from using it. It’s just you need to pay.
Get over yourself ANONYMOUS. I don’t really care how other people get by … not my problem.
Consider this: Trump took possession of classified documents after his tenure and wouldn’t release them. The criminal investigation was hampered by the fact that no one else without a Top Secret security clearance was allowed to even know what the secrets were. The public had no idea what was happening because even if a journalist had a security clearance they would not be allowed to report on it. So all legal actions were delayed and now enough time has passed that Trump has effectively skated.
“I’m sure they will sell you a license”
Subject to caveats such as that you can’t post it in a public forum. We’re not as gullible as you look ANONYMOUS.
Well go ask for a license and if they have those conditions, report back. But don’t just blame them for a restriction that you have no evidence for. That’s bizarre.
Not going to respond to the TDS. That’s not on topic to the Novi Labs data license. Just left field.
Nony,
They allowed limited access to data in the past, now they do not, just a fact. Enno Peters had told me he would always keep those posts accessible, he kept his word while still at Novi labs, now that he has left they decided to eliminate any access to old data. I was lucky that Enno made his data available. Future analysis of well profiles and tight oil output, by me will no longer be possible.
I expected that would be the case when Enno left Novilabs, but I didn’t think Novilabs would take down the data access to Enno’s old blog posts. Oh well.
I asked Enno about the use of data when he was independent at shaleprofile and there were not many restrictions on the use of the data at a blog except not posting access to the entire dataset.
Not sure of the rules at Novilabs.
Dennis,
I remember we got a good start via the North Dakota Department of Mineral Resources, which did a decent job of releasing the data for the Bakken shale formation. The Texas Railroad Commission not so much.
Want data on wind distribution? Easy.
Is the conspiracy theories really needed?
how much does access to the date you need cost?
Weekendpeak,
I haven’t checked, my guess id that it would be at least 500 per month, too rich for me. I already pay for the webhosting, not going to add to my costs.
Happy to chip in to defray your costs. You have my email so just ping me.
rgds
Thanks,
Let me see how expensive it is and maybe I will try to raise funds for it here, though people hate paying for stuff, thus my hesitation to ask.
We all benefit from it so it makes sense that those who can contribute do so.
rgds
Weekendpeak and others interested,
I got an initial quote from Novilabs of $10,000 per year for a solo license, but I am still trying to clarify what is being offered,
Dennis,
Thanks for the report much appreciated.
I wrote another program which creates peak oil scenarios based on an input of the max growth rate and max decline rate, which then spits out a random number between the given inputs for every year until oil production essentially hits < 1 billion barrels per year.
This is a scenario which max oil growth rate is 1.5% and max decline rate is -5%.
URR for such an input is usually ~2700Gb to 3200Gb +/- 10%.
I don't see such scenarios as realistic. Because for some reason I just don't see oil being produced past this century. So any logarithmic decline in oil production is unrealistic in my view. I think the way it begun is the way it will likely end abruptly. But bear in mind i am probably wrong.
Thanks Iron Mike,
Forecasts beyond 2050 are very likely to be wrong, on that we probably agree. In my mind it will be difficult to eliminate petrochemical demand for oil along with oil use for air and water transportation and shipping. I expect there will be some demand for these beyond 2100. My scenario presented above has about 2660 Gb of cumulative output up to 2100 and another 100 Gb after that (decline rate at around 3% per year on average from 2100 to 2300.)
““I told the European Union that they must make up their tremendous deficit with the United States by the large scale purchase of our oil and gas,” Trump posted on the social media platform Truth Social.
“Otherwise, it is TARIFFS all the way!!!”
Draw your own conclusions.
He posts this stuff in the middle of the night. I’m guessing during working hours Moscow time.
It’s worth remembering that the United States entered WWI and WWII to uphold free trade.
Also it’s worth remembering that the Cold War was a standoff with proxy wars between two blocks. Ultimately the smaller trading block went into (comparative) decline. Putin is aware of this which is why he sends his minions out to undermine free trade.
Huh. That’s quite a different history than the one I’m familiar with.
Perhaps/most likely fixing NS2 would solve many of Germanys problems, since Scholz is out it might not be impossible. To some peaples horror…
It looks like the new administration is determined to enable export as much oil and natural gas as possible, perhaps not aware that resource is finite in nature.
Anonymous….you don’t get a free pass on what you say based on time of day. No excuse for being mentally lazy, obtuse, rude, childish, or simply false.
Note also that when Trump says “deficit”, he means “trade surplus”. The only deficit here is American de-industrialization.
https://ec.europa.eu/eurostat/statistics-explained/index.php?title=USA-EU_-_international_trade_in_goods_statistics
I find more an more curios that the OPEC data appears faster and faster and US data appears slower and slower. Maybe it is just me!
The Depletion Paradox
The great drama of American shale production may now be nearing its final act. For years, we have anticipated that the relentless growth in shale output would crest by late 2024 or early 2025, catching many off-guard. In hindsight, even this expectation might have erred on the side of caution. Quietly and without much fanfare, both shale oil and shale gas appear to have passed their zenith several months ago. Recent data from the Energy Information Agency (EIA) reveal that shale crude oil production reached its high-water mark in November 2023, only to slide 2%— roughly 200,000 barrels per day—since then. Likewise, shale dry gas production peaked that same month and has since slipped by 1% or 1 billion cubic feet per day. The trajectory from here, according to our models, looks steeper still.
Frugal
I don’t think this statement is correct: “In hindsight, even this expectation might have erred on the side of caution. Quietly and without much fanfare, both shale oil and shale gas appear to have passed their zenith several months ago.”
Here is my assessment of the four major counties in the Permian based on actual production data for Texas and New Mexico along with a projection. See link to US September update.
– Lea county may have peaked in May 2024
– Eddy county production is still increasing
– Midland county peaked in July 2023
– Martin County may have also peaked in May 2024
We need another three or 4 months of production to see if the Permian is close to peaking. This prediction assumes the rig count stays at current levels or drops and that WTI stays in the $70/b to $75/b range.
https://peakoilbarrel.com/hurricane-drops-u-s-september-oil-production/
Either way, at least these four counties appear to be at or near peak. But do these four prolific counties represent the Permian as a whole?
One interesting concept from this article is that the higher the production, the more difficult it is to increase production and the more likely the probability that the production will drop. This is because the higher the production volume, the higher the decline volume.
Frugal
I have focused on the four largest oil producing counties Lea, Eddy, Martin and Midland because of an earlier G & R article that discussed the peaking of the Permian and because their output is close to 50% of the Permian.
When those four show a clear peak, the whole Permian will be close behind if not at the same time.
Ovi,
I agree the Gorozen analysis is a bit off on the timing. My expectation is a 2027 peak for tight oil in the US.
Chart below has my recent Permian Region estimate, based on RRC, OCD and EIA data.
Dennis
G & R make the following statement in an earlier publication: “Our models tell us the Permian will ultimately recover 34 bn barrels of oil, of which 14 bn or 41% have already been produced. At current production levels, the Permian will have produced half its recoverable reserves sometime in late 2024; at this point, it will most likely stop growing, just like the other two basins.”
How does your URR compare with the G & R 34 bn?
Ovi,
My estimate is about 50 Gb. USGS TRR is about 75 Gb. Note that in recent artilcles Gorozen suggest peak occurs for tight oil at cumulative output of around 30% of URR. Recent cumulative for Permian tight oil is about 13.8 Gb, of the 30% of URR at peak estimate is correct and peak is now this would imply a URR of 13.8/0.3 would be about 46 Gb for the URR. For my scenario peak occurs at about 20 Gb for cumulative URR which is about 40% of URR.
Hubber Peak Oil model for conventional oil is based on 50%.
Note the shale oil has much faster decline each well, although much higher IP in the beginning. This might also make the percentage of URR for peak oil change from Conventional to Shale?
Sheng wu,
G & R believe the nature of tight oil production results in a peak at cumulative production of about 30% of URR rather than the classic Hubbert Curve with peak at cumulative output of 50% of URR. My scenario for US tight oil has a peak of 9.7 Mb/d (in Jan 2027) at cumulative output of 38.4 Gb and URR of 82.7 Gb which is a cumulative output of 46.4% of URR.
In short, I disagree with the analysis of G & R, both analyses are likely to be wrong.
Novi posted a report about Bakken inventory depletion.
I asked a question below but nobody answered,
“anyone knows why few or just no laterals landing in the upper and lower Bakken shale?”
Sheng Wu: “Novi posted a report about Bakken inventory depletion.
I asked a question below but nobody answered,
“anyone knows why few or just no laterals landing in the upper and lower Bakken shale?”
Dense, low-permeability shale in upper and lower Bakken. Middle Bakken is interbedded with siltstone and has natural fractures. But maybe future target?
Sheng Wu:
Big picture: They tried it and learned quickly that the MB targeted wells did better than UB/LB targeted wells.
This makes sense if you think about the geology. The MB is actually a thin layer of a relatively conventional permeable reservoir, in between impermeable two shales, like juicy meat in between bones (that might have some nutritious marrow in them, but need to be cracked). In other words, the MB is NOT a “true shale”. It shares some characteristics with the thin layer Cedar Hills or Red River formation (a nearby conventional thin bed reservoir, more enabled by hz drilling than fracking). So…anyhow if you target the MB, you are targeting the sweet spot, not the tough spot.
The U/M/L layers are relatively thin, so MB wells, tend to get frack penetration into UB and LB shales, with some of the production coming from the top and bottom shale rocks. In contrast going into one of the shales and trying to produce from all three, just doesn’t work as well. And they are thin enough so it really doesn’t make sense to do separate layers or even to wine rack. (Too much competition…consider even the much deeper TF formations require wine racking.)
I agree with some of Nony arguments, i.e.
1.U/M/L layers are relatively thin, so the MB and TF wells might all stimulated the U/L Bakken with high TOC.
2. U/L are tougher, and since they are shale, need Oil based mud to drill, adding up the cost.
My question comes from these fact:
the MB HZ drilling frenzy actually started (1996) before Barnett shale success 1999~2002 with vertical and slick water and sand.
The MB fracing was based on gel and ceramic before switching to shale recipe of slick water and sand in 2014~2015.
The theory of “no drilling U/L high TOC layers” was also formed before the 2014-2015 frac recipe change, basically the TOC high shale will adsorb the oil and prevent them from being produced. Note the U/L layer actually has more oil when analyzed with the same heating method. Instead of “Meat sandwiched in 2 Bones” I would say “bum in sandwiched in 2 meats fat”
The Marcellus thin (10m or less) section of high TOC shale in WV/OH are the most prolific target for condensate and wet gas now, and almost zero in the upper Hamilton or lower carbonate .
The Rig Report for the Week Ending December 20
– US Hz oil rigs increased by 3 to 441. They are down 18 rigs from April 19 and are up 14 relative to their recent lowest count of 427 on July 24th. It appears that $70/b WTI is not an impediment to additional rigs and drilling.
– In New Mexico, Permian rigs were unchanged at 94 while the Texas Permian added 3 to 193.
– In New Mexico, Lea dropped 1 rig to 45 while Eddy added 1 to 49. It is remarkable how steady the rig count is in New Mexico. It has been steady at 93 ± 1 rig for the last 9 weeks. It is a testament to the quality of the land they have to drill. How much longer can it last?
– In Texas, Midland added 1 rig to 27 while Martin was unchanged at 27.
– Eagle Ford was unchanged at 39.
– NG Hz rigs dropped 1 to 85.
Frac Spread Report for the Week Ending December 20
The frac spread count decreased by 7 to 210. It is also down 42 from one year ago and down by 62 spreads since March 8.
The last time the frac spread count was close to 210 was April 30, 2021 when it was 212.
Uh-oh…
Not looking good for some EU countries, Germany in particular would probably need to think about their energy supply.
Here in northern Sweden we are happy to deliver electricity to the rest of Europe, at a slight, albeit sometimes hefty mark-up of course.
https://www.svk.se/om-kraftsystemet/kontrollrummet/
As regards “The Depletion Paradox” and the comments and graphs that follow:
Production of oil & gas also depends upon prices, not just geology. For most of this year, in the major U.S. shale basin, the wellhead price for NG was near zero. This was particularly painful as the hydrocarbon stream coming from shale oil wells had become nearly 50% NG, which would mean that to approximate previous production income the price of oil would need to be closer to $100 than $70. This NG glut had arisen from over-production of shale oil wells, which currently suffer a much higher gas cut than previous wells. Since the cure for over-production is low prices, we’ve seen these poor prices, well below inflation. As a consequence, 131 drilling rigs were dropped, which correlated to 90 fewer frac spreads working the major shale oil basins. Had it not been for a novel new gambit–the much-touted three mile laterals–production would have fallen much more than it has, but since these longer lateral wells decline faster, earlier, the nadir should hit about Q2, 2025.
The IEA has been predicting a global over-supply of oil for the entirety of 2025. If demand truly falls that much, the diminished production power of American shale won’t be felt, and the KSA will emit a sigh of relief that they can once again claim lost market share. On the other hand, if demand doesn’t fall much, or heaven forbid, even rises, we’re apt to see a price spike by the end of next summer.
With regards to Trump’s threats to the European Union, Bloomberg just reported that EU purchases of LNG from Russia were huge this year–despite all their talk about helping Ukraine and throttling Putin’s efforts of a takeover. It is also a reported fact that the EU trade deficit with the USA is about 125 billion dollars. We don’t actually have much to export to the EU except crops, oil and gas, and they don’t want the crops because they were grown from genetically modified seed, using God only knows what kinds of weird pesticides. You can’t blame them for not wanting to buy corn only to realize that it’s actually poison pumpkin, but our LNG is actually the real deal.
The upshot is that I think you’re right, Hickory. I believe Mr. Trump has in mind selling as much American oil and gas to the EU, the UK, and also to China and India as can be logically done. If NG assumes its rightful price point of $5, and oil were to jostle from $70 to $80, this pencils out. I wouldn’t be surprised to see him ramrod through a hydrocarbon export charge that goes toward reducing the price of gasoline at the pump–because that’s what he promised. It is certainly true that oil and gas are finite resources; however, the production of them has always been a commercial enterprise, at least in America, even during wartime. A new paradigm is almost certainly coming, and it’s going to be directed toward increasing production in favor of heftier exports.
Only then will we test Goehring and Rosencwajg’s hypothesis of peak production that was forecast by neural circuitry and machine learning. The use of coked petroleum proppants seems to add ~15% to yield. Bob Barda, the expert in refracs, says that one of every ten wells is a refrac candidate, and that it can add 10% to production in a field. My thesis: Raise the price of wellhead gas to $5 and oil to $80 and we will see a new peak. Whether that’s dangerous to the ultimate welfare of this country is a chapter yet to be written.
Gerry
To refrac those old wells and keep drilling new wells, will that require more rigs than the current 450? I am not clear on whether a refrac requires a rig or just more frac spreads or a different type of rig.
I am also looking for some clue that would indicate more refracs are happening.
Just a workover rig, and if a liner is used, the rig can be taken away as soon as the cement job is complete. In mentioning this concept, I did not intend that this is going to sweep the basins like wildfire; it’s not. Refrac jobs created a lot of excitement in the Bakken bc there were a few hundred early fractures in wells hurriedly drilled to hold leases by production, and many of those were single-stage frac jobs in an openhole wellbore–so the refracs created basically new wells. But this was then taken to the Eagle Ford, with such good results that when Devon bought Validus, they did so as much for the refracs as anything else.
I probably shouldn’t have mentioned this as a major contributor to the longevity of the basins, but indeed I think it might well be. It has barely been applied to the Permian, the big Kahuna. Right now there are basically two designs. One is the liner, which must be cemented in place to isolate the initial frac perforations, allowing for new fractures to be blasted in between. The other is the packer, which can be deployed merely by putting enough pressure down the wellbore lateral to expand the units from heel to toe (the toe is blocked off as well). Obviously, installing liners is riskier, because the casing string on almost all of the shale wells is 5-1/2” diameter, so not much room for cement. Because of simplicity and efficiency, the packers will probably win.
But even then you don’t really know until you risk the $4MM and test the well. I think that will change. If neural circuitry and machine learning can predict peaking of a field made up of tens of thousands of complex wells, surely it can take a bunch of variables (like initial reservoir pressure, EUR, decline curves, rock matrix, current downhole pressure) and come up with the most promising candidates. As I see it, the development of refrac as a new industry is going to come in very slowly. I think it will be niche. Much of its success (or failure) will likely depend on how much pressure is released when new rock matrix is perforated, as the success of a shale oil well is dependent in large measure on solution gas drive.
A massive amount of consolidation has occurred in all the basins. While Exxon and Chevron wouldn’t even consider shale at the inception of shale oil, they now control vast swaths. The only person in my opinion to listen to is Vicki Hollub, CEO of Occidental, who commented recently that the Permian will roll over during the next five years. The company is in debt and has lost a third of its market share. Still, no lesser investor than Warren Buffett just bought another large tranche. Occidental’s carbon capture and sequestration has not been a huge success, so you have to believe that Ms. Hollub has a trick up her sleeve and has mentioned it to her only benefactor.
To your last comment, I don’t think there will be much of a flurry of excitement when (if) refractures become more common–until it can be determined beforehand with AI, with predictable results. I hope this helps. I’m not a refrac expert, just a fan, and I own minerals in N. Dakota where this initially garnered unparalleled enthusiasm there for a while.
Thanks Gerry for sharing your knowledge.
Thanks for sharing Gerry.
https://oilprice.com/Energy/Crude-Oil/The-American-Shale-Patch-Is-All-About-Depletion-Now.amp.html
– uses same Goehring & Rozencwajg data, but adds a “tertiary (or enhanced) recovery” to the secondary gas injection stage, which is presumably a reference to the stage discussed above by Gerry. It says that
“The Wasson Field’s Denver Unit CO2 EOR project resulted in a nearly seven-fold increase in crude production after injecting CO2.”
But having thrown that out, it makes no definitive statement that it’s own headline claim is wrong.
Two questions for Dennis or Ovi: 1) what are the possible reasons why your forecasts differ from G&R? I don’t comprehend the G&R neural network, but whatever it is, it is telling them that returns are diminishing when analyzed on a per-foot-drilled basis. I know that Dennis’ oil shock model makes assumptions about the number of well completions going forward. What assumptions do you make about diminishing quality? 2) Where would one look to learn about shale well returns on a per-foot-drilled basis? I had a conversation with a Marcellus developer a month ago where he proudly related the ability to now drill 3-mile laterals. (Why one would drill and consume three miles of tier one Marcellus in this price environment baffles me.) But if in 2024 it requires a 3-mile lateral to harvest the same EUR as a 2-mile lateral drilled in 2018, that would be relevant information.
PAOil,
For Permian basin at 450 wells per month (average lateral length about 11,000 feet) I assume after December 2024 that average EUR decreases at about 2% per year. If the number of wells per month increases the drop in well quality is faster (more than 2% per year) and the opposite is true if the well completion rate decreases.
Unfortunately I no longer have access to well data that previously was published at the Novilab Blog so there will be no way to check if this is correct or see what is actually happening to average new well EUR over time.
Maybe I will see if this data is available at the local University library. Those who live in Texas might be able to get access to this data at U Texas, but that is a guess. For PAOil, if you live near Penn State or some other public University in PA they might have a subsciption to NoviLabs (or Enverus) at a University Library, perhaps look there.
I stay in touch with the PSU geoscientist who came up with the Marcellus estimate in 2007. I’ll ask what he has access to. Meantime, is there an “easy” button you can push to calculate the return per-foot-drilled now, compared to several years ago, to discern if the longer laterals are masking an EUR decrease of greater than 2%?
I recall the observations of David Hughes concerning the conventional gas treadmill from 1995 to 2005: the number of US conventional gas wells tripled over that 10 years, but gas production climbed only a bit by 2001 and then slipped dramatically. Similar story in Canada. That drilling treadmill is, of course, the same treadmill G&R are pointing to with US oil in the late ’70’s.
Said another way, the % of EUR decrease in the Permian may be a much more significant factor than the # of wells drilled.
PAOil,
The bottom line is that we do not know what the decrease will be for future new well EUR. From 2015 to 2022 the average drop in EUR per foot of lateral in the Permian dropped by about 2.9% per year, some of this decrease may have been due to increasing lateral length, I have assumed one third of the decrease was due to increasing lateral length and that if the 2022 lateral length is optimal and remains unchanged on average at about 11 thousand feet that EUR will decrease at about 2% per year. I don’t have data any longer so lots of guessing, the reality is that lateral length is probably increasing and EUR per well may be rising due to increased lateral length, of course we would have fewer potential wells possible as lateral length increases unless costs per foot decrease more than the decreasing EUR per foot of lateral. These are some of the reasons why I often suggest my scenarios are certain to be wrong.
PA Oil,
Here is some data for Permian Basin for EUR and lateral length and normalized EUR (per 10k feet).
Error in spreadsheet for table above, EUR/10k column is incorrect. Also EUR estimates have been updated see comment below.
A mistake in comment above where I said 450 wells per month and an assumed EUR decrease of 2% per year starting in Jan 2025, it should have been 480 wells per month. Also I have reexamined my well profiles and realize that from 2016 to 2020 the normalized EUR has decreased at an average annual rate of about 0.7% per year. So the assumption of a 2% per year decrease in EUR is probably too high.
Revised data below
Peter Mason:
You’re right, EOR is going to potentially be a big deal in improving recovery, possibly in the form of Supercritical CO2, which has been demonstrated to be a superior agent for increasing movement of hydrocarbons, and has also been shown to produce a superior fracking material. The bonus is that it would qualify for carbon credits, being sequestered in the wellbore and fracking excursions. There’s very little doubt that there will be a “Second Wave” of activity in the shale, probably refrac of certain wells, EOR in certain clusters, and carbon sequestration might well pay for it. If these basins have indeed peaked, it’s time to get creative.
I think of refracking as an arrow in the quiver, but not a game changer. In some cases, it may just make sense to drill a new well, versus recompleting. Also, in the Bakken, a lot of the reason for the lower parent child effect, or even “halo effect” of offset wells, is that the earlier wells in the basin were not adequately stimulated. So, in that case, just doing a child well is sort of a refrac for the nearby old wells. But does not extend to newer basins.
Refracs have been around for a while. And are an option. But not a game changer. Just one more tool to get a little bit out, at acceptable cost.
Maybe an analogy is 3 mile laterals. They are not some Nazi rocket or jet plane invention. But they do have the potential (by lowering costs) to make some fringe (far from the sweet spot) acreage economic. And thus to increase total realized economic production.
Granted, there can be some overselling of the magic 3 milers in investor decks. But they do have tangible value. Don’t believe peak oilers who say they are a zero sum game. They enable some tier x to move to tier x minus one.
———–
Note that continued evolution of technology is on reason why I don’t trust the negative DC URRs (essentially shaded down USGS TRRs) or the even more negative Laherre or GR URRs. There’s a pretty long pattern of USGS needing to revise TRR up, even well into the period when shale was news. Also, there are implicit economic assumptions within the USGS method (e.g. spacing density), even though it is nominally not considering price.
In general, I think USGS has always been a lagging/conservative indicator (to include their record in conventional plays). I think you do better off shading up, versus down. And YES, despite the argument that USGS includes some non-economic resource.
And yes, despite them revising things up in shale and standing pat (in some shale plays, like the Bakken recently). Just way too much experience with them having to revise up. And they don’t have a second “stand pat” prediction in the Permian yet. And that play has a lot of layers and geologic complexity, not even clear if they have looked at all the relevant strata yet.
Note that technology development does not have to be step change. It can be gradual (like just crews getting better trained at how to keep the hz bore in target). And it may not be on something that you think of as producing more oil (e.g. diverters). It can be purely in the manufacturing mode of learning to do things cheaper. Because if the costs improve, more rock becomes economically feasible.
Nony,
There was little change in the USGS estimate for the Bakken from 2013 to 2021, roughly a 6% increase in mean TRR from 11.2 Gb in 2013 to about 11.9 Gb in 2021. About 5.54 Gb of tight oil have been produced from the Williston basin through November 2024, so if all of the mean TRR estimate from the USGS 2021 estimate can be recovered profitably (doubtful in my view) we would be at cumulative production of 46.6% of the 11.9 Gb URR for Williston Basin. For the Williston Basin peak output occurred at cumulative output of 3.47 Gb which is about 30% of the mean TRR estimate, this might be the basis for the G & R 30% of URR cumulative estimate.
My guess for the Bakken/Three Forks is about a 9 Gb URR so I have cumulative output at peak at roughly 38% of URR. Also the 9 Gb URR is about 75.6% of USGS mean TRR estimate for Williston Basin (aka Bakken/Three Forks).
The USGS methodology evolved over time for continuous resources, but between 2013 and 2021 for the Bakken there was little change in the mean TRR estimate. All of the Permian Basin estimates (Midland Wolfcamp in 2016, Spraberry in 2017 and Delaware Basin in 2018 were done between 2013 and 2021 so it seems doubtful that there will be a significant revision upward. Generally we would expect with greater knowledge and technology advancements that revisions would tend to be higher rather than lower.
What recovery factor are you using?
Jacob,
Not using a recovery factor and I do not know the OOIP estimates. The average Permian well EUR in 2022 was roughly 432 Gb and I assume it is unchanged in 2023 and 2024 (I don’t have data from those years so it is a guess). The EUR of 2022 wells is similar to 2020 wells and in 2021 the EUR was slightly higher than in 2020. I also assume lateral length remains at the average 2022 level after 2022. In addition I assume average new well EUR starts to decrease at about 2% per year after 2024 when 480 new wells per month are completed, as completion rate falls the rate of decrease in new well EUR also falls. For Permian scenario with URR=61 Gb, this is what the average EUR for new wells looks like over time.
Does anybody know the EUR figure is calculated?
Jacob,
Your question is a bit unclear, but for the URR it is the area under the curve essentially output per unit time times time. For example lets say output was 1, 2, 3, …, 8, 9, 10, 9,8, …, 3, 2,1 and each of the previous was average output per year in Gb/year for one year, URR would be the sum or 100 Gb.
USGS often too optimistic about oil and too pessimistic about gas
Always the case too pessimistic about NG. It’s like a line of dominoes where you knock one down and a new one pops up next door — IOW no good way to extrapolate a decline progression over a large area.
Crude oil on the other hand has longer lasting depletion profiles to calibrate against.
An optimistic and probably unrealistic Permian scenario with URR=61 Gb, peak in 2028 at 6263 kb/d at cumulative output of 23 Gb which is 37.4% of URR, the URR is about 81% of the USGS mean TRR estimate (75 Gb).
“Where, in short, are the flying cars? Where are the force fields, tractor beams, teleportation pods, antigravity sleds, tricorders, immortality drugs, colonies on Mars, and all the other technological wonders any child growing up in the mid-to-late twentieth century assumed would exist by now? Even those inventions that seemed ready to emerge—like cloning or cryogenics—ended up betraying their lofty promises. What happened to them?”
Hightrekker,
Much of science fiction is set in the far future, say the year 2400 CE and beyond, or in a Galaxy far far away.
HIGHTREKKER —
Most of those are physically unrealistic or bad ideas. For example, it’s never made clear what happens to the air, dust etc in the place the object is teleported to, or what happens when you get teleported into a brick wall. As for flying cars, they’re the worst idea ever.
Meanwhile a lot of things science fiction writers couldn’t even imagine are already there. Consider the Babblefish in the Hitchhiker’s Guide to the Galaxy (1979). It was a joke idea about a fish you put in your ear to understand a foreign language. Nobody thought it would be reality in the near future. But real-time translation earbuds are now available from online retailers.
I recently reread one of my personal sci-fi favorites, Rendezvous with Rama, by Arthur C. Clarke, usually considered one of the more prescient sci-fi writers. I was amazed to notice how his 22nd century astronauts were lacking basic tech.
Buckminster Fuller coined the term ephemeralization before WWII. He predicted that technical advances would get more and more immaterial with passing time. Your list is mostly about moving faster or picking up heavier things etc. It’s a straight line projection of the trends of the 19th and early 20th century. But that is not where tech is going.
Henry Ford said if he had asked customers what they wanted they would have said faster horses. The same applies to flying cars. A lot of the doomsterism around here is based on the assumption that our already insanely inefficient society can only get better by becoming even less efficient or that economic growth has to mean more stuff. The opposite is true.
I had thought the November 2018 peak was 84,592?
Survivalist,
The 12 month average peak is around 82900 kb/d, which is the number I pay attention to rather than individual monthly peak output. EIA STEO has this being surpassed in 2025, my expectation is that the 2018 12 month peak will be surpassed in 2026 with a final peak in 2028. Cumulative World C plus C output will be about 1650 Gb at the end of 2028 for my best guess scenario, if we assume URR is 2 times cumulative output at the peak this implies World C plus C URR of 3300 Gb, most assumptions about the future will be wrong, it is possible that demand for C plus C will never rise above the 2018 output level in the future and the peak is 6 years in the past and URR will be about 2720 Gb (cumulative output at the end of 2018 was about 1360 Gb). This does give us a plausible range of 2700 to 3300 Gb for World C plus C URR, much depends on future demand for oil.
Survivalist,
Interestingly this matches pretty well with an analysis done by Iron Mike that extends to 2200, though he thinks oil output may be close to zero after 2100 so his best guess scenario is lower (I think a mean of around 2550 Gb or so) when using the assumption of close to zero oil output after 2100. Note that my scenarios, which extend to 2300, typically have about 100 Gb of oil output from 2100 to 2300 (about 3.6% of total URR for a best guess scenario of 2760 Gb). My expectation is that future demand for oil will be limited and will push URR toward lower end of my plausible range.
Cheers Dennis. Thanks for the details. Merry Christmas.
Survivalist,
Thanks, hope you enjoyed your holiday and Happy New Year.
Hi dennis I have a question. How exactly did you calculate net exports from opec data? The imports are usually larger then exports so the numbers are usually negative. I suspect it’s due to some sort of measurement error. Are you applying some sort of correction?
Jacob.
I mostly did the net exports calculations based on EIA data rather than OPEC data, I tried to use OPEC data for countries that are net exporters, but the data set is incomplete. The net export data for EIA has a much longer list of nations, only net exporters are included, but the list changes year to year, I usually use 2005 or 2006 to determine who is a net exporter.
Then how did you produce numbers past 2019?
Jacob,
I don’t remember, perhaps using OPEC data as bad as it is, one could take the net exports of those nations which OPEC has data on from the top 30 net exporters (as of 2005 or 2006) for years after 2019, perhaps I did that, there is no right answer.
God that’s really unfortunate! Do you think there’s anyway to jog you’re memory
Upcoming Treasury Secretary Bessant’s 3-3-3 plan
A while back, upcoming Trump nominee Treasury Secretary Bessant announced has 3-3-3 plan. The plan aims to increase oil output by 3 million barrels, achieve 3% GDP growth, and reduce the budget deficit by 3%.
Much of the press reporting subsequent to that announcement reported his oil production plan as increasing oil production by 3 Mb/d. I pointed out this mis-reading of his oil production target in a commentary but could not find his original statement. This morning I happened to find this article and it is reporting the same production target I had originally seen, 3 million barrels or 82.2 kb/d. I am assuming that his 3 M barrels are per year as opposed to 3 M barrels over his term.
Essentially Bessant’s target is to increase production by 82.2 kb/d.
The reason I raise this misinterpretation is because his target is consistent with the STEO’s estimate in that he is expecting little growth in US production for 2025. Maybe he knows much more about US future production capabilities than his Boss.
“Risks of oil overproduction are expected to dominate headlines in 2025, driven by Trump’s “Drill Baby Drill” agenda and Treasury Secretary Bessant’s 3-3-3 plan. The plan aims to increase oil output by 3 million barrels, achieve 3% GDP growth, and reduce the budget deficit by 3%. This oversupply strategy challenges OPEC countries, which had planned to unwind voluntary supply cuts initiated in 2022. To stabilize the market, OPEC extended these cuts through April 2025, though persistent downward revisions in demand forecasts—compounded by China’s economic contraction—highlight ongoing challenges.”
Seasons Greeting to all.
https://www.cityindex.com/en-uk/news-and-analysis/2025-crude-oil-fundamental-preview/
Ovi,
See
https://www.foxbusiness.com/politics/treasury-secretary-nominee-scott-bessents-3-3-3-plan-what-know
Excerpt:
Three million more oil barrels equivalent a day from U.S. energy production. That would be my 3-3-3. That would substantially decrease the oil price, which – that’s one of the No. 1 drivers of inflation expectations,” he said. “And then, back to the Fed, they could go into a proper easing cycle.
Note this is 3 million barrels of oil equivalent energy production and would include both oil and natural gas (converted to boe) and perhaps also includes NGL output.
Trump wants oil at or below $50 WTI.
Will see if he can achieve it.
SS
I wonder if the CEO’s of XOM, CVX, and a few others let him know that $60 WTI is a non-starter for US drillers.
Dennis
The equivalent boes is not my issue. The issue is 3 million barrels vs 3 million barrels per day. Are they quoting him correctly?
Hopefully this gets sorted out once the GOP takes over.
Ovi,
Have you seen it quoted as 3 million barrels per year? I have only seen 3 Mb/d, and this might be over a 4 year term, just as many of the other goals are over Trump’s term in office, So that would be 750 kboe/d per year on average for combined crude plus condensate, NGL, and natural gas (converted to barrels of oil equivalent at 6000 cubic feet of natural gas being one barrel of oil equivalent). That is my take, but have not researched his comments in detail, never heard of the guy before he was nominated to Treasury Secretary.
Dennis
The original article I saw was just 3 million barrels. Later that day as journalists were reporting his 3 3 3 plan, it became 3 Mb/d. Unfortunately I could not recover the initial report.
Ovi,
Also note that this 3-3-3 plan may not be what Trump adopts as his policy, the Treasury Secretary does not control energy policy and is one of many voices in an administration.
From 2017 to 2019 US C plus C and natural gas output grew at about 3 Mboe/d and that could be the basis of the 3 Mboe/d estimate. Note that Bessant is a hedge fund manager and may not know much about energy. It is obvious to me that the rate of growth for 2017 to 2019 in the US is not very likely in the future, but many in the US are convinced of the Saudi America myth.
Note that from Jan 2021 to Dec 2023, US oil and natural gas output grew at an annual rate of 1.64 Mboe/d. The December 2024 STEO forecast from Jan 2024 to December 2025 for US oil and natural gas output annual growth is about 0.4 Mboe/d.
The longer term rate of annual growth from Jan 2010 to December 2019 (linear OLS) for US oil and natural gas output is about 1.25 Mboe/d. Going forward I expect the rate of growth will be under 1 Mboe/d up to 2028, after that it will be substantially smaller and likely decreasing.
Upcoming Treasury Secretary Bessant’s-
“That would substantially decrease the oil price, which – that’s one of the No. 1 drivers of inflation expectations,”
I think that is false analysis in the current scenario in the US.
The oil prices in the past 2 years have been stable at around $80 , and nat gas very inexpensive.
These prices have not been factors in the inflation of the last couple years.
Trade wars and tariffs are inflationary, no matter who starts them and for whatever reason- Retaliation
“China’s Export Ban Sends Antimony Prices Soaring 40% in One Day
…”In principle, the export of gallium, germanium, antimony, and superhard materials to the United States shall not be permitted,” Chinese Commerce Ministry said.”
42% of Russell 2000 (small cap) stocks have negative earnings
14% of Russell Midcap stocks have negative earnings
6% of S&P 500 have negative earnings
Bigger is better?
New posts are up
https://peakoilbarrel.com/short-term-energy-outlook-december-2024/
and
https://peakoilbarrel.com/open-thread-non-petroleum-december-27-2024/
Ovi
I believe Trump is looking for an addl 3 million per day. While 3 million additional per year might a more realistic goal, he has very high expectations, and a huge group of followers who seem to believe he can do no wrong. I wonder how this will be resolved.
My own guess is lots of smoke and mirrors. Mix in a lot of blame ffor “them”, and treasure for “us”.