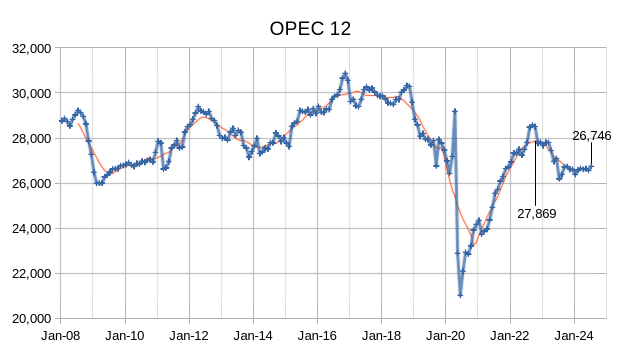
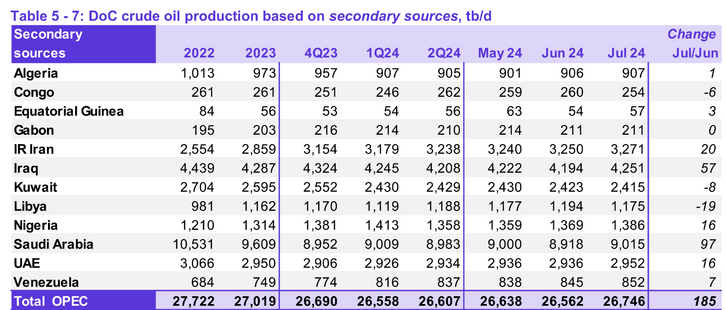
The OPEC Monthly Oil Market Report (MOMR) for August 2024 was published recently. The last month reported in most of the OPEC charts that follow is July 2024 and output reported for OPEC nations is crude oil output in thousands of barrels per day (kb/d). In the OPEC charts below the blue line with markers is monthly output and the thin red line is the centered twelve month average (CTMA) output.
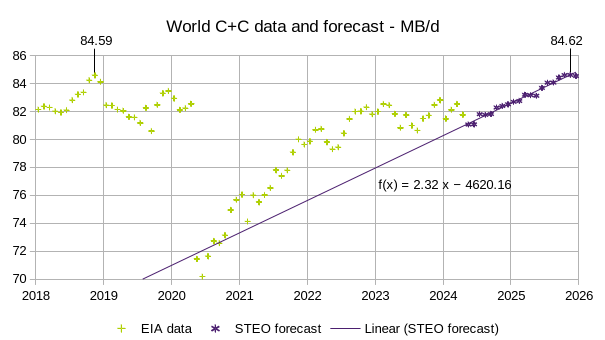
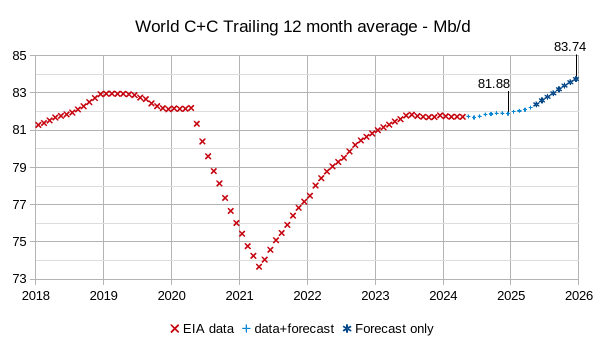
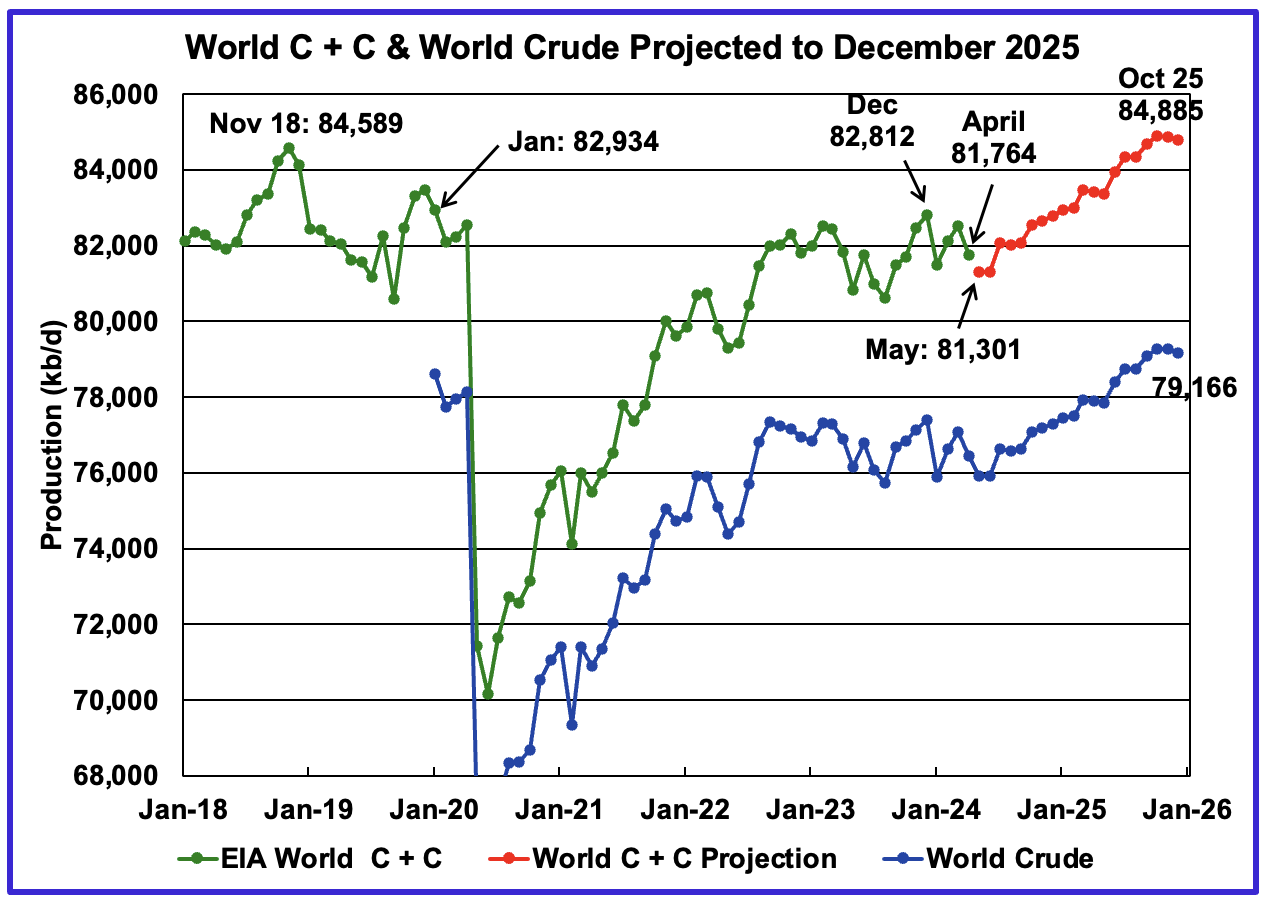
The EIA STEO was published recently, the estimate below is based on data from that report and statistics from the EIA International Energy Statistics. The EIA expects the 2018 peak for annual average World C+C output will be surpassed in 2025. The monthly peak in November 2018 is also expected to be surpassed in November 2025.
The focus of this post is an overview of World oil production along with a more detailed review of the top 11 Non-OPEC oil producing countries. OPEC production is covered in a separate post.
Below are a number of Crude plus Condensate (C + C) production charts, usually shortened to “oil”, for oil producing countries. The charts are created from data provided by the EIA’s International Energy Statistics and are updated to April 2024. This is the latest and most detailed/complete World Oil production information available. Information from other sources such as OPEC, the STEO and country specific sites such as Brazil, Norway and China is used to provide a short term outlook.
World oil production decreased by 765 kb/d in April to 81,764 kb/d, green graph. The largest decreases came from Brazil 162 kb/d and Russia 130 kb/d. May’s World oil production is projected to drop by 461 kb/d to 81,301 kb/d largely due to a drop in Non-OPEC production.