EIA Non-OPEC Oil Production Updated to July 2019

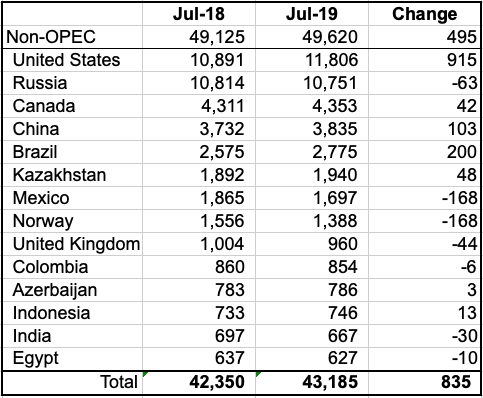
Below are a number of Non-OPEC charts created from data provided by the EIA’s International Energy Statistics.

The charts and table below are primarily for the world’s largest Non-OPEC producers and are updated to July 2019, except for the U.S., which is updated to August 2019. The first set of charts is for Non-OPEC countries with production over 500 kb/d and the last few provide a world overview.

Under some charts are added country comments from the IEA since I have updated data from them up to September 2019. While the IEA production numbers reflect “all liquids”, their July to September increments provide an indication of how the trend in the EIA charts will change by September.
Read More

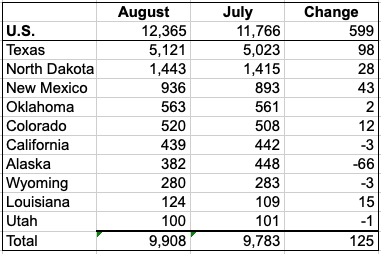
USA Oil Production by State Updated to August 2019

All data for this post is from the EIA’s Petroleum Supply Monthly

The charts below are primarily for the largest US oil producing states (>100 kb/d) and are updated to August 2019.  If you are interested in additional states, let it be known.

Ron has asked if I would take over the monthly posts for USA oil production.  I have tentatively agreed to do that.  Let us all thank Ron for his work at tracking US production and for his insights.  Ron will continue to monitor what’s happening with US production and provide his comments. He is not going away.

This is my first post on US production by state. If you spot any errors, please let me know and I will try to fix them.

Read More