Comments not related to oil or natural gas in this thread please.
Month: August 2017
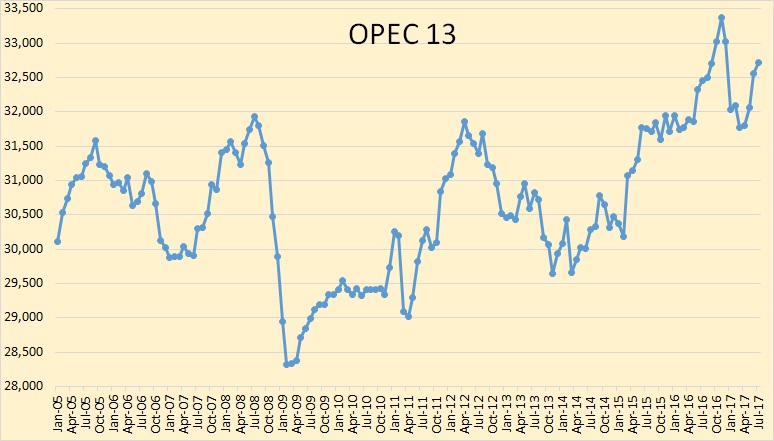
OPEC July Production Data
All data below is based on the latest OPEC Monthly Oil Market Report.
All data is through July 2017 and is in thousand barrels per day.

The above chart does not include the 14th member of OPEC that was just added, Equatorial Guinea. I do not have historical data for Equatorial Guinea so I may not add them at all. It doesn’t really matter since they are only a very minor producer. Also they are in steep decline, dropping at about 10% per year.
The huge June OPEC production increased was due to a revision, explained below.
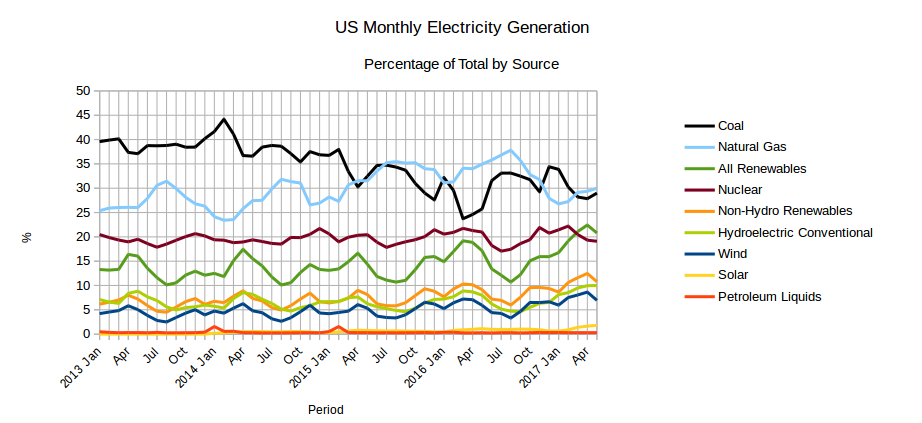
EIA’s Electric Power Monthly – July Edition with data for May
Guest Post by Islandboy
Non-Petroleum comments in this thread please.


The EIA released the latest edition of their Electric Power Monthly on July 25th, with data for May 2017. The April data was revised and re-released after the last report was prepared so some figures from this report may not be consistent with those from the previous report. Read More
US Gulf of Mexico, May Production
Guest Post by George Kaplan
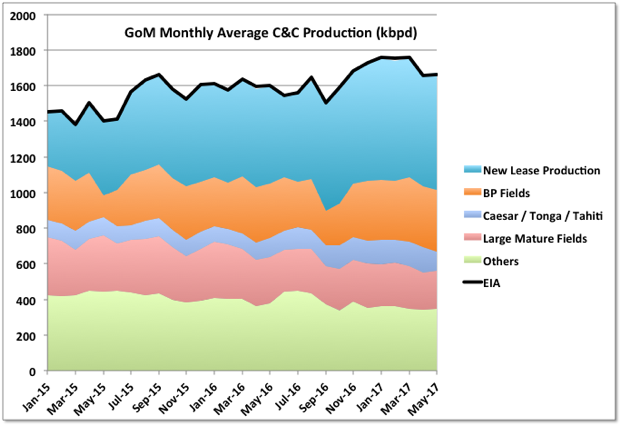
GoM Production
Production for May by BOEM was 1673 kbpd and by EIA 1661, compared with 1661 and 1658 kbpd, respectively in April.
March looks like the peak, at least near term, for the basin, especially with Hurricane Cindy impacting the coming June figures.

Open Thread- Non-Petroleum, August 2, 2017
Comments not related to oil and natural gas in this thread please.