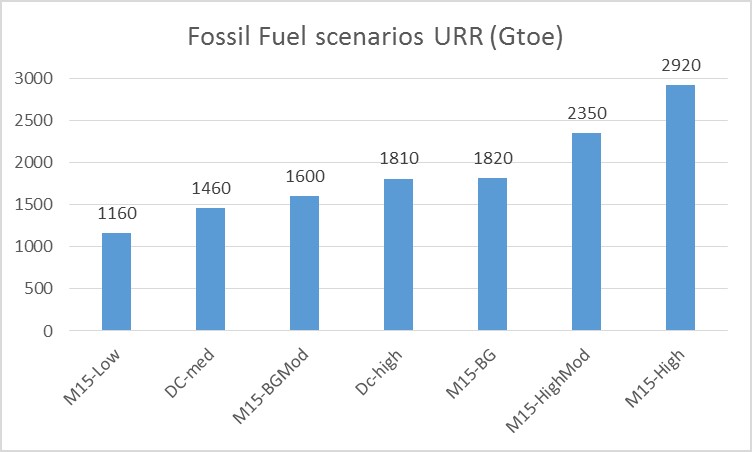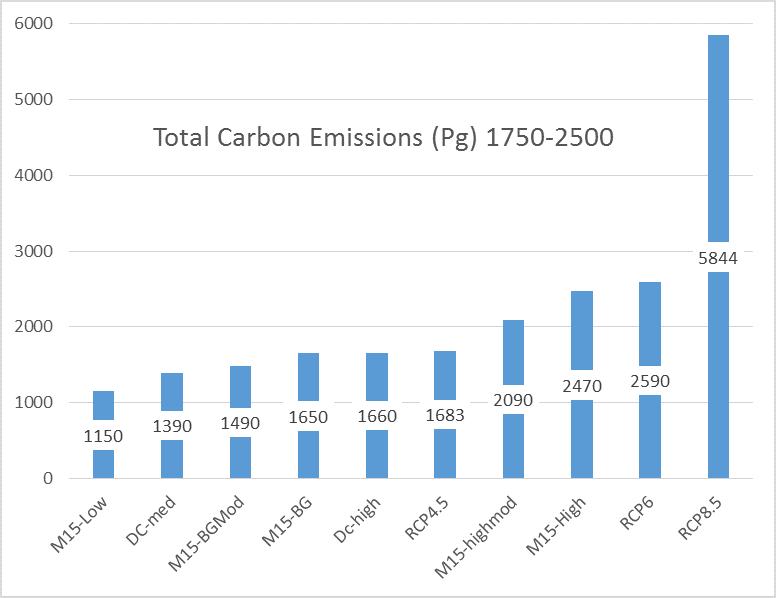
An interesting paper was published by S.H. Mohr, J. Wang , G. Ellem , J. Ward , and D. Giurco in Feb 2015 entitled, Projection of world fossil fuels by country. It updates Steve Mohr’s earlier work in 2010 and can be found at the link below.

An interesting paper was published by S.H. Mohr, J. Wang , G. Ellem , J. Ward , and D. Giurco in Feb 2015 entitled, Projection of world fossil fuels by country. It updates Steve Mohr’s earlier work in 2010 and can be found at the link below.
Comments not related to oil, natural gas, or coal should be to this post.
Thanks.
Edited 11/24/16 11:36 AM EST

Based on the recent work by Steve Mohr et al published in 2015, I have updated my estimate of potential future fossil fuel resouces. Read More
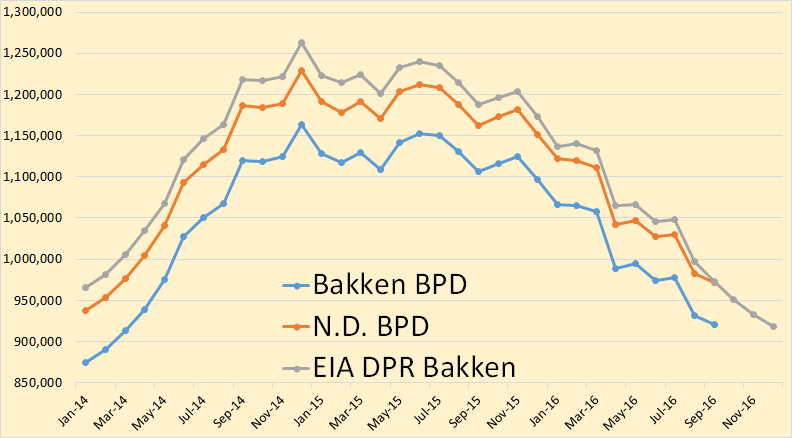
Bakken oil production was down 10,119 barrels per day in September and all North Dakota production was down 10,353 bpd in September.

Bakken production continues to decline though I expect it to level off soon.
The era of the mighty U.S. major oil industry is coming to an end as the country’s largest petroleum company is in big trouble. While ExxonMobil has been the most profitable U.S. oil company in the past, it suffered its worst year on record.
For example, just four years ago, ExxonMobil enjoyed a $45 billion net income profit in 2012. Now compare that to a total $5 billion net income gain for the first three-quarters of 2016. If Exxon continues to report disappointing results for the remainder of the year, its net income will have declined a stunning 85% since 2012.
Actually, the situation at Exxon is much worse if we dig a little deeper.
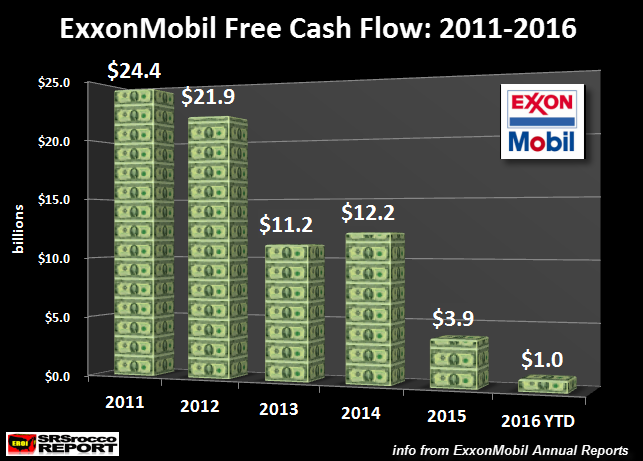
To understand the real profitability of a company we have to look at its cash flow, or what is known as free cash flow. Free cash flow is calculated by deducting capital expenditures (CAPEX) from the company’s cash from operations. ExxonMobil’s free cash flow declined from $24.4 billion in 2011 to $1 billion for the first nine months of 2016:

So, here we can see that Exxon’s free cash flow of $1 billion (2016 YTD) is down 95% from $24.4 billion in 2011. The reason for the rapidly falling free cash flow is due to skyrocketing capital expenditures and falling oil prices. But, this is only part of the picture.