First, let us define carrying capacity and overshoot. And none has done that better than Paul Chefurka.
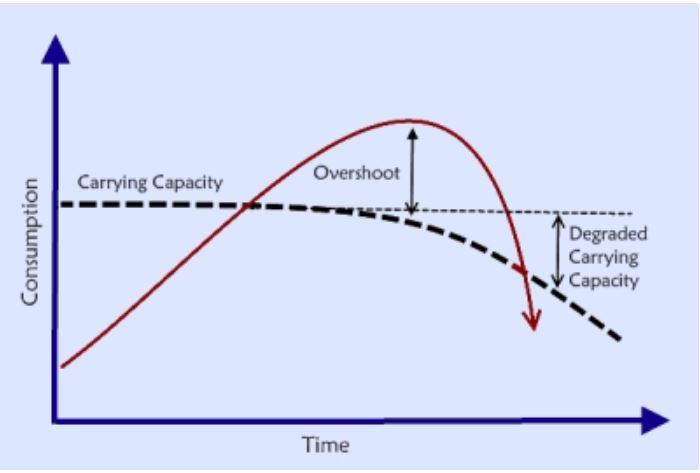
Carrying Capacity: Carrying capacity is a well-known ecological term that has an obvious and fairly intuitive meaning: “the maximum population size of a species that the environment can sustain indefinitely, given the food, habitat, water and other necessities available in the environment”. Unfortunately, that definition becomes more nebulous the closer you look at it – especially when we start talking about the planetary carrying capacity for humans. Ecologists claim that our numbers have already surpassed the carrying capacity of the planet, while others (notably economists and politicians…) claim we are nowhere near it yet!
Overshoot: When a population surpasses its carrying capacity it enters a condition known as overshoot. Because carrying capacity is defined as the maximum population that an environment can maintain indefinitely, overshoot must by definition be temporary. Populations always decline to (or below) the carrying capacity. How long they stay in overshoot depends on how many stored resources there are to support their inflated numbers. Resources may be food, but they may also be any resource that helps maintain their numbers. For humans one of the primary resources is energy, whether it is tapped as flows (sunlight, wind, biomass) or stocks (coal, oil, gas, uranium etc.). A species usually enters overshoot when it taps a particularly rich but exhaustible stock of a resource. Like oil, for instance…
When we talk about carrying capacity we need to define exactly who or what we are carrying. Are we talking about humans, all animals or what? Well, let’s just talk about terrestrial vertebrate biomass.
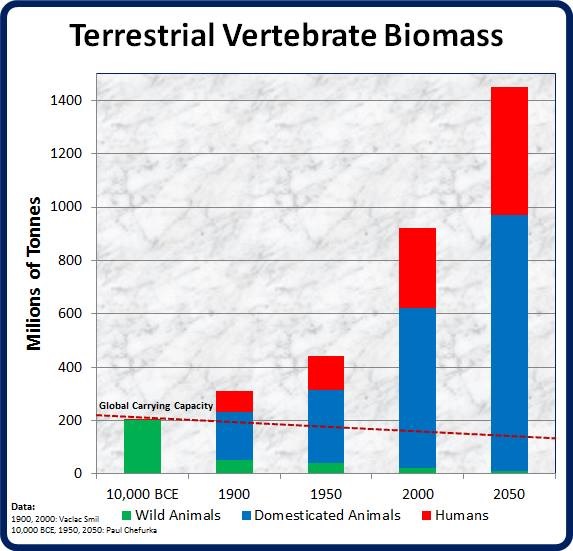
Okay, Vaclav Smil and Paul Chefurka (and the estimates of most earth biologists) are correct, the long-term carrying capacity of terrestrial vertebrate biomass is a little over 200,000,000 tons. But how do we know that amount is correct? Easily, because that is what it was for millions of years before the advent of agriculture and other things brought about by modern day Homo sapiens.
Plant and animal species all struggle to survive. In doing so they have evolved to fill every available niche on earth. If a plant can grow in an area, any area, it will do so. If an animal can find a habitat in any area on earth, it will do so. At least since the mid-Triassic, about 225 million years ago, plants and animals have occupied every available niche on earth. If any animal overshot its habitat, dieoff would soon correct that situation. So for many millions of years, the terrestrial vertebrate biomass remained at about two hundred million tons, give or take. I say that because climate change, sea levels rising and falling, continental drift would cause the long-term carrying capacity to wax or wane. Also, the estimate is just that, an estimate. It could be slightly higher or lower. But the long-term carrying capacity of the earth always remained at one hundred percent of what it was possible to carry.
Then about 10,000 years ago man invented agriculture. At first, this only enabled a slight increase in population. Soon only plants that produced the most grain, fruit or tuber per plant, or per area of ground, was selected for replanting. Genetic engineering goes back thousands of years.
Then they discovered fertilizer. Animal and human waste could greatly increase plant production. Animals were domesticated and the plow was invented. More food per area of ground could be produced. Then chemical fertilizers were invented and the population floodgates were opened. At first phosphates from bird guano dramatically increased agricultural production but around the middle of the last century nitrate fertilizers from the Haber Bosch process enabled the green revolution and enabled the population to expand three fold.
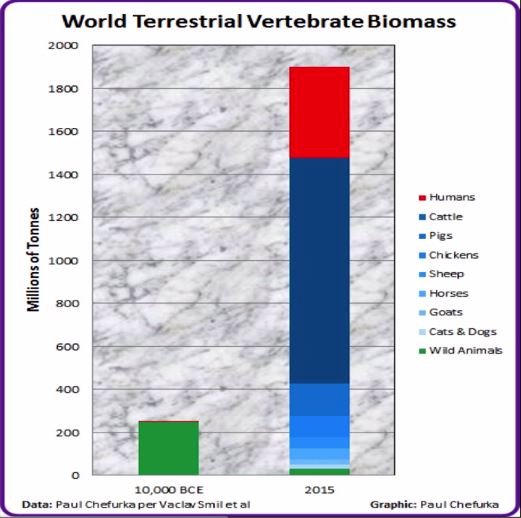
It’s mostly cows, then humans, then pigs then chickens then… Interesting that the biomass of chickens is ovwe three times that of all the wild animals combined. If this chart does not shock you then you are totally unable to be shocked by anything concerning the earth’s biosphere.
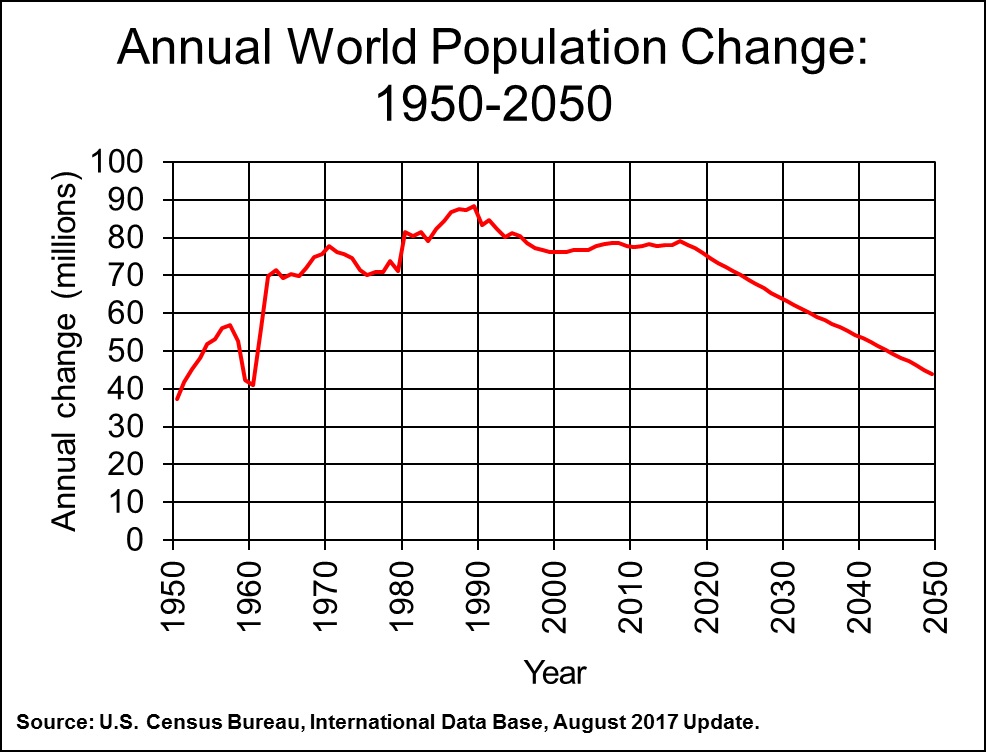
The world population is still expanding at an alarming rate. By 1989 the population was expanding by about 88 million people per year. Then by the year 2000 population growth had slowed to about 77 million per year. Then the slowdown stopped and started to increase again. it stands at about 79 million per year according to the US Census Bureau.
Now they are saying it will start to slow. But that slowdown has not yet started. True, the fertility rate has been dropping but that has been offset by the increase in population. The fertility rate is dropping but on more and more people.
Notice the U.S. Census Bureau starts the slowdown at almost the exact date this chart was drawn, August 2017. If they had drawn this chart in 1995, then no doubt they would have started their prediction of constant decline in 1995.
But I have no doubt that the population will start to decline. It must, it must because we are destroying the ability of the planet to feed all its people.
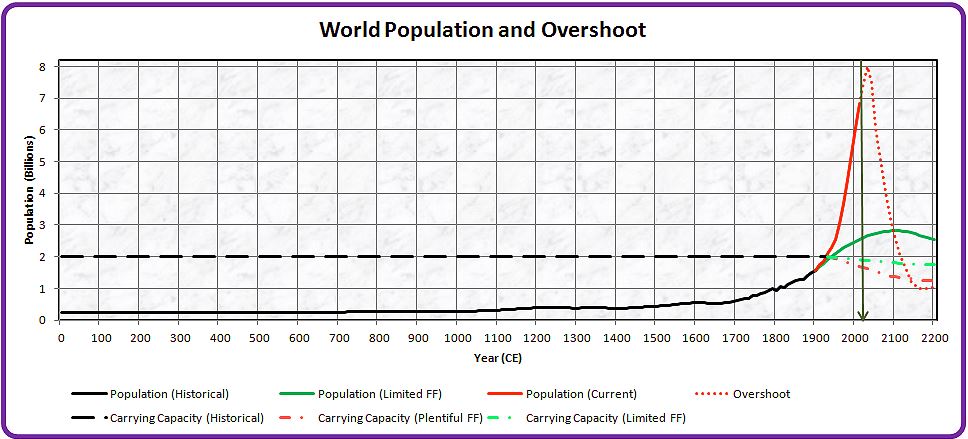
Paul Chefurka created the above graph in May 2011. I think he was a little off. He has the world population hitting almost 8 billion then starting to drop around 2030.
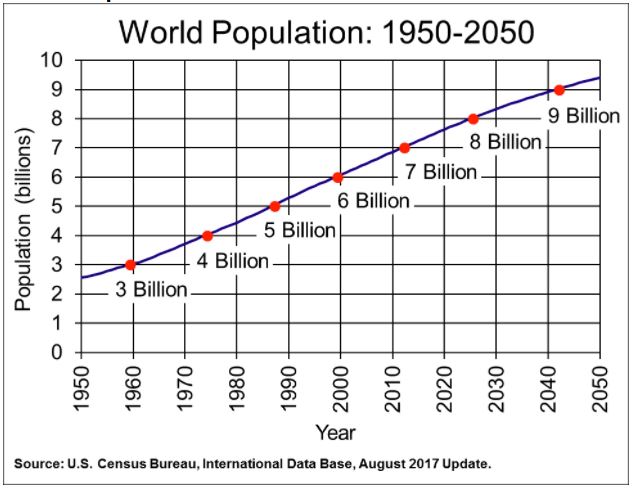
I am more inclined to agree with the U.S. Census Bureau who thinks the world population will hit 9.4 billion around 2050. Then I believe the population will start to fall. The rate of population decline and how far it will fall is hard to predict. That will depend on many things but primarily on if and when globalization collapses. The collapse of globalization will bring about civil strife, border wars, and famine around the world.
I want to call your attention to the green, wild animal, portion of the second graph at the top of this post. Notice the wild animal portion of the terrestrial vertebrate biomass, by 1900, had dropped to about 20% of its historical value. Then by 2000, it had dropped to half that amount. Then by 2050, we expect that 2000 value to be cut in half again.
By 2100, it will very likely all be gone. Well, almost all gone. There will still be plenty of rats and mice and perhaps a few other small vertebrates will still survive, but all the large megafauna, except humans, will be gone. Gone forever… or at least for the next million years or so. It will take that long for new megafauna to evolve after the human population has been greatly reduced to a billion or even a few million people.
But the far distant future is of little concern to us now. The sad fact of the matter is your descendants will live in a world completely free of wild megafauna. There is no way to avoid that fact now, it is already too late to stop the destruction.
WHY?
Yes, why? Why are we destroying the earth’s ecosystem? Why are we driving most all wild animals into extinction? Why have we dramatically overpopulated the planet with human beings? Why did all this happen? However, when you ask why, you are implying that all this had a cause, that someone or some group of people are to blame for this damn mess we have gotten ourselves into.
Was it the early farmers who invented agriculture. Or was it the early industrialists like James Watt or Thomas Edison? Or was it Fritz Haber and Carl Bosch, are they the villains that got us into such a damn mess? No, it was none of these people. It was no one person or no group of people. It was not even any revolution like the industrial revolution, the medical revolution or the green revolution. There is no one to blame and there is nothing to blame.
Agriculture enabled the very small early population to expand. The industrial revolution and later the green revolution enabled more people to be fed. The medical revolution enabled more babies to survive and people to live much longer. Our population has exploded simply because it could. We have always lived to the limit of our existence and we always will. It was just human nature pure and simple.
Now many will say that we are now controlling our population, that we have learned how to limit our fertility rate. Well, yes and no. Reference the below chart and table that were produced by the Population Reference Bureau in 2012.
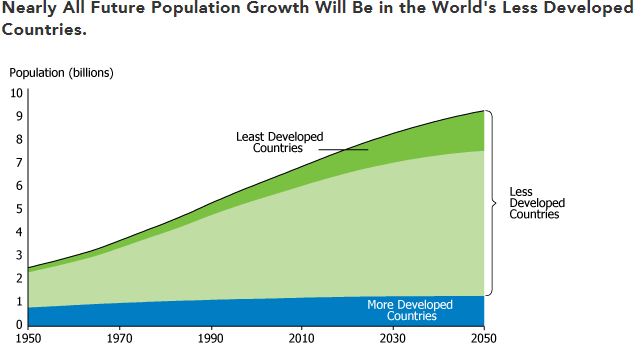
In the developed world, where most of the world’s energy is consumed, we almost have zero population growth. But in the less developed world, the population is still growing.
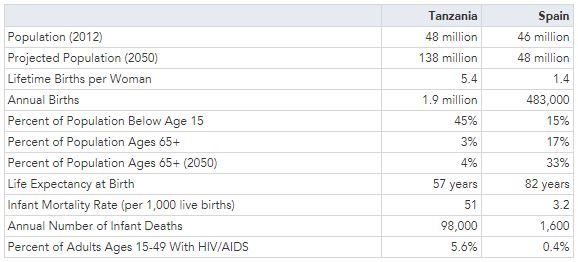
Here is the perfect example of what is happening, what is still happening, in much of the world. Notice the difference in the infant mortality rate and the annual infant deaths. Most of the world’s people are still living at the very limit of their existence.
<sarc>But not to worry. The death rate is rising, babies are dying, the population will soon start to fall in the undeveloped world. </sarc>
Note: The Paul Chefurka graphs in this post were created, primarily, with data from the research of Vaclav Smil and is published in this 24 page PDF file: Harvesting the Biosphere: The Human Impact. The file includes over 2 pages of notes and 4 pages of references where Smil sources and documents every stat he quotes. Below are a table and some text from the paper.

The zoomass of wild vertebrates is now vanishingly small compared to the biomass of domestic animals. In 1900 there were some 1.6 billion large domesticated animals, including about 450 million head of cattle and water buffalo (HYDE 2011); a century later the count of large domestic animals had surpassed 4.3 billion, including 1.65 billion head of cattle and water buffalo and 900 million pigs (FAO 2011). Calculations using these head counts and average body weights (they have increased everywhere since 1900, but the differences between larger body masses in North America and Europe and lower weights elsewhere persist) yield estimates of at least 35 Mt C of domesticated zoomass in 1900 (more than three times the total of all wild land mammals) and at least 120 Mt C in the year 2000, a 3.5-fold increase in 100 years (and 25 times the total of wild mammalian zoomass). And cattle zoomass alone is now at least 250 times greater than the zoomass of all surviving African elephants, which in turn is less than 2 percent of the zoomass of Africa’s nearly 300 million bovines (Table 2).
Please comment below.