All data for this post is from the EIA’s Petroleum Supply Monthly
The charts below are primarily for the largest US oil producing states (>100 kb/d) and are updated to August 2019. If you are interested in additional states, let it be known.
Ron has asked if I would take over the monthly posts for USA oil production. I have tentatively agreed to do that. Let us all thank Ron for his work at tracking US production and for his insights. Ron will continue to monitor what’s happening with US production and provide his comments. He is not going away.
This is my first post on US production by state. If you spot any errors, please let me know and I will try to fix them.
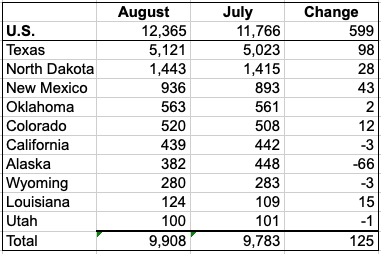
Listed above are the 10 states with production greater than 100 kb/d. These 10 account for 9,908 kb/d (80%) of total US production of 12,365 kb/d in August. Note that the GOM is not listed and its production increase of 469 kb/d is not shown.
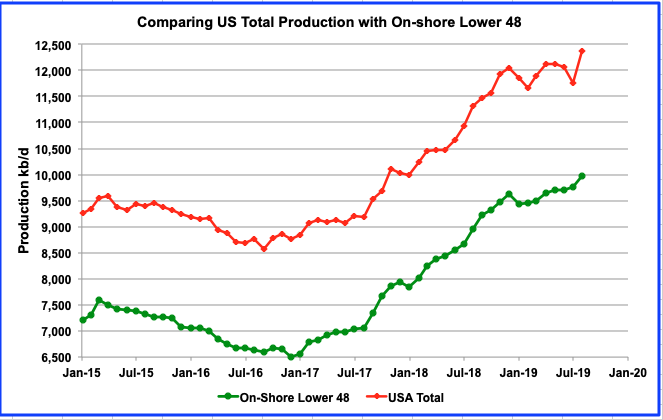
This is a comparison of total US C + C production with on–shore L 48. Total US production grew by 599 kb/d from 11,766 kb/d in July to 12,365 kb/d in August. On-shore production grew by 195 kb/d from July 2019 to August 2019, primarily due to increasing production from LTO fields. Due to a Hurricane in July, GOM July production dropped and as a result, total US production dropped significantly but rebounded to 12,365 kb/d in August. Comparing August to June, a more realistic comparison, the production increase was 305 kb/d or an average of 152.5 kb/d/mth.
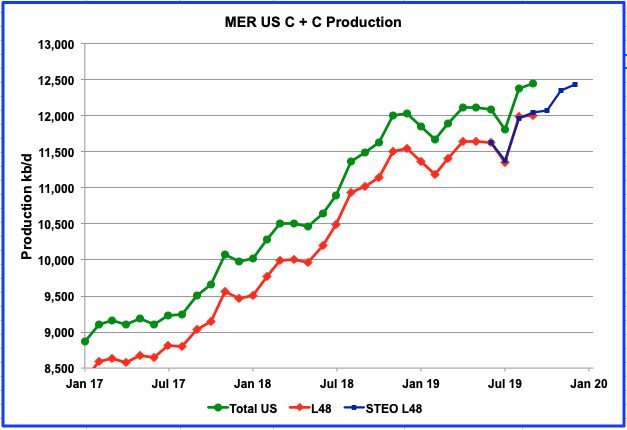
For comparison purposes, above is US C+C production from the October Monthly Energy Review. Note the MER projected production of 12,374 kb/d (extra 9 kb/d) for August and 12,450kb/d for September. Also note it is projecting flat LTO production from August to September, last two red dots. I have also added the October STEO estimates for the L48. As can be seen, the MER estimates for August and September are very close to the STEO projections. This indicates that the MER has access to updated data that is more current as does the STEO.
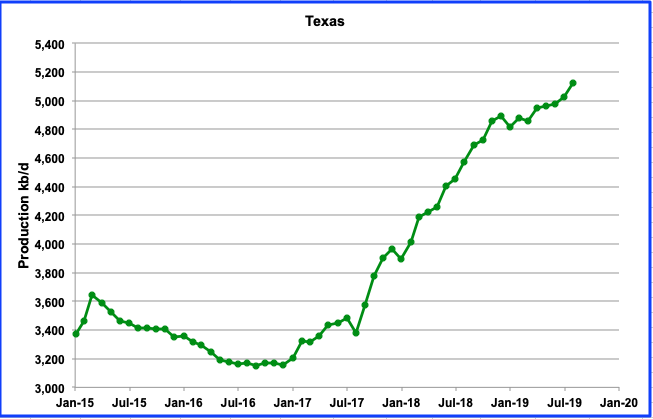
Texas production grew by 98 kb/d in August to 5,121 kb/d. The 98 kb/d represents 64% of the average monthly increase from June to August for all of US production.
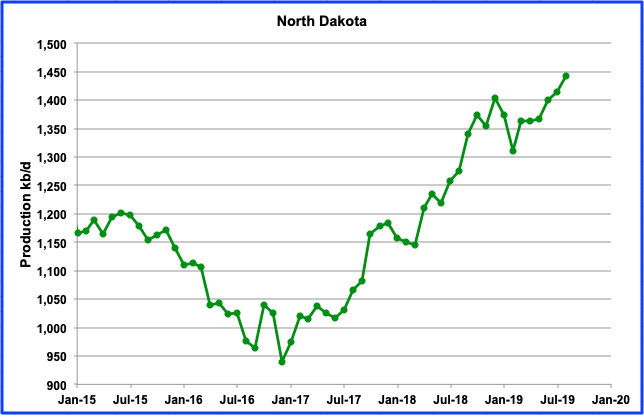
North Dakota continues to increase production from the low of February 2019 of 1,310 kb/d to 1,443 kb/d in August, an increase of 113 kb/d over 5 months. The August increase was 28 kb/d. ND production is currently not showing any sign of rolling over.
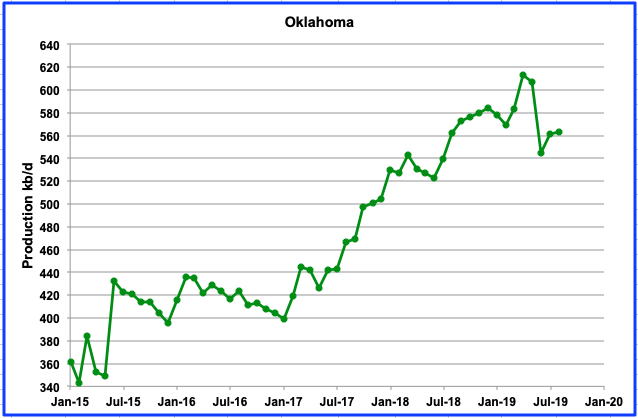
Oklahoma seems to have run into some difficulties in continuing to increase its production. One year ago, Oklahoma had 139 rigs. As of August 2019, it was down to 84, a drop of 54 rigs. According to the Tahlequah Dailly Press, apparently interest in developing petroleum resources in Oklahoma has dropped pretty significantly. Quoting from the article; “The state is competing against better oil and gas fields in other states and the Legislature has raised taxes on drillers by as much as $700 million, Warmington said. Comparatively, I always like to say our producers vote where they move their rigs, and they have voted by moving their rigs to other states,” he said.
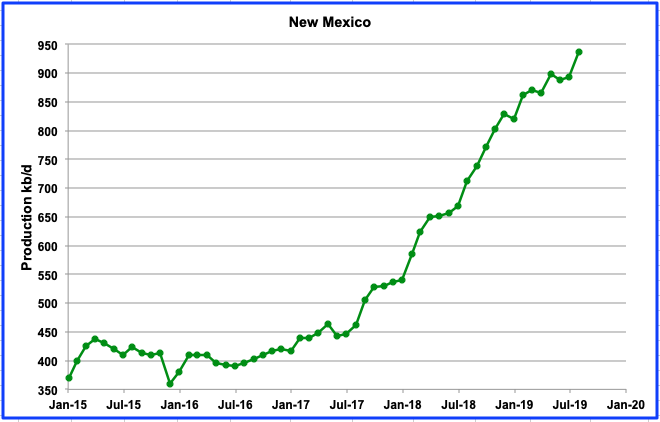
New Mexico has shown remarkable growth during 2018 and it is continuing in 2019. August growth was 43 kb/d.
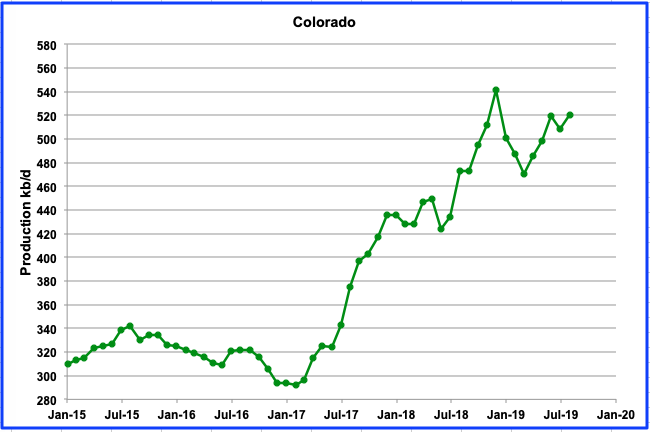
Colorado oil production is the main beneficiary of the Niobrara LTO basin. However, production growth may be slowing. One year ago August, Colorado had 30 rigs operating and as of August 2019, it was still 30 and production was down from the December 2018 high of 541 kb/d to 520 kb/d. Apparently, a new environmental regulation in Colorado has chilled investment in the state’s oil and gas fields as companies grapple with how local officials will respond to a law giving them more power to restrict energy production.
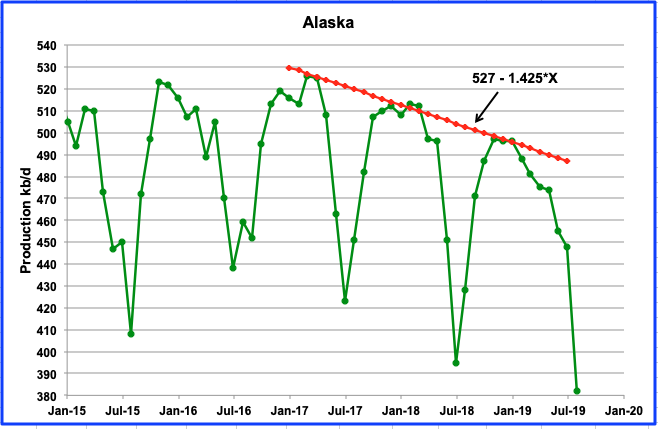
Alaska production has a very seasonal variation and reaches its lowest production month typically in July but this year it may occur August. Along with the yearly lows, Alaska has yearly peaks, associated with well maintenance. Recently the question has been raised as to whether production will ever get back above 500 kb/d? A straight line through the 2017 to 2019 peaks shows a decline rate of 1,425 b/d/mth. This decline, which is best described as a “Net decline”, is the difference between the natural decline in the field due to depletion and the addition of new wells. In the case of Alaska, the addition of new wells is not sufficient to overcome the decline from the older wells. Note that the drop in the lows from July 2016 to August 2019 is similar to the drop in the highs.
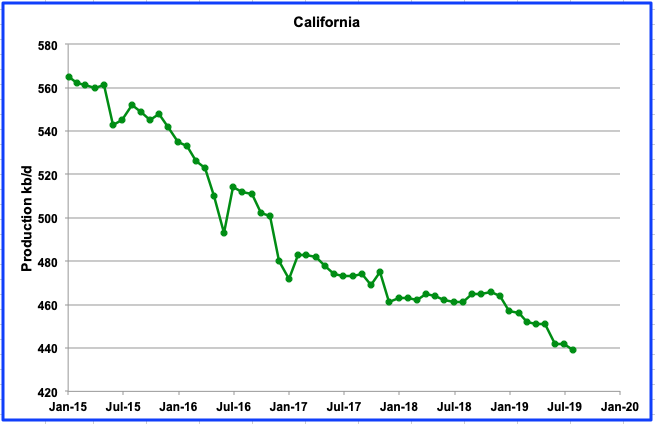
California is in steady decline.
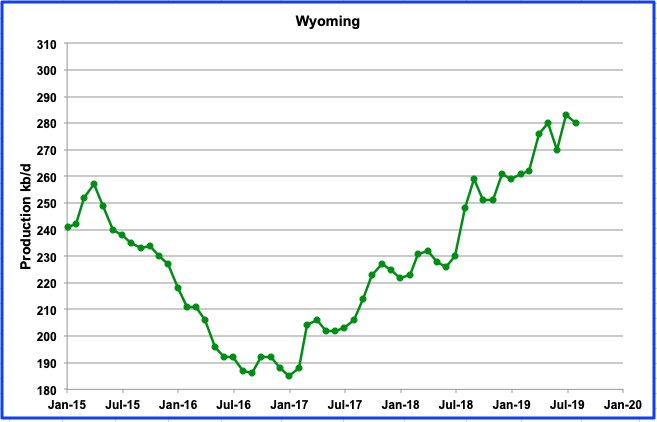
The northern portion of the Niobrara LTO basin is situated in Wyoming. The sharp increase in Wyoming production is directly related to increased drilling in the Niobrara. One year ago August, Wyoming had 29 rigs operating and as of August 2019, it has increased to 36. We should expect to see increasing production.
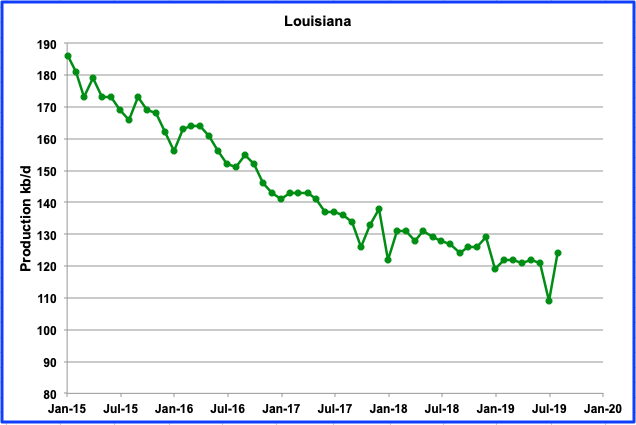
Louisiana is currently in a steady decline. However, Louisiana oil and gas producers are investing in the Austin Chalk formation that might significantly boost the state’s onshore production after decades of decline. The August increase of 15 kb/d raised production from 109 kb/d in July to 124 kb/d in August. We will need to wait a few more months to see if this increase is associated with drilling in the Austin Chalk.
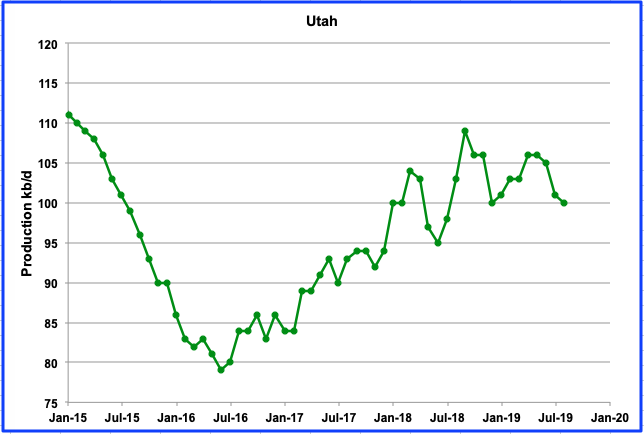
Utah’s increasing oil production starting in 2016 is related to the discovery of conventional oil fields. In 2004, the 100-million-barrel Covenant field was discovered in the central Utah. After reaching peak production of 109 kb/d in September 2018, Utah production may be entering a plateau period.
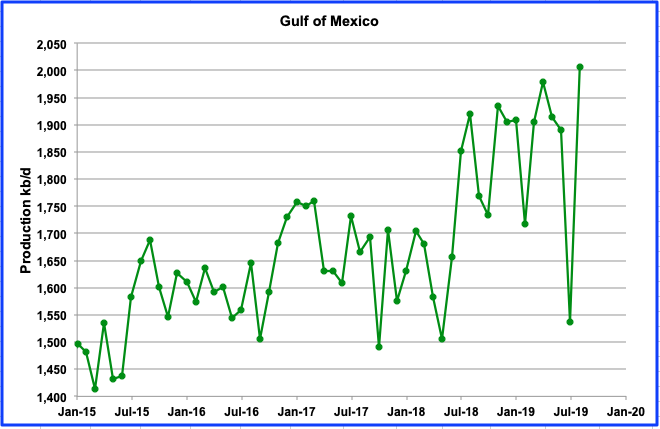
The GOM made a significant recovery from July’s hurricane induced lost production to hit a new high of 2,006 kb/d. From August 2018, production increased from 1,920 kb/d to 2,006 kb/d in August 2019, an increase of 86 kb/d over on year. Can it continue?
I am going to make use of some of the info that SouthLaGeo posted last month regarding the GOM. He said it has many fields/assets that are operating that could be expanded. This makes it difficult to predict what will happen in the Gulf. The fields include Atlantis, Thunderhorse, Mad Dog, Perdido/Great White, Jack/St.Malo, Tahiti/CaesarTonga, Mars/Ursa/Olympus, Shenzi that account for about 1/2 of GOM production.
In addition the Appomattox field started production in May 2019 and is expected to reach a production rate of 175 kb/d. It is not clear if its production is showing up in the August monthly data and accounts for the new high.
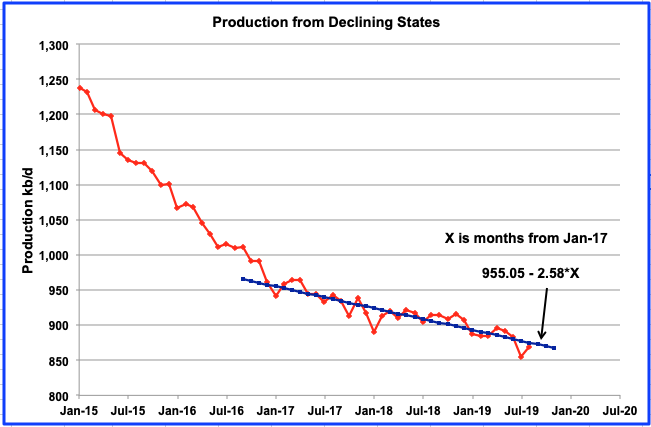
This chart shows total production from states whose production declined from January 2015 to January 2019, excluding Alaska. The decline appears to have slowed starting in 2017. A straight line estimate over the last two years indicates, a decline rate of 2,580 b/d/mth or approximately 30.96 kb/d/yr. Alaska peak production is declining at approximately 17.1 kb/d/yr. Combining the two gives a total annual decline of approximately 48 kb/d/yr for the states in decline. Note that the decline from LTO fields in considered to be a separate issue.
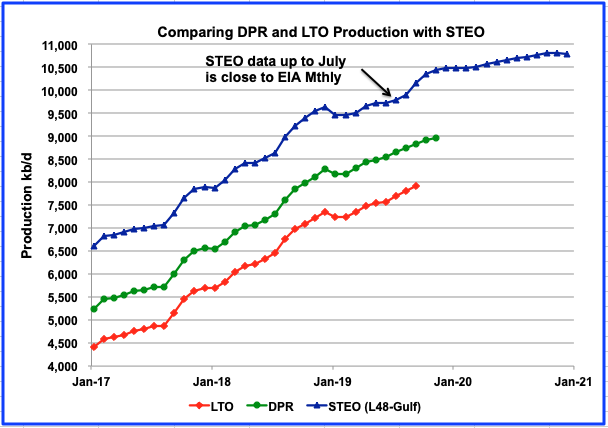
Above is a comparison of US C+C production according to the October STEO, DPR and LTO reports. The chart indicates that LTO production continues to power US oil output. According to the LTO report, over the last three months, LTO production has increased by 333 kb/d, or 111 kb/d/mth. Of that, the Permian contributed 248 kb/d, or 83 kb/d/mth. The current LTO trend is quite different from the flattening STEO projection going into 2020. The STEO is only showing growth 312 kb/d for the (L48-Gulf) for all of 2020 and an early sign of a peak in late 2020.
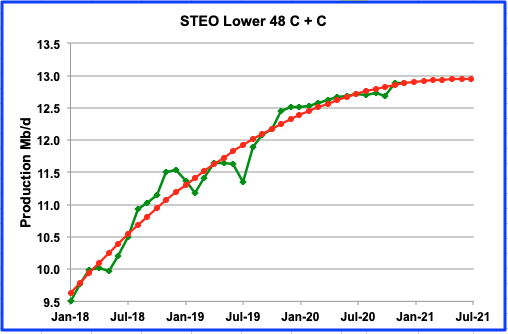
Above is the October STEO projection for production in the L48. The quadratic fit through the data indicates a peak around mid 2021. This chart will be updated around November 9 in the comments section to see whether the next STEO update continues to point to lower/slowing production going forward.
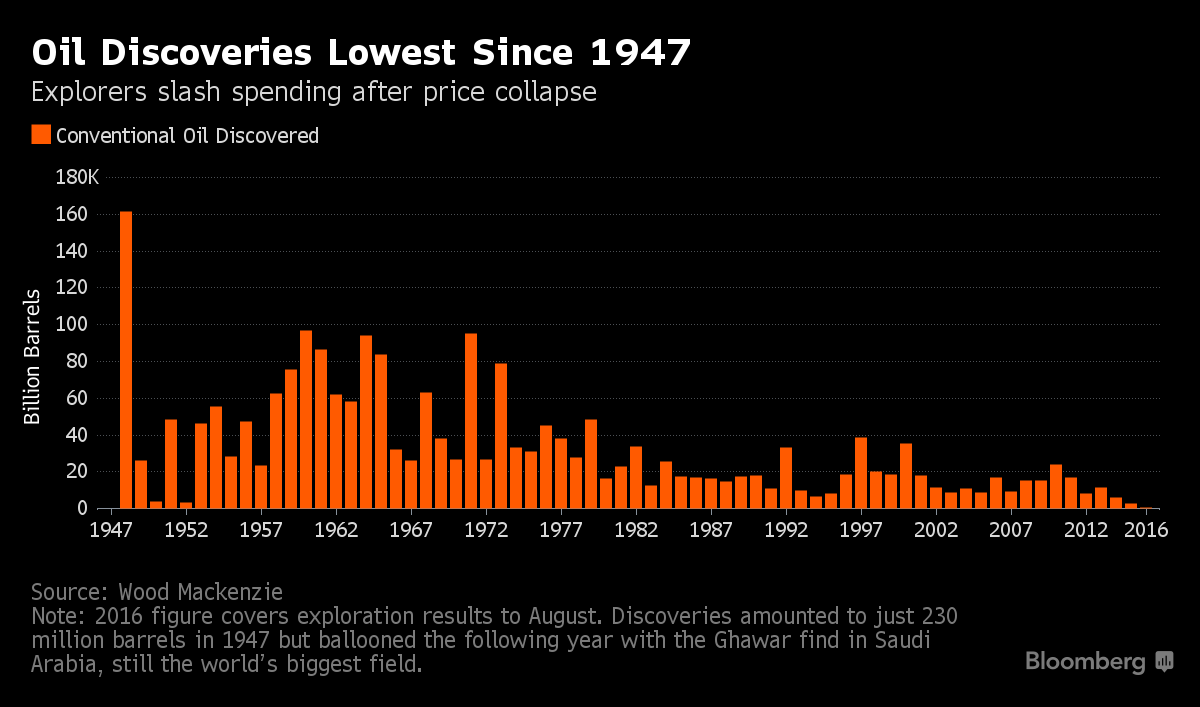
The last year when discoveries exceeded 20 B bbls was 2010, ~22 B bbls. Discoveries are in decline every year since 2010 on this chart. In 2017, the US alone added 11.2 B bbls and Saudi Arabia added 29.8 B bbls, according to the BP annual report. However, these may be updated reserves in known fields, as opposed to new discoveries.
Great post Ovi, thanks.
Russia cuts oil output in October, compliance with OPEC+ deal over 70%
They cut, but not by very much:
MOSCOW- Russia has lowered its oil output to 11.23 million barrels per day (bpd) so far in October, representing over 70% compliance with the OPEC and non-OPEC supply pact, a source familiar with the data told Reuters on Thursday.
Russian September oil output was 11.25 million bpd.
I found this sentence very interesting:
The agreement runs to the end of March 2020 and producers meet to review policy on Dec. 5-6. Russia has said OPEC and its oil-exporting allies would factor in the slowdown of U.S. oil output growth when they meet.
Thanks Ron
If anyone wonders why Russian shale oil is uneconomical, here is just one reason. Of course there are other reasons also. Bold mine:
Russia should reform oil taxes to sustain output: Energy Minister Novak
Alexander Novak said oil production in Russia, which has enough reserves of crude to sustain current production for over 50 years, could decline if the tax system remained unchanged.
“We have the highest oil taxes in the world. On average they amount to 68-70% of revenues. But in the case of West Siberian fields with no tax breaks, for example, they amount to 85%,” Novak said in an interview.
Corruption is another reason. I’ve read somewhere that Putin and friends pilfer something like 1/3 of Russia’s GDP.
Where did you read that, on a fence?
Try this link to start:
The mystery of Russia’s missing wealth shows how Putin retains his power
Also, read this book by Karen Dawisha:
Putin's Kleptocracy: Who Owns Russia?
OMG, imagine all those money how many billionaire-entrepreneurs could entertain!
So there is a desacceleration in worldwide economic and oil production growth. Interesting. Points toward 2020 being also below the 2018 production.
Further on it will be more and more difficult to boost output if needed.
So the boss can only buy one corporate jet. Boo fuckin hoo. Companies are always whining about taxes.
The Russian government is smart to cash in on the oil revenues. The American government is moronic to give companies a tax break for depleting reserves.
I wonder why Texas production keeps rising even with a significant decline in the rig count. Are they just drilling more wells with fewer rigs, or are they just catching up with a large number of DUCs?
In 2018 Texas production grew by an average of 83,000 barrels per day per month. For the first 8 months of 2019 Texas production has grown by an average of 28,000 barrels per day per month. Soooo???
Joe,
The key figure is horizontal oil rig counts, those remained fairly steady at about 440 rigs from July 2018 to Jan 2019. Also keep in mind there is about a 4 month lag between changes in rig count and changes in completion rate, so the Jan 2019 rig count would affect May 2019 completions and the April 2019 rig count would affect August 2019 completions (which would affect August 2019 output). By April 2019 the horizontal oil rig count had fallen to 418 rigs (about a 5% drop). It is possible greater rig efficiency might have allowed a continued increase or possibly more DUCs were completed than before. There is always some variation month to month, the number of wells drilled per rig does not remain constant.
Scenario below compares pretty closely with Ovi’s fit to the STEO, with about a 1 Mb/d increase in tight oil output from July 2019 to July 2021. This scenario assumes no increase in the completion rate for tight oil wells over that 2 year period. This seems to be a very conservative scenario to me. It might be the case that the completion rate remains flat for a few months, but a two year period seems unlikely to me.
Consider that in the Permian basin the trailing 12 month average completion rate increased from 231 in July 2017 to 456 in July 2019, a decrease in the rate of increase in the completion rate seems reasonable, a decrease in the rate of increase in completion rate from 112 per year to zero (as in a flat completion rate scenario) seems extreme, but that is what is required for a scenario that has US tight oil peaking in 2021.
The Next Energy Problem: Has Shale Oil Peaked?
https://www.jdsupra.com/legalnews/the-next-energy-problem-has-shale-oil-24963/
US shale production started falling around April 2015 and didn’t recover until about April 2017. During that time fell maybe about 12%? Global production was a lagging indicator, not beginning to fall until a year later – let’s say April 2016 and recovered about the same time as US – approx April 2017. I’m sure people will quibble over the details. But it would be interesting to take that same scenario starting April 2019 as US shale production growth slows to a crawl.
How would that slow down correspond with “natural decline” rates in other countries? Could it mean peak 2019 as a two year slow down would prevent LTO from ramping up in time to overcome declines elsewhere. I think this scenario is unlikely, but about as unlikely as say Peak 2030.
Could it mean peak 2019 as a two year slow down would prevent LTO from ramping up in time to overcome declines elsewhere?
Perhaps you meant 2018 as world oil production in 2019 will be well over one million barrels per day below that of 2018.
i’m not getting into the middle of that one – Dennis set this man straight! 🙂
Two cats,
I agree that 2019 average World output will be less than 2018. Not sure of the total difference probably a bit less than Ron thinks. It may depend on oil prices and I don’t know what those will be, though only 2 months left.
We only have World output through June 2019. We will have our answer in May 2020.
We only have World output through June 2019.
Check again, Dennis. We have World output through July. And the average dropped again in July. And it will continue to drop in every month except August… so far. The drop in September will more than offset the gain in August. And down again in October.
What are you willing to bet that world oil production will not be down by one million barrels per day by the end of the year?
Note: World C+C production was up 255,000 bpd in June and down 505,000 bpd in July. Likewise, the decline in September will be more than twice the increase in August.
Ron,
I don’t think I can predict future oil output with any precision, whether World C+C output is down by 999 kb/d or 1001 kb/d from the roughly 83000 kb/d level in 2018 is of little significance, the World currently is well supplied with C+C as is evident from the price of a barrel of oil on World markets.
Essentially too much oil was produced in 2018 so the market has adjusted.
As the World economy grows and demand catches up with oil supply, oil price will rise and so will oil supply up to 2025 or so when the peak is reached.
I would say there is a 50/50 chance you will be correct about World annual average C+C output in 2019 being 81973 kb/d or less.
Not a bet worth making.
I would say there is a 50/50 chance you will be correct about World annual average C+C output in 2019 being 81973 kb/d or less.
I agree 100%. I think it will be 100 kb/d either side of down 1 million bpd. I was just wanted to make it interesting with a bet.
Russia + OPEC, 51% of world crude oil production in December 2018, will be down about 2 million barrels per day in 2019. Non-OPEC less Russia will be close to flat. So down 1 million BPD will be very close.
Ron,
Sounds pretty reasonable, not clear that non-OPEC minus Russia will be flat, but if that guess is correct you may be right on your World C+C output guess for 2019, we will know in April 2020.
I presume if the KSA oil plant was not attacked, 2019 production would have been slightly higher than 2018?
Techguy,
Probably not because OPEC+ has been trying to reduce excess World oil stocks by decreasing output since Dec 2018.
There was too much oil produced in 2018 relative to demand, 2019 output will be lower to balance the oil market. Output is likely to rise over the 2020 to 2025 period, probably to 85 Mb/d at minimum and possibly as high as 87 Mb/d, in my opinion if my medium URR scenario (3200 Gb) for World C+C output is roughly correct.
Good God, are you serious? Do you actually believe world 2019 production is higher than 2018? Dennis is not going to set me straight because he knows I am right.
Right now, 2019 world C+C production is 741,000 barrels per day below 2018 production. And that is only through the first 7 months. When the December data comes in, 2019 world oil production will be a lot more than one million barrels per day below that of 2018.
The 2019 data for the chart below is January through July.
no – i agree with you – it’s just that I’ve seen, oh, I don’t know, conservatively, maybe 10,000 posts back and forth between you and dennis arguing 2018 vs 2019, 12 month trailing averages, and on and on. if I had said 2018 peak, then I’d bet everything I’m worth that dennis would have chimed in saying that monthly peak is actually in 2019. so what i’m saying is don’t put us poor commenters inbetween the constantly fighting parents. 🙂
keep in mind, i didn’t say “annual average peak 2019” I just said peak 2019. that could have meant the best second, best minute, best day, best week, best month, best quarter. of all those units of time measurements- which one was better 2018 or 2019? ….
(psst, everyone else, that should keep ron and dennis distracted for a few days, so you’re welcome) 🙂
Oh, don’t get snarky. And stop crawfishing, you said what you said.
I made a slight error in my calculations yesterday. The decline in World C+C production for 2019 is 741,000 barrels per day.
The chart below is World C+C, January 2018 through July 2019. The red dots in the are the average for the year. The Peak month was, very obviously, November of 2018.
*For those who don’t understand Southern colloquialisms, to crawfish is to crawl backwards. (That’s what crawfish do.)
where is the 12 month trailing average on that chart? check out the conversation you and Dennis had on 10/24 – just 10 days ago. Dennis does not seem nearly convinced as you. and you are literally squabbling over 2 months (nov 18) instead of addressing…
the very interesting possibility that we have a 2016 style dip in oil production and how that might affect Dennis projections which ALL SEEM TO ASSUME nothing like that will happen, and it seems economically most markets consider that a very real probability. Dennis is often saying oil production is determined on price but he never has predictions based on a dipping price. We literally have a recent example of a price dip that if you replayed that same scenario (I know, zero change of being 100% accurate, but just interesting as a model)… etc etc
now, on the issue of your correction, i’ve said that I agree with you, I had smiley faces on all my posts, and you are literally squabbling over a two month gap on the most significant event probably in industrial civilization and what will lead to the deaths of probably billions people (nov 18 vs e.g. jan 2019). but that I also notice that people on the forum get railroaded over details you and dennis – one side or the other, taken as gospel, and that others do not, and it kind of bogs down the conversation. you are way too easy to bait and I’m agnostic on the “precise moment of peak oil” mainly because I don’t think its that important. but if it helps – I apologize for dismissing your concerns. I could have sworn Dennis believed that the 12 month trailing average peak was in 2019, I must be wrong. I could have sworn at some point you responded that the 12 month trailing average wasn’t that important. If I had said peak oil 2018 then there is non-zero percent chance (if Dennis does in fact believe what I just said) that Dennis would have chimed in to derail my comment by saying that the 12 month trailing average was in 2019, ergo peak oil 2019. you see the bind i’m in?
I get snarky because this is a world where it is very difficult to win an argument because someone can always come with a set of facts or a statistical angle that supports their argument. So I was trying to keep it light that the argument was not vital to my comment. but it was a bad strategy, i’ll try something else next time. keep up the good work guys – you are doing all the work – I’m mainly just a consumer of your product.
Cats, the 12-month trailing average peak will be in 2019, May to be exact, even if 2018 is the peak. But I clearly stated that I was looking at yearly averages. I stated that my 2019 average was January through July. Next month It will be January through August, and so on until we get the 12 month average January through December. And that will be compared with the 2018 12 month trailing average, January through December.
At the end of 2019, the peak month will be November 2018 and the peak year will be 2018. That will be the case regardless of when the 12 month trailing average peaks.
thanks for clarifying. again, sorry if I upset you – wasn’t my goal. appreciate what you do here.
Really, you did not upset me. Aggravated a bit by the misunderstanding, but definitely not upset.
Dennis and I have no real disagreement. He is just a bit more optimistic than I. However I could say that about almost everybody on this list… except one or two of course. 😉
two cats,
If prices decrease output will also decrease (probably a lag of 4 to 6 months or more).
The decrease in output is likely to lead to higher oil prices unless there is a major World recession that has reduced demand for oil, that is always a possibility, I just don’t think I can predict future recession dates.
Generally economic growth is the norm and higher demand for oil, as supply becomes constrained prices will need to rise to destroy enough demand to balance the market.
At some point (probably around 2035 to 2040) there might be a transition to non-petroleum sources of energy for land transportation. If that eventually occurs, we might see oil prices decrease and output will fall due to falling demand and falling oil prices.
The chart below shows an “EV” transition where most land transport transitions to EVs over the next 30 years. The “supply” function assumes no such transition occurs and that there is plenty of demand for as much C+C output as can be profitably produced. The “demand” function assumes that an EV transition does occur due to falling battery cost and rising oil prices, eventually the demand line falls below the supply line and supply will fall to match demand (and oil prices will fall in such a manner that oil supply and demand will roughly match over the long run.)
As far as I know there was no recession in 2016 yet US LTO and global production decreased for years/year. We been stuck in a low price environment (for what LTO and foreign budgets require) for about a year and CAPEX cutback articles are coming out in earnest. We are on the verge of a mutli month slump in oil production.
Two cats,
There was a drop in oil prices due to an oversupply of oil from an average of over $117/b in 2018$ from 2011 to 2014, to $57/b in 2018$ from 2015 to 2018. The sharp drop from $105/b in 2014 to $46/b in 2016 (both in 2018$) for a barrel of oil caused a cut back in oil output, so price drops due to over supply can certainly occur. I just think it unlikely that the over supply situation will remain permanent.
trailing 12 month output was pretty flat in 2016 and 2017 (low prices) and rose in 2018 (when oil prices rose from $55/b to $71/b, both in 2018$.) Output has now levelled off as oil prices fell again due to over supply.
Output has now leveled off as oil prices fell again due to over supply.
Huh????
Ron,
The TTMA is down only slightly from 83105 to 82957 or by 48 kb/d, which is 0.06%, seems pretty flat to me. See red line on chart.
Two cats,
As far as the “decrease” since 2016, the trendline for World C+C output from Jan 2016 to July 2019 shows an average annual rate of increase of 786 kb/d over that period, though output has been volatile as OPEC has tried unsuccessfully to manage World oil supply.
Dennis, the data is not flattening out, it is headed down with a vengeance. The Twelve-month trailing average is just that, a trailing average. It in no way represents what is happening to the data today.
At any rate look at the next five data points that the 12-month trailing average will drop off. They will be the highest ever recorded in the history of oil production. And the data points that will take their place will be two, then three million barrels per day lower than those removed.
What do you think will happen to the twelve month moving average then?
But you said the output has levelled off. No, it has not. The world crude oil output is falling like a rock.
The Twelve-month trailing average is just that, a trailing average. It in no way represents what is happening to the data today.
Ron, that’s one good reason why a centered moving average is better: it’s clear to the reader that the latest point on the average is an average of 6 months old.
The other benefit of a centered moving average is simple: it’s much clearer. Try comparing a centered average to a trailing average: it looks much better: the average lines up with the individual points in a way that’s just much more obvious.
Ron, that’s one good reason why a centered moving average is better: it’s clear to the reader that the latest point on the average is an average of 6 months old.
Nick, I agree 100%. Nevertheless, I must deal with Dennis’s post which only deals with the trailing 12-month average. You know, and I know, that the centered average is much more accurate and important. Nevertheless, Dennis thinks the 12-month trailing average is what is important. Sooooo…. we must deal with that.
Of course oil production, in the last six months, has collapsed. The 12 month trailing average does not yet show that. But it will. There is just no denying reality, no matter which average you look at. The truth will eventually show up.
Hi Ron,
You pretty consistently use the trailing 12 month average, so I thought that was your preference, have you ever used the centered 12 month average in a chart? Not that I remember. I switched to be consistent with what you do. I am happy to use the centered 12 month average, maybe you should as well.
Check your 12 month averages in your most recent post, in every case you use the trailing 12 month average whenever you find a “12 month average”.
http://peakoilbarrel.com/opec-september-oil-production-2/
Chart below has centered twelve month average (CTMA).
Yes, I do often use a 12-month trailing average and will continue to do so. I could try centering it but doubt that I will. I fully understand that it is a trailing average and does not represent the latest trend.
Dennis,
That looks great.
That leaves the interesting question of what to do with the pesky first and last 6 months. It looks like you’ve handled the first 6 months in a straightforward way: including them in the moving average. That makes the first month average equal to the first 6 months, the second month average is a 7 month average, and so on.
You can handle the last 6 months the same way. You can also do a projection for the last 6 months, perhaps an exponential smoothing, or a simple linear projection using the last 12 months of data. But, that might confuse people and cause controversy.
So, I’d say you’ve got it just right.
And, I’d suggest using it in general instead of the trailing average – it’s just much more effective for the readers
Ron,
I understand what a trailing average is very well, thanks.
Usually what you claim I don’t know, is not correct.
As all I was saying that you got all concerned about was that output (and I meant 12 month average output) had levelled off.
You do see, I imagine, that the monthly level of output changes sharply up and down with no rhyme or reason.
Just because output is down sharply for the past 8 or 9 months tells us nothing about the following 8 or 9 months.
I will use the centered 12 month average in the future, it was not a big deal for me to picture it 6 months to the left as is the difference between the two so I had used it to be consistent with your charts.
Seems some find that confusing.
Just because output is down sharply for the past 8 or 9 months tells us nothing about the following 8 or 9 months.
Dennis, you must know that this is not correct. If the output for the past 8 or 9 months, then there has to be a reason for this decline. That is, is the reason natural decline or deliberate cuts, or a little of both. In any event, whichever it is, it has a definite effect on the next 8 or 9 months of production data.
Now we might not know what the cause is. But nevertheless, the cause of that decline will have a definite effect on the next 8 to 9 months of production.
It is my firm conviction that the production levels of the last 3 or 4 months of OPEC+ production last year was simply positioning for OPEC quota levels. If that is correct then production levels for the next few months represent maximum output production rather than deliberate cuts.
I do not expect a return to the levels of production for the last quarter of 2018 if quotas by OPEC are lifted.
That’s all I am saying. Nothing more.
It’s interesting to look at Dennis’s latest chart, with the centered moving average. It’s much easier to look at, and we can see that the current decline looks very similar to several other years: 2011, 2016 and 2017 all look remarkably similar.
Ron
I focus on 12 month average output. Monthly data is of less interest, look at past data highly variable and noisy. Trends change suddenly and unpredictably.
As the name implies the trailing 12 month average shows how the past 12 months of data has changed in successive months. The monthly output rose sharply and then it has fallen sharply, when oil prices rise in the future, output will probably rise sharply yet again, no idea what future oil prices will be. If World C+C output remains 81 Mb/d, I expect oil prices will rise sooner rather than later.
Good afternoon, Ron. Something is not converging.
Fact that a lot of growth messages
oil consumption recently, every year at 1-1.2 million barrels per day.
Let’s take a smaller figure for calculation, let consumption increase by 1 million in 2019 and this will be 365 million for the year. At the same time, you write that production decreased by 741 thousand barrels and will be even lower. Take the 800-thousand digit, we consider for a year 800 * 365 = 292 million barrels.
Thus, world stocks should be reduced by the end of the year by 657 million barrels (365 + 292). This is a big figure, I doubt it is so. Maybe you have some data on world salaries or maybe oil consumption has fallen sharply?
respectfully
Alexander
Opritov, it’s early morning here in the USA. But no, I don’t have any data on salaries or consumption. However, oil prices are low because we have a glut. If production continues to drop the glut will disappear and prices will rise.
From your link, the chart below.
Thanks Tony.
Excellent piece.
Unconventional rig count, both oil and gas, drops below 700, down to 694 on 1 Nov 2019. The Permian has 416 of these rigs.
https://www.naturalgasintel.com/articles/120079-us-drilling-count-extends-slump-as-eight-rigs-exit-patch
Tony
What is more important is the power of the rigs and technology used
https://www.hartenergy.com/exclusives/improved-directional-drilling-through-automation-176418
Better technology will hit the more productive areas and the most powerful rigs can drill longer and quicker.
Tony
We keep hearing, slowing, slump? What does that mean and can it be quantified? The latest September data from the EIA LTO report provides a clue. While most LTO basins are slowing, two continue to show growth, Permian and Bakken. Below is a chart for the Permian which in 2018 increased production at an average rate of 95 kb/d/mth. The average rate for 2019 so far is 61 kb/d/mth. However what is interesting is the average over the last three months. June production was 3,563 kb/d while September was 3.811 kb/d, an increase of 248 kb/d, for an average of 82.7 kb/d/mth. This is not much slower than the 2018 average of 95 kb/d/mth. I have read that drilling activity increases in Texas in the last 4 months of the year. It will be interesting to see what the LTO and DPR reports show for October.
Very interested article from Exxon where they make clear Investment in Brazil need to kompeat with other options such as US shale, it means profit is still an important factor . I Believe Exxon have lots off active drilling riggs in Permian and if they deside to invest more offshore and use some of their future budget for Permian US shale production will be flat or start decline already in 2020.
https://www.rigzone.com/news/wire/giant_offshore_brazil_oil_discovery_may_be_expensive_for_exxon-01-nov-2019-160219-article/
Fracking banned in UK
https://www.theguardian.com/environment/2019/nov/02/fracking-banned-in-uk-as-government-makes-major-u-turn
Oil-field services company Cudd Energy Services is laying off all 117 employees at its San Antonio facility due to a slowdown in fracking activity.
https://www.expressnews.com/business/eagle-ford-energy/article/Fracking-slump-is-hitting-home-in-S-A-14803514.php
Fairly interesting information about state-by-state output. I could suggest a sequel post going back decades. It’s pretty clear that shale defines our present, but there are many states that used to produce oil and now produce none, and clearly that’s true regardless of shale, of which they may have none.
Oklahoma was supposed to be a CLR heroic region. Surprising.
Regarding GOM production – I’ve become more aligned with the EIA’s short-term outlook as of late where they have 2019 production at 1.9 mmbopd (of course we already have data for 70% of the year!) and 2020 production at 2.0.
I came across a list recently of GOM projects set to come on line in 2019-2020 but can’t find it now. The source was, I believe, Rystad. They listed about 10 projects. 6-7 or so were of the 1-3 well tieback variety which contribute about 10-20 kbopd each. LLOG’s Buckskin was included where their initial development has 2 wells producing at about 30 kbopd. BP’s Atlantis Phase 3 should be a 20-40 kbopd project. The most significant projects are Appomattox and Vicksburg – a tieback to Appomattox. As those Norphlet projects ramp up, they should be the most significant contributors to the increase in production in 2020.
The most significant projects coming on line in 2021-2022 are Mad Dog 2 and Vito. Those should help contribute to GOM production staying at or above 1.8 mmbopd out to 2025 or so.
And there are a few significant projects further out in the queue including Whale, Ballymore and Anchor. Maybe 2023-2025 first oil for these.
SouthLaGeo
In Ron’s OPEC September update you posted info on the GOM and Rystad which I used in my comments on the GOM. If you check Ron’s post, you may find what you are looking for there.
Ah,, that’s actually a different Rystad reference,, that reference is regarding the comment below by Oil bull 2020s.
The recent one was published by someone else,, not Rystad, but I’m pretty sure it referenced Rystad.
SouthLAGeo,
Thanks for the update.
From this Rig Zone article it is emention GOM production is supposed to increase 44 kbpd in 2019 and 190 kbpd in 2020. Production should reach 2 mill bpd in 2019. Perhaps this now is reviced down , at least it seems GOM will not contribute much to increased US oil production if oil price remain in 60-70 usd range
https://www.google.com/amp/s/www.rigzone.com/news/gulf_oil_production_to_set_records_through_2020-17-oct-2019-160087-article/%3famp
What is y’all’s opinion on Rystads research saying the world is only replacing 1 in every 6 barrels of oil?
Oil bull 2020s
This is pretty serious stuff. It is another indicator that we are getting close to that peak. I have added a chart to the end of the original post above since I could not add it here. Take a look. Appreciate that we are consuming about 30 Bbbls/yr of C+C and 36.5 Bbbls/yr of Oil.
The Rystad work is just referencing conventional discoveries. They predict we will finish out the year with about 10 BBOE, with a gas:oil ratio of 58%/42%. So that is about 4 BBO – and we produce about 30 BBC&C and 36.5 BBO/year (as per Ovi’s comments right above – thanks!). So, that’s more like 1:7 to 1:9 ratio, but, when you add unconventionals back in – then it doesn’t look quite as bad.
Since Rystad released this report, BP announced a big gas discovery called Orca off Mauritania – but that doesn’t improve the oil picture.
I still have the view that the reason oil exploration successes have been down is not because the industry is still rebounding from low oil prices, but, primarily, because the opportunities just aren’t there. I know a lot of industry folk might disagree with me on this.
Having said that, I still think Mexico and Brazil are 2 of the best places globally for future oil discoveries.
This, in my opinion, is what peak oil looks like.
SouthLA Geo,
More great stuff, you make us all smarter, thanks. The extra heavy oil (API gravity <10) resource is large (possibly 500 Gb,) but it is difficult to ramp up output quickly, especially in Venezuela, but even in Alberta. The tight oil resource at perhaps 100 Gb can be developed quickly, but is likely to peak in 2025+/-2 years (depends in part on the price of oil). Perhaps a lot of conventional oil will be discovered in Brazil and Mexico, my model for conventional oil discoveries from 2018 to 2100 is about 188 Gb over that period for my best guess scenario (see chart below.) That scenario peaks in 2025 for World C+C output.
Is there unconventional worth mentioning on this scale, though? Yearly? A legitimate mean estimate of Bakken recoverable reserves is 7.4 billion and that’s total, not annual new discovery. For example.
Propoly,
Chart is conventional discovery. I agree unconventional would be much less than conventional.
For tight oil about 66 Gb left to add from resources to reserves, no idea on extra heavy oil maybe 300 Gb for Venezuela and Canada oil with API gravity <10.
I use USGS estimates for tight oil TRR and my estimates for World extra heavy oil URR is 200, 300, 400 Gb for low, medium, high scenario.
Surprised at the sustained growth and a bigger jump on the way onceAlaska resumes. There’s been a lot of opposition to Dennis’s predictions but it looks like they’re on the money.
Ovi
Your post is now on https://seekingalpha.com/article/4301830-usa-oil-production-state-updated-august-2019
Thanks Tony
I hope it attracts more viewers to this site.
Saudi regulator approves Aramco’s share listing request…
https://www.aljazeera.com/ajimpact/saudi-regulator-approves-aramco-share-listing-request-191103060527522.html
For suckers only. Giant red flag it’s not going to be on a major exchange. Bigger flop than WeWork?
Bold theirs:
Conventional Non-OPEC Oil Production Continues to Decline 06/ 11/ 2019
“According to the IEA, non-OPEC production outside of the U.S. and Russia peaked in June 2018 at 32.8 mm b/d and has since declined by 800,000 b/d.”
The dearth of conventional oil discoveries over the last two decades has now started to seriously impact supply. Over the years we have written at length how slowing conventional non-OPEC supply would surprise market watchers as soon as this year. As we first reported back in Q4 of 2017, large conventional oil discoveries have become more and more elusive. Conventional discoveries have lagged production by 170 bn bbl over the past six years, leaving the non-OPEC world susceptible to a more pronounced production shortfall. While “Hubbert’s Peak” is widely viewed as debunked, due to the U.S. shale plays, conventional oil production in the rest of non-OPEC has actually been declining for the past decade. In the spring of 2018, we stated that conventional non-OPEC crude production had declined by 175,000 b/d on average each year between 2010 and 2018 and that these declines were set to accelerate. We explained how both the size and number of new conventional projects would slow in 2019, making it difficult for conventional non-OPEC production to offset its base decline rate.
The world is still extremely dependent on conventional non-OPEC production, so any sharp decline would have a huge impact on global balances. Over the last six months, we believe we have seen the beginning of such a decline. According to the IEA, non-OPEC production outside of the U.S. and Russia peaked in June 2018 at 32.8 mm b/d and has since declined by 800,000 b/d. (Russia did boost production in 2018 but has since announced that they will curtail supply and so is not a likely source of growth in the near-term.)
This decline rate is five times more severe than the average over the last eight years and comes at precisely the same time as surging demand. Despite the importance of slowing conventional non-OPEC supply, we have not seen many reports referencing it. One of the only executives we have heard sound the alarm is Schlumberger’s CEO, Paul Kibsgaard, who confirmed in his most recent quarterly conference call that non-OPEC production outside of the U.S. was slowing dramatically.
Hey, *OPEC peaked in 2016. If Non-OPEC is peaking then the world is peaking.
*Less Iran and Venezuela. Iran will likely be back up to normal in two years if Trump goes out next year. Venezuela will likely take a decade or more.
Ron,
Using EIA data I found the trailing twelve month average (TTMA) of non-OPEC minus tight oil, see chart below.
Since 2009 this has fluctuated a lot, recently (since mid 2018) it has been rising.
Looking at past 5 years, the trend is down at an annual rate of 89 kb/d. Over the same period the trend for tight oil output was an increase of 644 kb/d. Net increase in non-OPEC output over the past 5 years was 555 kb/d.
Okay, what are you implying? And what about the last paragraph of the article?
Conventional non-OPEC production represents 35% of global oil supply and is now facing substantial challenges after decades of lackluster exploration success. We have warned about this for many years and it is now coming through in the data.
Would you argue with that statement?
Note: Conventional non-OPEC production does not include Canadian tar sands.
Ron,
I know conventional doesn’t include oil sands, but it is too much work to put together monthly data for that, I have the monthly tight oil data and that is what has been increasing strongly of late.
Yes there has not been a lot of investment lately in conventional, but it continues to increase anyway. Chart below uses CAPP estimates for oil sands (annual data) and EIA non-OPEC and tight oil annual data. Feel free to put together a monthly Canadian oil sands estimate.
Conventional output rose strongly in 2018 and than fell rapidly when prices crashed, this happens repeatedly, it is nothing new.
A mistake was made in the chart above, correct chart below from 2010 to 2018. Average annual decline in non-OPEC conventional from 2010 to 2018 was 106 kb/d.
Canadian Association of Petroleum Producer estimates for Canadian oil sands combined with EIA non-OPEC and tight oil data.
The average annual rate of increase in non-OPEC unconventional C+C output (tight oil and Canadian Oil sands) was 832 kb/d from 2010 to 2018.
Far from clear that an acceleration of the non-OPEC conventional decline rate is imminent.
Ron,
The implication is that TTMA has been increasing, chart below shows volatility of monthly data for non-OPEC minus tight oil, I am not going to put together monthly Canadian oil sands data, but feel free to do it if you wish.
Dennis, I think, referring to the article Ron quoted, it’s not just Canada’s oil sands, it’s also Russia and GOM/Brazilian deepsea. It’s quite a lot of oil from recently growing countries. Your graphs will look very different, once theses quantities are being subtracted: I would guess, referring to your last graph, that rather than a downward trend of 0,5 mb/d it would be 2 mb/d over the last 5 years.
The peak of conventional oil (in this case with Russia included of course) is a big story. There has been an undulating conventional plateau since 2005. If conventional goes south in 2019, this means this plateau existed for 14 years: In an idealized and smoothed curve, the peak would be in the middle around 2012 which would somehow revalidate Hubbard and all those peak-oilers. Before the fracking boom, the discussion about peak oil was exclusively about conventional and the peak was broadly predicted in a window from 2008-2012.
westtexasfanclub,
The chart is non-OPEC minis US tight oil, so Brazil, Russia and all non-OPEC offshore output is included. It shows historical data, this the claim that there has been a sharp decline only applies to the typical volatility in output seen for the past 5 years.
As to the future, my crystal ball is in need of repair, so I do not know. In that situation I use the 5 year historical trend as a best guess. YMMV.
I agree conventional oil has been on a bumpy plateau since perhaps 2005, in my view 2019 is another bump in a plateau that will continue until 2025 or so. That would put the peak at 2015 if we use the halfway point for conventional. The amount of tight oil was unexpected in 2008.
Yes Dennis, considering the sheer size of world production, the bumpy plateau could easily extend for two decades.
Even the conventional peak of the US in 1970 was surrounded or better followed by some kind of a 15 year long plateau (ending with the Alaska production peak).
But IF Saudi Arabia really is in deep trouble, I doubt the rest of the world will be able to compensate that with conventional production (I remember the Oildrum-saying “As goes Saudi Arabia, so goes the world”). Unconventional might be another story, though.
Westtexasfanclup,
Not clear whether KSA output will decline any time soon, very little clarity there. In my view output is being restricted to boost oil prices, but that is a guess.
Yes, in my opinion, too.
They can even temporary decline in their output capacity without any consequences.
No reason to drill new infills now, install more flooding now … if you plan to reduce pumping the year anyway.
“Spare capacity” by Saudi ways is defined with 3 months lead time anyways. They need this time to do more drilling.
(And a deep oil storage with 100 million barrels can simulate spare capacity, too).
Can we infer the actual state of Saudi reserves by deconstructing the content of their All Liquids reports.? For example, if they did have the quality reserves that SA claims, why would they have such a large fraction of lower-energy content?
Like this for Qatar
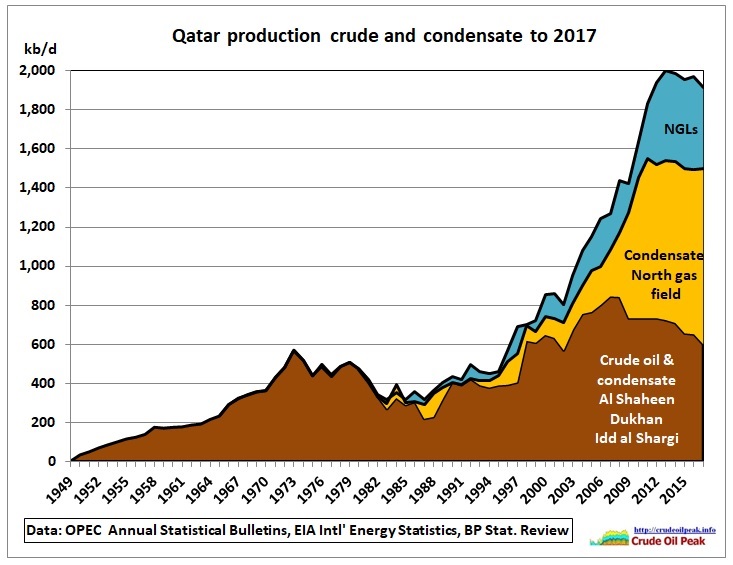
Paul,
I think Qatar produces a lot of natural gas, so they would have high condensate and NGL output relative to the average OPEC producer.
Ron
OPEC did not Peak in 2016, as in “PEAK OIL”. OPEC has been responding to the large increase in US oil production since 2017. In 2016 US production was 8.5 million barrels per day, now it is 12.5. OPEC has been reducing output in response. Even with falling production in Venezuela and sanctions in Iran, OPEC had to get Russia on board to make cuts.
OPEC has over 2 million barrels of spare capacity as a result of scaling back output. AS US growth tapers off, OPEC spare capacity will start to be used up.
I think peak oil will be at the early end of Dennis’ prediction, I cannot see it being as late as 2027.
> In 2016 US production was 8.5 million barrels per day, now it is 12.5.
Total volume is the modern way for agencies to misinform public 😉 .
What share of the USA production is condensate? That’s the key question.
In comparison with heavy oil you can probably divide this volume by 1.3 or higher. They do not have enough fractions to produce kerosene of diesel.
That actually is also a problem with “artificial” WTI obtained by blending which refineries hate.
Hugo, OPEC has always had spare capacity, regardless of its production situation. This is not due to scaling back their output. The only country that reduced its production dramatically was Saudi Arabia and it didn’t look like a totally voluntary decision, to say the least.
OPEC has always had spare capacity, regardless of its production situation.
Really now? Do you seriously believe that? If so, ho much spare capacity and who had it?
Well Ron, I fact I can’t tell if they HAD spare capacity. But I can affirm that they ALWAYS CLAIMED TO HAVE it 😉
Yes, and they have always claimed that they have gargantuan oil reserves. Right now they are claiming 1,189.8 billion barrels of proven reserves, 79.4% of the world total. And those reserves have always increased, almost every year. Regardless of how much they produce, their reserves never decrease. They only increase.
They lie! Hell, I thought you knew that. 😉
Note: OPEC did decrease their reserves slightly when Qatar left OPEC. Qatar claimed 25.2 billion barrels of reserves. So OPEC reserves dropped by that amount when Qatar left. And they had to add Qatar’s reserves to Non-OPEC reserves. When Qatar was a member, OPEC claimed 81% of world oil reserves and gave Non-OPEC 19%.
Hugo, in November 2016 OPEC produced 33,374,000 barrels per day. In October they produced 5,000,000 barrels per day less than that amount. No, I do not know that November 2016 was their all-time peak. And you do not know that it was not!
I often put “so far” after explaining past peaks. And I just assumed it was implied this time. But it is always implied unless I specifically state that I believe it was an all-time high.
OPEC’s 12-month trailing average, is today, below where it stood in 2005. It is my opinion that OPEC will not be a positive factor in future world production growth but an impediment to it. Of course that is just my opinion, for what it’s worth.
In October 2018, every OPEC member made heroic efforts at maximum production, positioning themselves for quotas. Nevertheless, their combined production was then, over one million barrels per day below their production numbers of November 2016. At that point, no OPEC nation had any spare capacity. In fact, everyone was producing well above their long term actual production capacity. Even today, every nation except Saudi Arabia is producing at maximum capacity. Of course, Nigeria, Libya, Iran, and Venezuela are all having political problems. They could all produce more if peace broke out and sanctions disappeared. Well, Libya couldn’t produce very much more. But there is every indication that turmoil will persist in those areas for decades to come.
One more point. OPEC spare capacity is a joke. They have, in the past, deliberately cut production. But for the majority of the time, every OPEC nation has produced at the very limits of their capability.
Hugo, you reserve the right continue to lecture me on OPEC and their production capacity. And I reserve the right to tell you that you are full of shit.
Ron
There is only one person here full of shit and everyone knows who it is.
https://oilprice.com/Energy/Crude-Oil/Why-Peak-Oil-Is-Finally-Here.html
I can see why you are so frustrated, being wrong year after year.
I explained that your argument above was a crock of shit. You replied: “You annoden!”. Exactly what could be expected from a 12-year-old schoolyard blowhard.
I think Ron is essentially right year-after-year, but what’s counteracting that is that the accounting is getting more creative year-after-year as well. You only have to deconstruct the “all liquids” calculation to see what is happening.
Now OPEC is going green. The struggling Kuwait will be no more ‘struggling’. Sands on castle are so beautiful, in a way. The power of phantasy powered by the power of numbers.
https://oilprice.com/Latest-Energy-News/World-News/The-First-OPEC-Member-To-Cut-Oil-Targets-Over-Climate-Concerns.html
Quote (Ron): “*Less Iran and Venezuela. Iran will likely be back up to normal in two years if Trump goes out next year. Venezuela will likely take a decade or more.”
IMO: Too optimistic regarding Trump. Too pessimistic regarding Venezuela (any news about that rumor that Rosneft will take control of PDVSA?).
https://www.forbes.com/sites/arielcohen/2019/10/22/russia-attempts-to-take-over-venezuelan-oil-creating-a-challenge-for-the-us/#7d8aaba38efd
Hello Stephen. Good article, with many “ifs”, though. But a very complete summary. My guess is that they’re waiting for how the impeachment or even the next elections are playing out. I don’t think they want to fuel Trump’s rhetorics and retaliative politics right now.
Ron
I am having some difficulty verifying what is in this article. I have an IEA database that has quarterly and monthly data while it does show a peak the numbers are quite different. In the attached chart, the peak of Non-OPEC excluding Russia and the US is in the fourth quarter od 2014. Then a steady decline sets in for the seasonal peaks till January 2019. The straight line fit of the peaks shows a steady decline of 20.37 kb/d/mth or close to 250 kb/d/yr. The article states “non-OPEC crude production had declined by 175,000 b/d on average each year between 2010 and 2018”. The decline rate shown in the chart is for Non-OPEC excluding Russia and US.
Ovi
IEA data is all liquids generally Ron and I prefer to focus on C+C, best data is from EIA. Check international data at EIA website.
Dennis
The post began with the following” “According to the IEA, non-OPEC production outside of the U.S. and Russia peaked in June 2018 at 32.8 mm b/d and has since declined by 800,000 b/d.” Since the were quoting the IEA, I thought that the IEA would be using their own data. However, maybe they weren’t.
Ovi,
Good point, my point is simply that I think the all liquids data is useless so I ignore IEA “oil” output data as there is much in that data that is non-oil,
much of it is “liquid” only if pressurized, at minimum we should only consider energy that is liquid at standard temperature and pressure (say 1 atmosphere and 25 C). Also why fit to the peaks rather than just all the data?
For EIA C+C data, non-OPEC minus Russia and US has decreased at an annual trend of 60 kb/d for the past decade, if we consider non-OPEC minus Russia, US, Brazil, and Canada the annual rate of decrease over the past decade is 320 kb/d.
The four nation group of US, Canada, Brazil, and Russia have seen an annual increase in C+C output of 1068 kb/d over the past decade. World C+C output over the past decade has increased at an annual rate of 1020 kb/d.
For the past 10 years annual rates of increase in C+C output were:
non-OPEC=747 kk/d
US=673 kb/d
Canada=182 kb/d
Russia=134 kb/d
Brazil=79 kb/d
US+Brazil= 752 kb/d, is roughly is equal to non-OPEC increase, while Canada and Russia(316 kb/d) roughly offset the decrease from all other non-OPEC nations besides this group of 4 nations.
A bit out of control.
Saudi Reserves: No conspiracy going on. Too big a conspiracy to keep secret. More likely, much as is true with elsewhere, the Reserves number changes with changes in price, changes in technology and hell, changes in the definition of what liquid is “oil” and what liquid is not oil. You can get an increase in Reserves without drilling a single exploratory well. What you generally don’t get is a decrease in Reserves — even if you pump it out and ship it (KSA), or even if the price falls. In the US, at least, a fall in price will generate a new ruling from the SEC on what price to use in computing reserves. KSA discovers new oil at the rate they pump it, just by changing a parameter in the calculation here and there.
Not a conspiracy. Just obfuscation.
As for political issues inside countries affecting output, this has always been so. The US prohibited export for many years. Production was low and getting lower. It has increased and rather than keep it in the ground for the grandchildren, the export ban was lifted and so “output” has increased, where output means export — even when importing on a net basis.
Libya and Venezuela . . . are keeping it in the ground for the grandchildren, whether they want to or not. We can say there will always be places with upheaval, but we might also want to consider that the grandchildren will always be out there and maybe thought about. Norway is getting pretty close to this perspective. They’ll be able to hide behind green this and green that, but their SWF is enormous and can fund food imports, and they somewhat have no need to pump at their present rate. They could reduce oil production to domestic consumption and keep the rest for the grandchildren. Population will grow and require more oil, but far less for decades than they pump and export now. Certainly would affect Peak.
The definition of oil is a big deal, too. Crude vs condensate is defining the API number upwards. You can find lots of articles quoting 45 as the delimeter, but more recent articles . . . 50. Easy way to increase crude production. Just declare condensate to be crude.
Saudi Reserves: No conspiracy going on. Too big a conspiracy to keep secret.
Watcher, of course, it is no conspiracy. A conspiracy is something that must be kept a secret, and people only think it may be a conspiracy. OPEC reserves is an open out and out lie. What is surprising is that even many in the oil industry buy into this nonsense. However, people who have lived in any Arab society know exactly what is going on. It’s just their way of life. (I lived in Saudi Arabia for five years.) They exaggerate wildly. And they expect you to know they are exaggerating.
Reserves number changes with changes in price, changes in technology and hell, changes in the definition of what liquid is “oil” and what liquid is not oil.
OPEC reserves only change in one direction, up. For every barrel they produce, it is replaced, always with at least one barrel but often with more than one barrel. Their reserves only increase.
NO, it is no conspiracy. It’s just what they do. Here is a book I was issued when I first went to Saudi Arabia in 1980. My first job in Saudi was with a contractor. I joined ARAMCO after I was there for two years. ARAMCO would never have issued me this book even though most contractors do. Or at least they did in 1980.
The Arab Mind
Originally published in 1976, revised edition in 1983 and many times since.
It’s known in wastern society, too – in marketing.
It’s like claims of a startup looking for an investor.
They have biotechnolocial tool to defeat cancer, with just 1 box of pills.
Later on, when they are really successful, they improve survival rates of one kind of cancer by 3%…
Or more to energy tech – battery startups and their wonder batteries, coming in just a few years (Fisker ….). Lot’s of smoke, little fire.
Politically, Norway is a kind of UK protectorate, UK supported Norway independence from Sweden.
Norway is a small country which has to go either with UK, or Sweden, or Russia. Neither of those countries would like Norway to stop pumping oil.
Anyway, since Norway gas/oil installations are offshore, they would be easy to board and take over.
A small Norway could then do what? Essentially nothing. Anyway, are Norwegians ready to die for oil? They do not seem to think seriously about defence, their army is very small ( circa 8000 men and women), which confirms that they are, in fact, a protectorate and thus outsorced their defence to their protector.
https://en.wikipedia.org/wiki/Norwegian_Army
Maybe that was even taken into account during the recent Johann S. development, since the field is powered by a power line from the land, a pretty unique solution (could be a precaution to make a hostile take over harder).
However, Norway somehow stopped talking about the development of another Johann, Castberg.
Maybe that’s their nest egg.
The Norwegian parliament also voted against further oil/gas exploration which could be interpreted as ‘we don’t want to know about it, so you don’t make us to use it’.
That was pretty provocative. I have no comment to this, but I answered one of your posts further below.
I see the shale oil growth in 2020 is exspected to grow by 600kbpd -1300kbpd based on WTI 55 usd. Growth in 2019 seems to be 3% , seems there is not enough space in Permian…
https://www.google.com/amp/s/www.bloomberg.com/amp/news/articles/2019-10-14/peak-shale-how-u-s-oil-output-went-from-explosive-to-sluggish
Freddy,
That article conflates US output with tight oil output, tight oil output has grown by 557 kb/d from Dec 2018 to Sept 2019, a slower rate of growth than in 2018 (the growth was 1280 kb/d over a similar period in 2018), but claims of no growth are spurious.
The claims that they are running out of space are also incorrect, companies tried closer spacing to see how it worked out, and it did not go well. They will simply space wells appropriately based on what they have learned.
Those who believed the hype in investor presentations were disappointed, those like me who view those presentations with considerable skepticism were not surprised one bit.
Ron – look at consumption level, not production level. When consumption falls for more than one year, then we will be post peak oil.
If consumption falls for more than one year it will be because production has fallen for more than one year.
World recession? No money, no fuel.. US dollar still world reserve currency, people may eat…
no need to insert the word ‘expecting’
Christ lam blessed you…
HOUSTON (Reuters) – Occidental Petroleum Corp said on Monday it would slash spending on big projects by 40% next year, as it missed earnings estimates in its first results after closing its $38 billion purchase of rival Anadarko Petroleum.
In the Permian Basin, the top U.S. shale field, spending will drop by half to $2.2 billion, and by a third in Colorado’s shale fields.
https://www.reuters.com/article/us-occidental-results/occidental-to-slash-spending-after-swinging-to-loss-idUSKBN1XE28U
The goes the Permian growth. Slashing expenses by 50% means slight decline in output.
The small producers are cash strapped, too – only Exxon left to increase producing no matter the costs.
NY Times thinks a flood of oil is coming over the next two years –
https://www.nytimes.com/2019/11/03/business/energy-environment/oil-supply.html
First sentence I read:
“A Norwegian oil platform in the North Sea. Norway’s production has declined for two decades, but its development of the Johan Sverdrup deepwater field should reverse the trend.”
And a little further in the article:
“Norway’s rebound from 19 years of decline began a few weeks ago as Equinor began production in its Johan Sverdrup deepwater field. The field will eventually produce 440,000 barrels a day, increasing the country’s output from 1.3 million barrels a day to 1.6 million next year and 1.8 million in 2021.”
Well, I would disagree.
First, Norway production was not in decline between 2014 and 2016. Production declined again since, and Johan Sverdrup is more than welcome to reverse the trend. So, no 19 years of continous decline.
Second, Johan Sverdrup is already producing 200 kb/d and is set to reach 440 kb/d in the summer of 2020, so not much increase in 2021. A second phase is planned in 2022 to increase production to more than 600 kb/d. It’s a remarkable field, and just from it, production would increase to 1.9 Mb/d in 2022… If we don’t take account of the depletion of older fields. And this is where the analysis is flawed IMHO. Several fields are in the end of their life in Norway.
The article talk about other countries, Brazil, Canada and Guyana (France). Sure, expectations are high. And indeed, we could see another glut… Depending on what happens elsewhere, and if these expectations are fulfilled.
It’s basically not possible to predict production with just new fields analysis. You have to analyse older fields and how high and how long they can last. KSA added a lot of new production in the 2010’s, but this was balance with the decline of older fields.
“If we don’t take account of the depletion of older fields. And this is where the analysis is flawed IMHO. Several fields are in the end of their life in Norway.”
Agree. Just to list new fields while the rapidly increasing decline rates everywhere are being ignored is not very informative. And since it is from the US you have to look for the agenda behind the article. It is difficult to get reliable information these days; the oil market does not function efficiently without it. But the cloud that is created to keep up the business as usual and to not face the real problems ahead is bound to break; I would say next year. And then the theme of this blog will be far more popular.
Any guesses on what cards Iran will play next year to mess with Trump’s reelection bid? Essentially got away with Saudi attacks in September and earlier on the oil tanker.
OPEC lowers forecast for oil demand growth, says its own market share is dwindling
In its closely-watched annual World Oil Outlook (WOO), the Middle East-dominated producer group said Tuesday that the last 12 months had been “challenging” for energy markets once again.
OPEC has lowered its outlook numbers for global oil demand growth, to 104.8 million barrels per day (b/d) by 2024, and 110.6 million b/d by 2040.
“At the global level, growth is forecast to slow from a level of 1.4 million b/d in 2018 to around 0.5 million b/d towards the end of the next decade,” OPEC said in the report.
How many casual readers will understand that this article is saying that the world needs to increase its oil production rate by 1 Mb/d for each of the next five years.
ExxonMobil and ConocoPhillips U.S Upstream Earnings Another Disaster Q3 2019
After the long-awaited Q3 results finally came out, I wasn’t disappointed.
Exxon reported Q3 2019 U.S. Upstream Earnings of $37 million on $3 billion in CAPEX spending.
Conoco reported Q3 2019 U.S. Upstream Earnings of $35 million on $843 million in CAPEX spending.
Combined, Exxon & Conoco invested $3.8 billion CAPEX in U.S. Upstream Q3 2019 to earn $72 million in Earnings. Looks like they are heading in the wrong direction.
Shale is killing Exxon and Conoco’s U.S. Upstream Business Model.
Steve
Peak Oil Review 4 November 2019
The downturn in shale drilling has been so steep and fast that oilfield companies are taking the unprecedented step of scrapping entire fleets of fracking equipment. With almost half of US fracking machinery expected to be sitting idle within weeks, shale drillers are retiring truck-mounted pumping units and other equipment used to fracture shale rock. In previous market slumps, frackers parked unused equipment to await a revival in demand; This time it’s different, gear is being stripped down for parts or sold for scrap.
Ron,
Indeed. Furthermore, according to Shaleprofile, from Jan-July (excluding revisions), the shale industry completed another 6,000+ wells to increase overall shale production by 150,000 bopd. However, those 6,000+ wells brought on 2.62 million bopd in 2019.
Thus, 94% of 2019 new shale production went to offset declines.
At some point, WISDOM will come back to BITE HARD. Unfortunately, investors will be holding the bag.
Steve
When 94% of new shale production is needed to prevent shale oil production in US to decline it seems obvious capital spending is growing to get same cash flow from operations as bills could be payed. Without significant increase in oil price or new fresh capital from banks, investors decline in production will continue…
People forget that as completion rate decreases the magnitude (aka absolute value) of the legacy production change also decreases. If oil price remains low the completion rate will decrease. To verify this fact see the legacy production change in 2015 to 2017.
Steve,
If you select only the major tight oil basins, Bakken, Permian, Eagle Ford, and Niobrara, the oil ouput is nearly the same but the number of wells completed in 2019 drops to 5260.
Probably a better number to use when discussing tight oil.
Dennis,
So, are you saying that the 5,260 wells added in 2019 in those four shale fields, just kept production flat?? If I am following you correctly, then that is indeed a very BAD SIGN.
Assuming a conservative $7 million a pop for those 5,260 wells, that equals roughly $37 billion in CAPEX just to keep production from falling.
Of course, the Shale Industry will solve this problem by drilling 5-mile laterals, 30K wellheads, oceans of fracking water, and getting the Good Lord Almighty To add more land so they can add more acreage.
EASY-PEASY.
Steve
Steve,
Tight oil output has increased though the rate of increase has slowed. That is a good thing as the market is currently over supplied with oil.
Higher oil prices would be a good thing for the industry.
Steve.
Add to that CHK’s going concern statement in the 10Q and you have quite a statement on how shale works at sub $60 WTI and sub $3 HH.
Shallow…. LMAO.
These folks running the Investor Relations Depts at the Shale Companies are the modern-day “SNAKE OIL SALESMEN.”
Here is my newest article on the FIASCO taking place at ExxonMobil:
https://srsroccoreport.com/trouble-at-mighty-exxonmobil-adds-record-number-of-shale-wells-in-the-permian-while-production-plateaus/
Exxon’s Permian oil Production 2019 virtually flat while Natgas production increases toward the heavens.
Steve
Shallow,
WAIT A COTTON-PICKEN minute. I just looked at CHK Q3 2019 10-Q. Oh my Gosh, what a Fricken Disaster.
CHK borrowed $8.8 billion from its Revolving Credit Facility Q1-Q3 2019 and paid back $7.5 billion.
Do you know what this means??? LOL. The poor slobs running the show at CHK have to borrow on JAN 1st to fund business that quarter. When CHK receives the revenues, they pay it back on MAR 31st. Rinse and Repeat each quarter.
This means, CHK likely has $6-7 billion of additional debt, not included because they continually borrow to fund business.
What a complete mess.
Steve
Fracking pioneer Chesapeake Energy is drowning in debt
https://www.cnn.com/2019/11/05/investing/chesapeake-energy-debt-going-concern-natural-gas/index.html
Shallow sand,
For the average 2017 Permian basin well, I get breakeven at $55/bo at the wellhead assuming a wellhead natural gas price of $1.50/MCF with a 10% annual discount rate, annual inflation rate of 2.5%, and a $10.4 million well cost (including plugging at end of life and facilities + land cost), average LOE over the life of the well is $13/bo, royalties and taxes assumed to be 28.5%.
The majors may pick up the better pieces of poorly performing independents.
At some point if output increases slowly (or not at all), we are likely to see oil prices rise, date unknown.
I think the wild card in all this is EV development. **If** some of the developers can actually increase battery energy density by factors of 8 to 10 using more abundant elements, EV sales could really take off. A factor of 10 would up the range of a Tesla Model 3 to over 3,000 miles; coast to coast on one charge. This would also coincide with the apparent peaking of liquid oil supply as shown by Exxon Mobil in a graph in their annual “View to 2040”.
Even an improvement factor of 1.5 for batteries (in weight, cycle life, energy density or cost) would likely be enough to be a massive game changer in global oil demand. It would take a solid 10-20 years to play out. The transition period would/will be filled great disruption, opportunity, and great risk.
Hint:
Lithium ion are still the mainstay.
They were first commercialized in the early 1990’s.
I’m waiting—-
Hightrekker,
When was the internal combestion engine first commercialized?
Dennis—
It has been a while, with no new technology coming online.
This is a major bottleneck.
Yeah, the thing that matters is cost (with energy density a distinct 2nd), and the cost of li-ion batteries has been falling steadily.
Computer processors, hard drives and PV are similar: the current tech would be recognizable to an engineer of the 1970’s, and yet their costs have fallen dramatically (by a factor of 100 for PV and a much higher factor for processors and drives), and that has made all the difference.
Oil revenues are much bigger than gas revenues in Russia:
https://www.researchgate.net/figure/The-Role-of-the-Energy-Sector-in-Russian-GDP-Export-and-Budget-Revenues-in_fig1_333844509
Gas contracts seem to have mainly a political function in Russia.
What will happen after 2022 when Russian oil production is to set in decline…?
Well everyone have to adapt. I still think natural gas is more aboundant than oil going forward and that either electricity generation from it or a vibrant LNG market is very useful. Shipping can in principle use LNG as fuel. The world is changing rapidly. Who would have believed Turkey and Iran would pursue hydro electricity at a rapid rate in an arid region.
In Norway the very stable nature of hydro electricity allows to adjust for a bit of wind power to be added into the mix. Wind power is unpopular, unstable when it comes to output, and is meeting headwinds in Norway now. So the mixture of hydro and wind power is ok with hydro power being dominant. Hydro could adjust due to magazine capacity and overbuilt turbine capacity. 80%/20% is very comfortable, and could work. Sweden is having the same issue more profound. Very costly to overbuild turbine capacity and throughput rate in hydro and at the same time build enough transmission lines to the south of Sweden.
OPEC Braces For Drastic Drop In Oil Demand
OPEC admitted that demand for its oil over the next few years could be drastically weaker than it previously thought, due to a combination of a weakening economy, rising supply elsewhere, and pressure from climate activists.
What they’re probably trying to say is that OPEC production is going to drop in the next few years.
The new IHS Markit outlook for oil market fundamentals for 2019-2021 expects total U.S. production growth to be 440,000 barrels per day (b/d) in 2020 before essentially flattening out in 2021.
Going from nearly 2 million barrels per day annual growth in 2018, an all-time global record, to essentially no growth by 2021 makes it pretty clear that this is a new era of moderation for shale producers, said LeBlanc. This is a dramatic shift after several years where annual growth of more than one million barrels per day was the norm.
https://www.globalbankingandfinance.com/category/news/u-s-oil-production-growth-heading-for-a-major-slowdown-as-capital-discipline-and-weak-prices-play-out-ihs-markit-says/
IHS original link
https://news.ihsmarkit.com/press-release/energy/us-oil-production-growth-heading-major-slowdown-capital-discipline-and-weak-pri
IHS says “flattening out in 2021” and “essentially no growth by 2021” – sounds like peak US oil production in 2021 without using the word peak.
Their estimate is based on $50/brl and they write “a $65 per barrel oil price would provide the ability to post strong volume growth while also providing meaningful returns to shareholders. The crucial tipping point for this new shale era appears to be oil prices somewhere near the mid-$50s—the point where it remains viable to have both some production growth and deliver shareholder returns”
Tony,
You left out some of the quote (the whole paragraph is below):
The new IHS Markit outlook for oil market fundamentals for 2019-2021 expects total U.S. production growth to be 440,000 barrels per day (b/d) in 2020 before essentially flattening out in 2021. Modest growth is expected to resume in 2022. But those volumes would still be in stark contrast to the boom levels of recent years, said Raoul LeBlanc, vice president for North American uncoventionals, IHS Markit.
They expect growth to resume in 2022, I doubt their forecast for oil prices at $50/b will be correct.
Eventually slowing US tight oil growth and discipline from OPEC will drain excess oil stocks, probably some time in 2020. When that occurs, oil prices are likely to rise due to demand growth outrunning supply growth, at that point supply will gradually start to increase in the tight oil plays up to roughly 2025, at that point the fall in tight oil output starting around 2025 may lead to rising oil prices up to $140/b by 2030 as the World struggles to try to maintain a plateau in C+C output over the 2025 to 2030 period, by 2031 it will be clear that this will not be possible, though a World depression around 2030 might put a dent in oil demand which might hide the peak. People will say output went down due to lack of demand, but regardless the peak in World C+C attained over the 2023-2027 period will not be matched in future years. Whether it is “peak supply” or “peak demand” matters not, peak oil is about “peak output of crude plus condensate”.
Equinor made new oil discovery near Fram platform in the North sea that might cobtain 100 mill barrels of oil. Since Exxon is share owner they now might get additional funds to fund new wells in Permian…
https://mobile.subseaworldnews.com/2019/11/06/new-oil-and-gas-discovery-for-equinor-near-fram-field/
A minor discovery. And there are more to come of minor discoveries in the North sea, the Norwegian sea and in the Barents sea. But the big fields are already discovered with a high probability, they were all located in a cluster in the North Sea. Johan Sverdup is the laggard in that regard. IEA is so hyped up about it that they even expect ramp up time to be fast tracked like no time before. So the offshore industry (at least local) will continue to struggle, the dependence on at least medium sized fields are there to justify costs unless close to existing infrastructure. Johan Castberg will still be commenced I think (500+ mb), but unsure if 2022 is the right timing. The exact same timing as second phase Johan Sverdrup is online. At some point you have to question planning. Is the point to get the oil up as fast as humanly possible or to plan for a plateau for a while? For offshore there is also the question of exploiting competence while it is there and infrastructure while it is there. Not the same on land for the low cost oil; there is more a choice to conserve and plan.
Latest forcast from Mark Papa…
the US Shale boom is ending. He forcast increase off 400k bpd in 2020 and the decline in US shale might be more dramatical than he first have tought. But Exxon and Chevron still planning to invest billions of dollars in US shale or perhaps they end up with it was the wurst investment they have made in their history and they get stuck…
https://www.rigzone.com/news/wire/shale_oil_pioneers_say_the_boom_is_ending-06-nov-2019-160255-article/
Papa downgraded his 2020 shale growth forecast to 400,000 barrels a day from the 700,000 estimate he discussed in early September.
400 kbd growth in 2020 is the lowest yet
According to this article ” Beyond 2020
Papa downgraded his 2020 shale growth forecast to 400,000 barrels a day from the 700,000 estimate he discussed in early September.”
https://oilprice.com/Energy/Energy-General/The-Drilling-Frenzy-Is-Over-For-US-Shale.html
From your link:
Echoing Sheffield’s comments, Mark Papa said that this wasn’t only due to spending cuts. “Most people will ascribe the low U.S. growth to capital discipline. But I think the larger reason is what I’ve been talking about for several years the shift to Tier 2 and 3 drilling locations in all shale plays and increasing parent-child issues in the Permian,” Papa said.
He added that this is not a temporary problem. “I believe U.S. shale production on a year-over-year growth basis will be considerably less powerful in 2021 in later years than most people currently expect,” Papa said. “I’ll leave it to others to opine on what this means for global oil markets.”
Brazil Oil Auction a ‘Total Disaster’ as Bidders Stay Away
(Bloomberg) — Brazil’s largest-ever auction of oil deposits flopped, sending the real tumbling, after state-controlled Petroleo Brasileiro SA did most of the bidding while other major oil companies stayed away.
I think this will reflect on Aramco’s IPO. Oil investors are sitting on their money. I’m betting it will be a big flop.
“With the U.S. benchmark for oil expected to stay in the $50 per barrel range well into 2021, IHS Markit forecasts capital spending for shale drilling and completions to fall by 10 percent to $102 billion this year, another 12 percent to $90 billion in 2020 and by 8 percent to about $83 billion in 2021 — a nearly $20 billion decline in annual spending over just three years.”
This is a big decline in capital spending which means less production from new wells.
https://www.houstonchronicle.com/business/energy/article/U-S-shale-growth-will-plateau-in-2021-Report-14815691.php
I think this is worse – I guess ( my crystal ball is still foggy ) a decline in US oil next year.
Rig count is still dripping like a rock, and there is a 4 month delay between drilling and completing. Some big shale companies have slashed spending by 50% next year – this isn’t even flat. And the smal companies on bad acres should run dry soon, with credit dried up.
And you don’t buy newer and more efficient rigs in this situation, when you can get a somewhat slower, but written off one for scrap value. Or have to calculate your new rig won’t get the drill jobs to pay the credit. So I think very few newer rigs now, some for trucks, pumps. Only replacing broken down or very outdated equipment.
The big 2 can continue as they want with their deep pockets, but at the moment they are only 10% of shale.
I’m no crash prophete – with falling I mean a few 100 kbd from the current very high level.
US July shale oil production exceeds 7 mbd for first time, according to
https://shaleprofile.com/2019/11/04/us-update-through-july-2019/
Yeah, but look at the steepness of the falloff of the first graph!! Whatever starts to flow, doesn’t maintain flow for long and the time frame is getting shorter and shorter.
New posts up.
http://peakoilbarrel.com/eia-non-opec-oil-production-updated-to-july-2019/
and
http://peakoilbarrel.com/open-thread-non-petroleum-november-7-2019/
Thank you Ovi.
October RRC data for Texas completions are out – 537 oil completions means significant underperformance of last years 987 record, even if we are unsure about the exact “reporting” to “real completion date” behaviour, the October/November numbers from last year seem to reproduce the Iran high price hype taking place in that time…
However, year to date we’re now at 81% of last years completion numbers.