An interesting analysis was recently published by BNP Paribas (one of the top 10 banks in the World by assets) entitled Wells, Wires, and Wheels… . In that analysis they argue that long term oil prices will fall to $20/b or less in order for oil used for personal land transport to compete with EVs powered by wind and solar at current cost levels.
I reworked my oil price assumptions, first with a simple scenario that follows the EIA’s AEO 2018 reference oil price scenario up to $70/b in 2017$ and then remains at that level long term. Second I noticed that a scenario with such an oil price assumption sees tight oil output fall in 2022 so the scenario was revised with oil prices rising from 70 to 80 per barrel from 2022 to 2024 and then remaining at that level until 2028. The BNP Paribus analysis suggests that EVs will have cut significantly into oil demand by 2022 to 2025 so I assume oil prices fall to $20/b over the next 10 years.
Scenarios below.
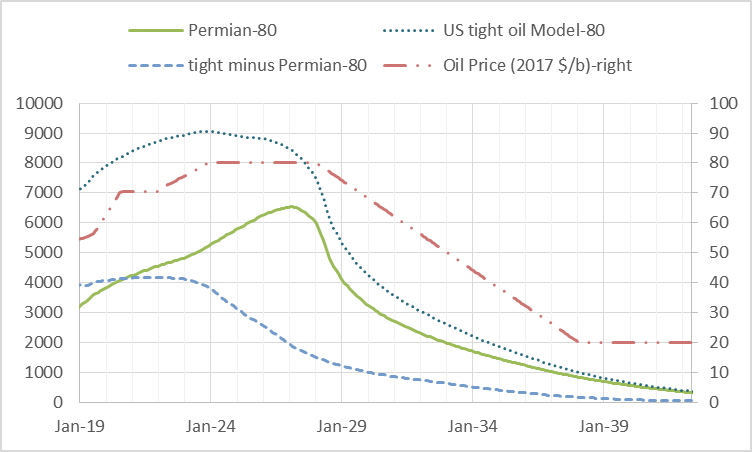
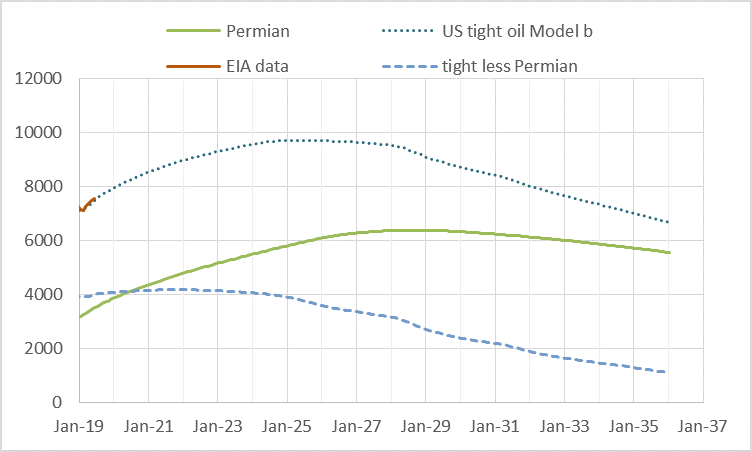
The chart shows US tight oil output as well as Permian output and US tight oil minus Permian tight oil, the oil price scenario with the maximum price of $80/b is shown on right hand vertical axis. URR for tight oil is about 53 Gb for this scenario from 2006 to 2052.
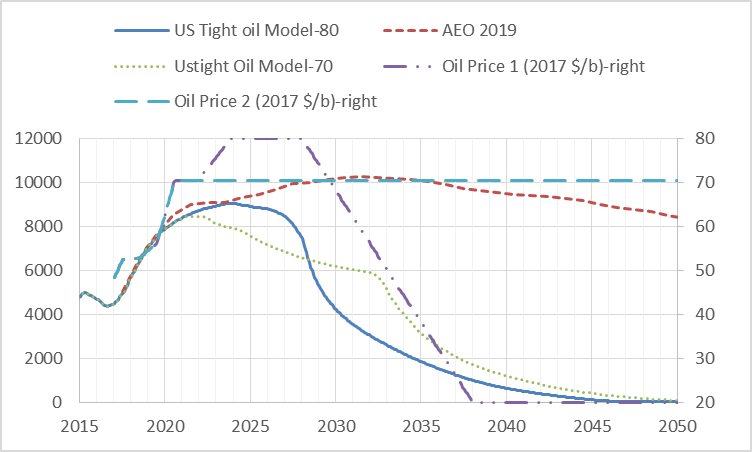
Chart above has EIA’s AEO 2019 scenario which assumes oil prices rise to $109/b by 2050, for such an oil price scenario the scenario is reasonable up to 2028, beyond 2030 it is highly unlikely that the scenario will be correct if the USGS mean TRR estimates for US tight oil are also correct. The scenario would be more in line with the USGS F5 TRR estimate which the professional geophysicists and geologists at the USGS believe has about a 5% probability of being realized. In short, the AEO 2019 tight oil reference scenario (especially after 2030), is highly unlikely.
The scenario with a maximum oil price of $70/b in 2017$ is below, oil price on right axis.
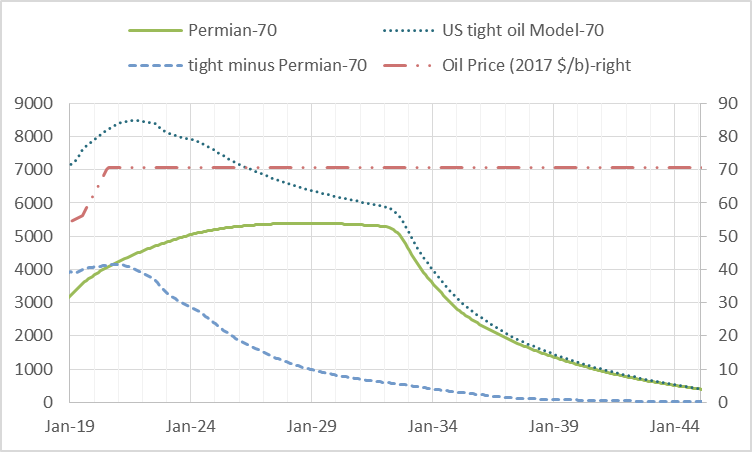
It is unclear how quickly the transition to EVs might be accomplished, the scenario with prices falling to $20/b by 2038 assumes autonomous vehicles reach the approval stage by 2028 which may lead to a rapid increase in miles of vehicle travel by EVs and a precipitous fall in miles travelled in ICEVs. In fact, it is probable that the scenario presented may be too conservative under that assumption, we might see oil prices fall to $20/b by 2033 rather than 2038 which would lead to a steeper decline in tight oil output.
Earlier scenarios presented below (from a previous post).
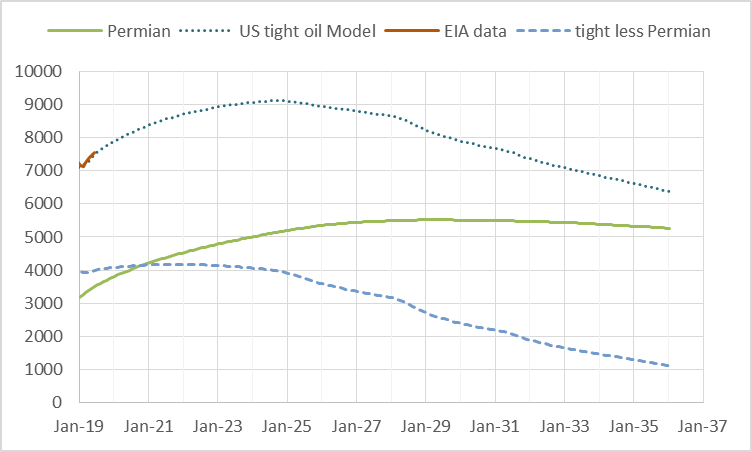
The above scenario uses a scenario with oil prices rising to $100/b (following AEO 2018 reference scenario) in 2017$ and assumes the completion rate is unchanged from the average completion rate in the first half of 2019 up until 2025.
The scenario above uses the same oil price assumption as the previous scenario, but the completion rate rises by 15% over a 66 month period (from 478 to 550 from July 2019 to Dec 2025) in the Permian basin with other tight oil basins unchanged from the previous scenario (where the completion rate was unchanged over that 5.5 year period).
Dennis
I think that BNP Paribas is to optimistic on the penetration of BEVs. (See below). I still think the road to BEVs is first thru PHEVs since their initial cost can be lower. Mind you, these will also reduce gasoline demand. I just read a piece at green car report, I think, where their survey said that most consumers would be happy with a 75 mile range for an around town car.
Clip from J. D. Power report.
Mobility Confidence Index is 55 for battery-electric vehicles: With an overall score of 55, consumers have a neutral level of confidence about the future of battery-electric vehicles. Attributes scoring lowest include likelihood of purchasing an electric vehicle (39); reliability of electric compared to gas-powered vehicles (49); and ability to stay within budget compared to gas, diesel or hybrid vehicles (55). Most consumers, regardless of age, believe there are positive environmental effects of electric vehicles.
Full speed ahead—for small market share: Both consumers and industry experts recognize it will be well over a decade before electric vehicles equal gas-powered vehicles in sales volume. Experts also predict it will be at least five years until battery-electric vehicles’ market share reaches 10%.
Full report at:
https://www.jdpower.com/business/press-releases/2019-mobility-confidence-index-study-fueled-surveymonkey-audience
Hi Ovi,
Best selling electric vehicle is the Model 3, this will be surpassed by the Model Y. The Chevy Volt was probably the best PHEV and was discontinued, not a lot cheaper than the Model 3. As I have suggested in the past, a car with an ICE and Battery system is complex, far more complex than a simple BEV. As BEVs reach scale they will be far cheaper than ICEV. Read the report, it is pretty clear the advantage goes to BEVs powered by wind and solar, a problem for both the oil and the natural gas industry as natural gas also will have difficulty competing with solar and wind. Coal is already more expensive than natural gas.
JD Power is kind of an entrenched cheerleader for the status quo. Plugin vehicle sales have been growing quite rapidly, quite a bit of this growth has been BEVs. In 2018 Plugin sales growth was about 64%. A fairly conservative scenario (with decelerating sales growth to 20% by 2030 has World sales of Plugin vehicles at 74 million per year by 2032 and cumulative sales of 371 million by 2032. By 2033 all new car sales are plugins, but it takes another 15 years for the entire fleet to become plugin vehicles. That scenario ignores the possibility of autonomous vehicles(AV), that replaces passenger vehicle miles far more rapidly because an AV will probably drive an average of 50,000 miles per year rather than 10,000. So it accelerates the process of eliminating ICEVs (miles driven by ICEVs) by a factor of 5. My scenario is quite conservative as it ignores AVs.
You are mixing several things here.
First, EV market share is not the same as fuel consumption. Since electricity is much cheaper than liquid fuel, EV sales will skew towards heavy fuel consumers like taxis, which we have already seen with hybrids. In general, EVs have high initial costs and lower operating costs, than ICEVs. Most cars are parked 90% of the time, burning no fuel. For those cars purchase price matters. For heavily used vehicles, operating costs matter.
Second, you are mixing market share with profitability. The latter drives investment and business model viability. For example, in America online retail is only about 10% of retail, but it is hammering retail chains anyway. Shopping malls are not closing because they can’t sell enough physical stuff, they are closing because they can’t make a profit. The net result may be a decline is the amount of physical stuff Americans buy. If you don’t buy online and your local Sears closes, you may end up buying less.
In the same way, the oil business relies on the belief that oil is reasonably priced. If EVs show consumers there is a cheaper alternative, they may be motivated to cut oil consumption. People don’t like getting ripped off. They want a fair price, and what that means is based on their own judgement. That is a personal (or herd) choice. For example, German houses are smaller and more sturdily built than American houses. Germans consider American houses flimsy, and Americans consider German houses cramped. There is no right and wrong here. If EVs persuade consumers that oil is too expensive, demand will fall, whether it “makes economic sense” or not.
Third, you are confusing general market sentiment with buying potential. You quote 39% as a low value for consumers likely to buy EVs. 39% of the car market is not a low value. It is an order of magnitude more than the EV industry can produce. The market is switching as fast as the product can be produced.
Also you are muddled about the meaning of customer surveys. Market sentiment is driven by herd instinct and advertising. As the number of EVs sold increases, the number of interested buyers will also increase. Consumers don’t actually care what kind of drive train their cars contain. If the industry tells them to buy EVs, they will, just like they bought cars with fins in the 50s and buy bloated pickups today.
Another huge problem for the car industry (and the oil industry in the long run) is autonomy. It sounds like science fiction to most people, but car companies are all betting on it. Autonomy means sales of cars will fall in the next decade, eroding the buffer of the ICEV fleet that protects the oil industry.
But more important, autonomy accelerates the move to EVs because current car design is so terrible. Cars used to be mechanical wonders with a little electricity. Now they are multiple electronic systems wrapped around a mechanical core. The slow death of the carburetor and belt driven components shows how this core is being eroded. The much talked about switch to 48 volt systems is designed to clean up a lot of the mess cars currently are.
When my tank is low, there is a special trigger that alerts my navigation system and suggests to me I look for a gas station. But my navigation system has no idea if I am signalling a left or right turn. Also cars have miles of redundant wiring because individual systems are controlled independently. Tesla is now planning to build hub and spoke wiring to allow semi autonomous zones in the car to control all the components contained there based on a single wire for energy and a single data channel to a central processor. This should greatly reduce complexity, weight and assembly costs.
Autonomous cars need complete control over the entire car. By far the easiest way to do this is by making the car completely electric, a computer on wheels, and removing mechanical devices where ever possible. They also reduce demand for human driven vehicles, which are mostly ICEVs.
Another huge problem for the car industry (and the oil industry in the long run) is autonomy. It sounds like science fiction to most people, but car companies are all betting on it. Autonomy means sales of cars will fall in the next decade, eroding the buffer of the ICEV fleet that protects the oil industry.
This episode of Know You Know, specifically addresses the fact that the legacy automakers are literally stuck in the past with their business model and don’t get that much sooner than they could possibly anticipate, they will no longer be selling cars because nobody will want to own them.
https://www.youtube.com/watch?v=RMfdYMpXcTc
The ‘Soon” Fallacy | In Depth
Thanks for the price/production charts Dennis. I can think of plenty of economic reasons why low oil prices may occur and persist in the future, and it’s interesting to see the impacts that it might have. I anticipate a GFC2, or worse, and from what I remember about the last one, not everybody was running out to buy a new $45,000 vehicle. Maybe if they’re good for sleeping in I suppose.
Taxis have certainly been the ones embracing EVs from what I can see. Otherwise I see very few EVs around.
Survivalist,
In this case, the low oil prices are due to alternatives to oil being cheaper than oil.
Of course GFC2 would also lead to lower demand for all goods including EVs and oil, I doubt a GFC2 will be permanent, recovery will be quick if the World does not respond in the manner chosen by the EU in response to GFC, if most nations choose no fiscal stimulus in response to GFC2, it will quickly become Great Depression 2 and recovery will take a decade or more. Keynes will be spinning in his grave.
If EVs and renewables scale up quickly then GFC2 may not occur until 2069.
Sometimes these things happen far more quickly than I anticipate. I am the guy who thought iphones were a dumb idea when first saw them, they would never be a big thing, so I tend to underestimate the speed with which technology can catch on.
You have made this comment before, about a Keynesian response saving the day from GFC2. What are we experiencing now if not Keynesian stimulus, with $1 Trillion plus annual deficits in the USA and negative interest rates across the seas. It makes one wonder what could be done to level up.
You’re talking about government debt. Republicans have brainwashed Americans to thinking it is the end of the world (when there is a Democrat in the White House), but really, although it is high, it could be dealt with by simply raising taxes, not to mention going to the effort of collecting them. Check out the recent history of Greece. Austerity works.
America has a much more serious problem, which is foreign debt. Both problems could be dealt with by adding a dollar or two of tax to gas at the pump.
Alimbiquated,
I strongly disagree, austerity does not work. It is the reason Europe did so badly after GFC. I do agree taxes should be collected, Greeks are notorious for not paying taxes. Serious fines or prison time for the wealthy who don’t pay might be one solution.
Perhaps you forgot the smiley face next to “austerity works” I often miss sarcasm in a post unless indicated.
As you point out below, it depends on who you are being austere to. what america needs now is massive tax increases to the rich combined with massive consumption taxes, for example for gas. The former would reduce government debt and the latter would reduce consumer debt by shifting outlays from consumption to investment in cost reducing investment. Reducing consumer debt is key to reducing foreign debt.
Alimbiquated,
I am thinking of fiscal policy more on the spending side rather than the revenue side. Generally higher government spending helps both rich and poor as in all boats rising with the tide.
I do agree that more progressive tax policy would be a good thing, but the rich hold power in the US as evidenced by our current president who has fooled the middle class into believing that he has their best interests at heart, he only is interested in Donald Trump’s interests.
You’d need to make that about $6 and even that would not reduce the debt, just stop adding more – then you have the issue of reducing consumption that reduces tax collected.
NAOM
NAOM,
The wealthy do not consume all their income like poor folks and the middle class. Raise taxes on the wealthy and consumption falls very little.
I was referring to the point about tax on fuel and, given the annual fuel consumption, that would be the approximate level to raise around $1T. That would hit the poor hard and the rich would just moan and carry on. Just taxing fuel won’t fix the problem, it needs changes right across the board so to poor do not bear the brunt of the problem while the rich stuff their pockets.
NAOM
Notanoilman,
Sorry I get it now. I think carbon taxes make sense but prefer a fee and dividend plan where all carbon taxes collected are refunded to each citizen equally. So it is revenue neutral and progressive. The way to raise taxes to reduce debt is to raise tax rates on income over 300k to 40% and income over 600k to 60%. Basically raise taxes on the wealthy enough to reduce deficits. Also eliminate all loopholes and treat dividends and capital gains the same as wage income and interest.
NAOM,
Agree fuel taxes would hot the poor if not done correctly. A tax and dividend plan would be revenue neutral and would tend to be progressive. All taxes collected returned to all citizens equally regardless of income. The rich tend to use more fuel on average, those poor and middle class folks that are smart enough to cut their fuel use will come out ahead. This policy would be combined with a highly progressive income tax that eliminates special treatment of dividends and capital gains and other special perks for the rich. All income from every source would be treated equally (wages, interest, dividends, capital gains, tax refunds, rents, royalties, and anything I haven’t thought of).
Duanex,
Deficits are a fiscal stimulus, in the US taxes should be higher to reduce deficits, preferably a progressive tax. The negative interest rates are a monetary stimulus, a far less effective policy which leads to poor allocation of scarce capital. Also note that a 1 trillion dollar deficit for an economy of 21 trillion is not a huge deal.
I hear often, that we could raise the tax level to take care of a particular problem, such as in this case debt.
Very true, but the same argument is used for too many issues. Debt, SS, Medicare (for all), Discretionary projects like infrastructure or military.
One such project is doable, more than one questionable.
Dangerous game to play.
Would you do it your personal families finance?
Perhaps if your future prospects were incredible.
Lets remember, these are the ‘good’ times, when the past debts of crisis should be retired, not accumulated.
Hickory,
I am suggesting paying down debt during good times, we could also cut spending as well as raise taxes as a compromise (Republicans like cutting spending and Democrats don’t, positions reversed on taxes).
Republicans like cutting spending! Oh, I get it you are being funny today. HA.
dclonghorn,
They claim to want to cut spending by government, certainly moreso than the average Democrat in my view.
I am a comedian, but only inadvertently.
Interesting: Attributes scoring lowest include:
*Likelihood of purchasing an electric vehicle (39);
In Europe and China ALL vehicles produced soon will be electric. So the likelihood of purchasing an electric vehicle in those huge markets (and the markets they feed to) becomes 100%.
In markets where some poor fools are still trying to sell fossils, with thousands of acres of used ones as well as new ones, who would by a Ford over its tecnhnically and economically superior electric equivalent. Look out when decent utility EVs arrive – that will be the final straw. Not only the Tesla Ute, but Rivian, Great Wall and a swarm of others are starting to enter the market – inducing both the lads on the farms and the ladies on the high street to take up an EV.
*Reliability of electric compared to gas-powered vehicles (49);
The engineering simplicity and ability for on-line upgrades of EVs ensures very good reliability compared to fossils. That low score comes out of the ignorance of the consumer (which ignorance, the fossil industry nourishes, of course.)
*Ability to stay within budget compared to gas, diesel or hybrid vehicles (55).
Why would EVs be worse than a fossil clunker. Thrown a cam belt lately – bang goes any budget!
So all these are just ignorant (some willfully so) responses.
The facts are much clearer, as the paper notes: EVs now make economic sense in most constituencies. Fossils don’t. Game over.
Rethinking Renewable Mandates
Tesla car erupts in flames after ‘autopilot failure’ in Moscow
When using autopilot you are supposed to pay attention, the feature is not perfect. It is adaptive cruise control and lane keep assist, nothing more.
Agree no subsidies are needed. EVs will quickly take over market for cars. They will be cheaper to own and operate.
Civilization is a ‘technology’ that is currently ‘crashing and burning’, so to speak, and that encompasses your ‘markets’, which encompasses your ‘electric carriage’.
If there is some kind of human aspect that that kind of technology, despite itself, lulls people into not paying proper attention, then it may prove to be useless and, of course, worse than useless.
Since you seem to be tracking car fires. Here is a news station that did at bit of research on the 3000 or so Hyundai and Kia fires. I will save you watching the video, by saying it sounds like a fuel pump issue. There were injuries and one death. No lithium, just gasoline. Of course, this doesn’t include the many other car fires and recalls that I have heard about. I can run those down for you, if you wish.
https://www.abcactionnews.com/news/local-news/i-team-investigates/up-in-flames-an-abc-action-news-investigation-in-kia-and-hyundai-vehicle-fires
Ok, guys, now let’s go over, if only in our heads, all the problems with cars in general, and vis-a-vis the crony-capitalist plutarchy, nature and community. Go ahead, try it as a personal thought experiment. Try to leave as little out as possible.
I wonder if, in the final analysis, any relatively complex human technology actually ‘works’.
You know, y’all need to think in terms of per capita miles driven by state.
NY for example drives 6800 miles/yr per person. Texas 10,544. Point being, if city folk decide to not drive their gasoline car, well, they weren’t doing so much anyway. Texans do drive a lot, there are a lot of them, and they aren’t going to leave themselves stranded on the road when there’s a perfectly good gas station right across the street.
And so, you’re not saving much oil consumption. The growing pop states like North Carolina also have wide open spaces, they drive 11,120 miles/yr . Lots of people who drive long distance. Vs NYC.
Reduced environmental impacts is zero importance, of course, because no one will agree to starve to keep global warming slower.
Watcher,
I will probably drive about 20k for the first year owning my Model 3. I live in a very rural state, no problem with being stranded. Plenty of superchargers in Texas. In addition charging infrastructure will only get better with time. Plenty of coal, natural gas, hydro, wind, solar, nuclear, and geothermal to produce electricity to power EVs. The total cost is far cheaper, just read the report referenced. Not some green outfit, one of the top ten banks in the World. It’s real, oil is going down to $20/b, most of it will be left in the ground as it won’t be able to compete.
One can set the price at $8o/b, but not many buyers will be found. Unless you want to subsidize by calling the price $80 and then rebate $60 to customers so the real price is $20/b.
Watcher
Assume 300 driving days per year.
NY @ 6800 m/yr = 22.67 m/d avge.
Texas @ 10,554 = 35.2
NC @ 11,120 = 37.1
Dennis @ 20,000 = 66.7
So you can see a PHEV with between 50 or 75 mile battery range would probably cover close to 75% to 90% of most trips on battery. A little range extender engine picks up the odd longer trip.
As a point of interest, the original Volt was designed for a 38 mile range because it was the US average trip length. GM’s survey of their customers revealed that their biggest request was more miles on battery. So in Volt2, they went to 54 miles with a lighter battery and similar volume.
The Volt has been discontinued. A nice idea, but 35k vs 39 k for a Tesla Model 3 which is a far nicer car.
The Volt was an amazing piece of engineering for it’s time. Very complex but generally worked well. Now that EV’s have progressed in range, quality and ability the Volt can be quietly put aside over the next 10 years as they lose support and age.
Dennis
According the this article 40k buys a pretty stripped model 3. I am sure most pay for the extras.
The cheapest Tesla you can order online will now be the Standard Range with a software limit on battery capacity and it will cost $40,700 with a — euphemism alert — Partial Premium Interior, comprising power front seats, leatherette upholstery, an upgraded audio system, and navigation. This new Standard Range will have 10 percent less range — reduced by software — than the Standard Range Plus. That interpolates to 226 miles, close enough to the original-maybe-it-existed Standard Range’s 220. Software guardians of the pecking order will also block out the heated seats, navi, and online music streaming. They can pay a fee to upgrade to the Plus’ higher range, and features. Car and Driver said buyers of the Standard Range were getting calls from Tesla reps asking if the buyers didn’t maybe want to upgrade to the Plus after all.
Hi Ovi,
It is 40 k for the standard range plus with 240 miles of range.
The Volt was 35 k. I assure you the standard range plus for 40k is a far nicer car than the 35 k volt. It was an ok car, just far less of a car than the model 3.
Note that I have a Camry XLE hybrid, I used to think it was a nice car.
It is ok, but half the car of the Model 3. Performance, ride, handling, etc a completely different league. You would need to test drive one to appreciate the difference.
Ovi,
Probably 350 days driven per year, maybe 344 at minimum. The tesla is almost always the car of choice, though when leaving a car at an airport it is the Camry. So about 58 miles per day on average. Most days it is about 15 miles.
In the second half of this coming decade, miles driven by EV or PHEV will be considerably cheaper than for petrol miles. Most Texans (and other people) are price sensitive, and will opt for the better deal when they are ready for a new vehicle.
It already happened to me. I got a PHEV just over a year ago. My miles are much cheaper than they used to be. 3/4 of my miles have been electric, supplied by solar PV on my roof. 1/4 of the miles have been petrol. The money diverted from the petrol station is in effect more rapidly paying off the roof panels, which also provide all of our net annual electricity household consumption.
This kind of scenario will become more obvious to people all around. And very gradually the nations stock of on road vehicles will be electrified (either full EV or PHEV- same outcome).
It will take a long time to accomplish the shift. We’ll see which auto manufacturers can stay ahead of the curve. Its going to be a very rough road for those who aren’t out front. And there may come a time when battery supply becomes a limiting factor. Tesla has a big advantage on that front.
Note to watcher- no one is agreeing to starve, just to trying avoid being left without transport and and being subject to massive transport price increases when petrol goes through the coming depletion process. The country certainly needs to begin with deployment of an alternative to the dire scenario you seem to look forward to.
What was the full cost of your panels, charging gear, and installation? And how much do you reckon you are saving monthly or annually?
I keep running this idea around in my head, but I only spend $100 per month on gas and the electricity will still cost something. I reckon $20-40 range per month. Savings, yes. But only an $800 savings per year. That’s a long payoff on a $15K panel array turnkey install, which was last I was quoted (could have come down). Maybe 20 years to pay for itself, if no replacement and maintenance is required, which seems unlikely.
Those economics haven’t worked for me, but prices will keep dropping, I think, or I’ll just go ahead at some point.
My system total cost was $16,000.
Our electrical bill was much higher than yours.
The costs for a system have come down, we paid $2.40/kW in early 2018, and generated
11,000 kwhrs in the first 12 months.
We had excess production, and the utility has credited us $480 (even though they pay only 3 cents/kwhr for excess production, while charging up to 25 cents for consumption!)
We expect excess production to cease once we get a second EV in the coming decade. In fact, we might need to get some more panels. We have 20, might want 6 more.
With a low electrical bill that you have, it may not make sense at this point.
If you get a PHEV or EV at some point, the economics will shift strongly in favor of getting a PV system.
Watcher! Some perspective, purlease!
Texas average of 10,544 miles per year is just 29 miles per day. Even a 30 kWh Leaf can do that for three whole days before needing a wee charge from the wire hung out the kitchen window! And that charge may only cost you $3.00 (at 10 cents per unit) and away you go again for another three days. How much does it cost you to drive your Texas Tank for three days??
I think price ever getting back to $70-$80 depends a lot on how well things hold together. You really need calm markets instead of chaos to get oil there. I expect absolute chaos to continue as the pie starts to shrink for everybody. People assume that things are going to get calm and remain calm. That just not in the cards. Matter of fact the chaos is going to accelerate from here on out.
Anybody have a WAG about how much debt would be needed to build out renewables and EV’s for everybody? Your also going to have to put that debt on top of the current debt.
The renewable and EV economy will need to be able to service all the debts from the prior fossil fuel economy plus it’s own debts.
You couldn’t pay me any amount of money to own a bond be it government or corporate. All that paper will be worthless as we attempt a transition to a renewable and EV economy. Only way they get paid is with monopoly money.
HHH,
The cost is lower for EV, wind and solar, read the report. Cost lower by a factor of 4 to 5.
Dennis the cost doesn’t matter one fucking bit. Can a EV and solar economy generate enough profits to service the debt or not? It’s not a viable way forward if not. Can Shale oil generate profits at current price the answer is hell no and it’s not a viable way forward. Without profits all one can do is go further into debt to keep the farce going until they can’t anymore.
HHH,
Solar is quite profitable see
https://www.forbes.com/sites/greatspeculations/2019/01/30/nextera-energy-best-in-class-but-at-a-price/#5d1368414a2d
https://finance.yahoo.com/quote/NEE?p=NEE
Tight oil, not profitable at $60/b or lower for Brent Crude.
Financial engineering of stock price isn’t really a profit. Real profits are you borrowed money to create something like Tesla cars. Then you made a profit after all cost are deducted including taxes. There is either a profit there or there is not. Now companies can continue on not making a profit for a very long time though being able to borrow more money. Doesn’t mean any of it actually gets paid back. All it mean is companies expand their ability to take on more debt right up until they can’t anymore then they fold. The stock buybacks that are taking place at every major company in America are a form of company liquidation. When real profits and revenues can’t keep up with the debt servicing cost piled on them to do all those buyback and cost of daily business each and everyone of them will fold.
Hell the major oil companies can borrow cheaper than the rest of them. Doesn’t mean they are going to make dime on shale oil. Just means they are going into debt producing shitty oil.
You can have all the growth in the world and still not make a profit Dennis.
Banks have to be profitable too. Banks borrow money short-term and lend long-term. If your in Germany where the central banks benchmark rate is negative 0.40% and the entire yield curve all the way out to 30 year is negative. How do you make money lending within the borders of your own country? There is no profit to be made lending in Germany. And yes i understand there are loans with positive interest within the borders of Germany where money can be made lending but all those loans are not government backed loans. They are loans that depend solely on there being profits made in the real economy.
Without profits eventually governments no longer get funded because there is no profits to tax. Oh wait they can just issue more debt at a negative rate and have the central bank buy it. Anyone that believes that this can and will continue to go on until the end of time is fooling themselves.
People believe central banks can just buy up all the debt and cancel the debt. What is to stop them. Give all governments a clean slate to borrow. Ask yourself why haven’t they already done that? Facts are central banks around the world have bought up trillions in debt and none of it is getting canceled.
HHH,
Not all companies have no profits and just because a company borrows money does not mean they are not profitable. A company that is expanding operations will borrow to take advantage of existing opportunities, in some cases things won’t play out as they expect and they may borrow too much.
Amazon for years did not turn a profit, they are looking pretty good lately. My guess is the same will be true for Tesla, VW, some Chinese EV producers, and power companies that focus on solar and wind power as well as battery storage and HVDC transmission.
HHH – ” Can a EV and solar economy generate enough profits to service the debt or not?”
In my world, you service your debt with earnings. Then if you have leftover it may be considered profit.
Much more important question to ask, “if the country did not embark on a rapid development program and deployment of electric transportation, what would be the economic repercussions of declining oil supplies?”
Since you are a stock guy, you might enjoy riding these two solar equipment companies in to the higher layers of the atmosphere- SEDG, ENPH
I’d invest in the medals that are required to build batteries rather than pick any particular companies stock. No i’m not a stock fan.
Way i see it EV’s will revolve around battery storage. Forget about where and how the electricity is being produced. These can be coal, or natural gas, nuclear or hydro powered EV’s or solar and wind. They all need certain medals for batteries.
HHH,
Metal mot medal.
‘Not’ not ‘mot’ 🙂
Yes ‘Mot’ 😉
mot 1
/mō/
noun
noun: mot; plural noun: mots
short for bon mot.
bon mot
/ˌbän ˈmō/
noun
noun: bon mot; plural noun: bon mots; plural noun: bons mots
a witty remark.
synonyms: witticism, quip, pun, pleasantry, jest, joke, sally; More
Origin
mid 18th century: French, literally ‘good word’.
Dennis was right on the ‘Mot’! And I found it quite funny.
Cheers!
I am only funny unintentionally.
That’s a great kind of funny sometimes, Dennis.
That is funny! thanks for the correction Jay 🙂
HHH, that is what I think also. It won’t remain calm and a certain kind of chaos has appeared already (‘energy choice dillemas’, ‘effects of climate change’ to name two). The chance of a concerted transition to EV’s, etc in course of slowly rising oilprices in the next let’s say 10-20 years is not very big in my opinion. Simply because there are a number of reasons to imagine why oilprices are not going to behave that way. Think about for example a rapid increase and then a crash in price. We have seen that in the previous decade.
The fact that EV, etc costs are lower by a factor 4-5 far from completely erase the problems of the current debt economy (governments and consumers).
Ah, but what level of market penetration by the Renewable Electricity + Electric Vehicles combo (RE+EV) is required to knock out the players who are only surviving on (ignorant) shareholder sentiment that maybe oil will get above $70 and stay there? I would say you only need enough to ‘prove’ to investors in the fossil industry that the threat is real. A clear 1% penetration may be enough. I think 5% penetration by RE+EV would be a huge signal to the market. You don’t need 25% or 50%.
These investors will switch their money in a blink of an eye if the signals are clear. As they say: “You won’t need much. Just a tiny taste.”
I can’t say that I agree with Watcher about a whole lot, but one thing he does say is that when you MUST have something, you will get it, one way or another. Oil for now, and for quite some time to come, probably at least two or three decades at best, is something we simply MUST have.
If depletion and or political factors reduce the supply of oil faster than electrification of transportation reduces the need for it, the price WILL go thru the roof. If the user doesn’t pay at the pump, he will pay at tax time, collectively speaking. One way or another, we are all users, and one way or another, we are all de facto tax payers.
I can’t see that ANYTHING other than hard times and or oil becoming obsolete as transportation fuel can keep the price of it down very long, considering depletion.
One thing that always REALLY pisses me off is that so many people talk about the price of something being CHEAP, when it’s subsidized. It still costs the same, and somebody, in essence, EVERYBODY pays the subsidy. Even a little old lady who has never paid a dime in income taxes, because her husband supported her pays, de facto, because the subsidy any one person gets reduces the subsidy any other person COULD get, namely HER.
I’m not opposed to subsidies, in principle. I support subsidizing renewable energy, electric cars, etc. Bottom line, such subsidies are EXCELLENT deals for EVERYBODY, except those with skin in the current day bau ff industries. But it’s not good pr to talk about subsidized cars as if the subsidy is a miraculous gift . This sort of talk INFURIATES people by the tens of millions who CAN’T get any particular subsidy, and as often as not wouldn’t want to even if they could. And you can be sure they know about the subsidies for rewewable energy and electric cars, because their favorite talk show hosts, so called news organizations, and politicians remind them often enough that they CAN’T forget.
A FAIR way to subsidize an electric car would be to have a national lottery. Everybody gets an equal shot at a winning ticket. If I win, I can apply it to the purchase of an electric car. If I can’t afford a new car, or don’t want one, then I could sell it to somebody who DOES. End of discrimination on the basis of being well enough off to afford a new car.
Politically speaking, this could be a HUGE winner. Before long every little rural small town and county weekly paper would be running a picture of a farm laborer or the town drunk who has just won, and sold his subsidy check/ ticket, and used the proceeds to buy himself a well used F250. Half of his friends and acquaintances would rush out to register and vote D, because them there tree huggin’ whale lover soc’lis red commies Dimmerkrats are all at once COOL ’cause they’re running a ” FREE” lottery for them.
Is the Permian better then most think today ?
https://www.forbes.com/sites/davidblackmon/2019/08/08/heres-what-is-really-happening-in-the-permian-basin/
“What we’re seeing is that [Permian Basin] wells drilled this year are continuing the trend of being better than they were the year before, across the whole Permian – the New Mexico Permian and the Texas Permian. Average per-well peak rates for the New Mexico Permian since 2014 have gotten better every year, averaging about 20% better every year. But more importantly, on a cumulative basis, the same amount of time it used to take to produce a nominal break-even per well was five years [in 2014], and today it’s 9 months. – Allen Gilmer, Founder and Chairman of the Board of DrillingInfo”
“these producers are sitting on another Saudi Arabia and have years worth of locations that can be profitably drilled at $20-$30 prices. Most of it is economic at $40/bbl – you just need to be able to go out there and do it the right way.”
That doesn’t jive with the recent statements from the CEO of Pioneer.
I follow @allengilmer on Twitter to observe his cornucopianism and undying Trump allegiance. It’s comical stuff that I feel the urge to reply to but realize he would just block me and then I would miss out on where his lunacy is headed.
It has to be that his political agenda influences his forecasts. Does Gilmer have any charts to back up his claims? Or are these saved for his paid subscribers?
Envision,
People who actually know something about producing oil like Shallow Sand and Mike Shellman might tell you that the claim that most Permian basin oil is profitable at $40/b is a load of BS.
To earn a modest return of 10% for a highly risky endeavor (drilling a new well whose ultimate recovery is unknown) requires an oil price of at least $62/b at the well head (WTI=$66/b) over the 15 year life of the well at an average full cycle capital cost for well, land, and associated infrastructure of about $10 million for the average Permian well. Also note that the “typical” EUR touted in investor presentations is about 2 times too high (1.84 aactually) for barrels of oil produced. The natural gas is not very profitable, though I include it in the breakeven analysis (along with NGL) to offset some of the OPEX.
My scenarios use a relatively realistic analysis to arrive at US tight oil output, under an optimistic scenario for oil prices (rising to $100/b) and the mean USGS TRR scenario for US tight oil, there might be 75 Gb of URR for US tight oil. If oil prices are low due to an EV and renewables transition as envisioned by BP Paribas the URR will be about 50 Gb, with a steep drop in output around 2030, for the Brent oil price scenario that steeply drops from $80/b in 2028 to $20/b (both in 2017$) in 2038. As mentioned in the post a steeper drop over 5 years is possible if AVs reach regulatory approval by 2028, with oil prices reaching $20/b by 2033 or perhaps sooner.
Why faster with AVs? Let’s say the average EV owner drives her car 15k miles per year without AV, now her AV capable car is approved to drive itself and she chooses to use the car as a robotaxi to earn extra income with the car being driven 200 miles per day for 300 days per year that would be 60k miles. If we assume 50% of EV owners make this choice then miles per EV increases to 2.5 times what it was before approval of AV by regulators so oil demand from ICEVs would drop 2.5 times as fast so oil prices might actually fall to $20/b in 4 years rather than 5 years.
In any case when AVs are approved demand for oil from personal and commercial transport will drop like a rock.
Dennis
In order to guess the price of oil in 2030 you have to have a reasonable idea of when peak oil will happen and what the global decline rate will be.
If we assume global aviation and marine transport will continue to grow along with global GDP then you have to work out how many electric vehicles would have to be bought so that demand for oil falls faster than production decline plus increased consumption from aviation and marine.
Aviation is consuming 10 billion gallons more than 2 years ago.
https://www.statista.com/statistics/655057/fuel-consumption-of-airlines-worldwide/
https://edition.cnn.com/travel/article/china-new-airports/index.html
What year will peak oil be and what will the decline rate be are the big questions to answer.
Hugo,
I have presented that information in the past. The chart below is millions of barrels per day of World C+C output. The supply curve shows output with the assumption that demand is high enough that every barrel that can be produced at a profit can find a willing buyer, it is as high a supply is likely to be in a scenario with oil prices at up to $120/b and World URR is approximately 3200 Gb for C+C (including conventional oil, tight oil, and extra heavy oil from Canadian Oil sands and Orinoco belt). The demand scenario assumes that demand for crude other than for land transport increases by 280 kb/d each year, it is assumed about 35% of C+C demand is for non-land transport use.
Of course assumptions can be modified this an earlier analysis based on BP regional data, note that many analyses include NGL and biofuels as part of oil supply, I do not, my focus is on C+C output which is primarily used for light and middle distillate production with a small portion becoming residual fuel.
The gap between supply and demand that arises after 2028 leads to falling oil prices so that supply adjusts lower to match demand.
Note that this scenario is an older scenario that has not taken account of the tight oil scenario I presented In this post. Also it does not take account of falling oil prices which will lead to far lower extra heavy oil output than my previous scenarios. Will revise in the future.
Revised scenario, required adjustment of oil price scenario with oil prices remaining at $80/b until 2034, this reflects rising extraction rates through 2034. Tight oil scenario revised for consistency.
revised tight oil scenario used with scenario above.
shock model which matched the ev transition demand scenario, note rising extraction rate for conventional oil through 2034, this suggested that oil supply was matched pretty closely with demand up to 2034, which led me to adjust the oil price scenario. Note that the “supply scenario assumed constant extraction rate after 2034.
Dennis
I really do not understand your demand graph. How do you get demand falling faster than supply?
50% increase in demand is coming from other sectors.
https://www.iea.org/newsroom/news/2018/october/petrochemicals-set-to-be-the-largest-driver-of-world-oil-demand-latest-iea-analy.html
This year 140 million motorbikes will be sold and nearly 100 million cars, vans and trucks. Approximately half that number will be crushed. Of the new vehicles on the roads 48 million additional cars, vans and trucks will be burning oil. Sales of electric motorbikes are unfortunately tiny.
Obviously, for Oil demand to level off all additional cars etc would need to be fully electric. Then for oil demand to fall, even more electric vehicles would need to be sold to make up for aviation and marine transportation and the petrochemical industry. There is little chance global sales of electric vehicles will be anything like 70 million in 2027.
For instance BMW produce about 60 models, they only have 3 electric vehicles for sale and another 2 or 3 on the drawing board.
Hugo,
Read my comment.
Supply curve shown assumes no EV transition and oil prices high enough to balance market (so demand would equal supply as must always be true.
The “demand” curve is a demand constrained scenario where supply will be lower to match lower demand caused by EV and renewable transition.
I guess my previous explanation was not clear. Petrochemical demand is mostly natural gas and NGL, I said specifically that I exclude NGL from my analysis, the IEA does not.
As to how fast the transition to EVs will occur, plugin vehicle sales have been growing rapidly, note that new cars get driven more than old cars, so miles driven by electric can change fast. This is especially true when AVs are approved.
Generally I underestimate the speed of such transitions.
Dennis
I have read your comment several times.
Firstly looking at your graphs it is difficult to pinpoint the exact year. But somewhere around 2028 you have demand falling faster than supply decline. For that to happen the number of NEW vehicles that are electric must be more than the number of new vehicles that are petrol and diesel.
which would be around 50 million.
Also the number of electric motorbikes sold would have to exceed 70 million per year.
I really hope you are correct but considering most car companies are not even designing half their fleet to be electric tells me you are wrong.
Hugo,
See chart at comment linked below (revised scenario)
http://peakoilbarrel.com/us-tight-oil-scenario-based-on-bnp-paribas-study/#comment-684792
I think it is fairly clear in that scenario that the demand constrained scenario falls below the supply constrained scenario in roughly 2035. In the scenario about 83 million plugin vehicles are sold in 2035 and the total plugin fleet is 604 million vehicles in 2035, about half of the total. Growth rate of plugin sales at this point just matches sales growth (assumed to 1% per year). Note that in an AV approved scenario (quite likely by 2035 in my view) new car sales would be falling as TaaS will be the way forward for personal transport and commercial transport will quickly move to EVs (50% sales growth likely) once AVs are approved.
Also thank you for your initial comment which prompted the revision (and improvement in my view) of the initial model presented.
On the number of vehicles that are EVs, we will see more of them and it is number of vehicles sold that matters. That number is increasing rapidly and in my view that trend is likely to continue. I hope that my scenario proves to be incorrect because it is too conservative. 🙂
Also I am not too concerned with motorbikes they use a lot less fuel and like vehicles will be replaced by ebikes.
Hugo,
Also note that in my revised scenario the “demand contrained” scenario falls below the ” supply constrained scenario in 2035 (16 years in the future).
You do not think it is possible that EVs cannot ramp up to a level that cuts into oil demand in 16 years?
Have you ever seen the Tony Seba presentation that shows the slides with find the auto and find the horse in NYC about 10 years apart?
ICEVs are the horse, EVs are like the auto in that scenario, my scenario does not even tak into account the likely approval of autonomous vehicles by 2030 worldwide. Once that occurs EV use increases (miles driven per year) by a factor of 4 at minimum and ICEV miles driven drops to zero very quickly.
For that reason (the fact that autonomous vehicles are not even included in my scenario) I consider my EV transition scenario very conservative.
And as I mention often I was a late adopter of some technology such as cell phones and smart phones.
Dennis
I have little doubt EVs could be reducing oil demand by 2035.
The real concern is what happens between peak oil in 2025 and 2035.
At the moment about 50 million ICE vehicles are scrapped each year, to be replaced by 95 million new ICE vehicles. Along with aviation and maritime growth we have a demand increase of 0.6mmbl/d of CandC per year.
The is little chance sales of pure electric vehicles will be 50 million in 6 years.
Between 2025 and 2030 will prove very difficult. There will be 1.5 billion ICE vehicles in 2025 and they will all need fuel and there simply will not be enough.
Hugo,
Oil prices will adjust to a level that supply matches demand, more hybrids, plugin hybrids, and EVs will be sold over the ensuing period so that average fuel efficiency will increase, aging populations in advanced economies will result in fewer vehicle miles travelled (old people drive less).
The scenario I have created has annual sales growth of plugin vehicles decreasing to 50% in 2019 and decreasing each year by 5% through 2024 and then remaining at 25% growth for 2025 to 2030 and then gradually decreasing as 100% of personal vehicle (light duty vehicles less than 6000 pounds curb weight) sales become plugin vehicles by 2034.
The scenario does not account for autonomous vehicles which will accelerate the transition.
Hugo- “The real concern is what happens between peak oil in 2025 and 2035.”
Absolutely, although one could quibble with the exact timeframe, I agree wholeheartedly.
It is probable that in this period will be a very big rough patch (to say the least). Some places more than others.
Its why I see deployment of reneweables as
critical to help weather that transition.
We are all very late to the game on this.
And if you live in an area with solid electricity supply your going to want a PHEV at minimum. That way you’ve got options and flexibility. And incredible mileage for the short trips.
It’s my concern that the crony-capitalist plutarchy, or status-quo if you will, is unlikely to properly or adequately respond to our current and impending predicaments.
That’s why we have Extinction Rebellion, which wants what they call citizen assemblies and something closer to real democracy. This may be a step in the right direction of systemic change that can then perhaps begin to better respond. If or until then, I fear that much responses, such as that include so-called renewable technology, will be wasted.
https://seekingalpha.com/article/4284168-oil-picture-bullish-eia-realizes
Interesting take on EIA outlook. While they have looked at two subtractions which are not included in the projection, I have one more. Note, the EIA is constantly adjusting the US lower as we go, but it is no where near low enough for 2020 for production. 2019 is still a little high to me for an average, but, at least, within reason now. It’s absurdly high for 2020.
GuyM,
If oil prices remain where they are through the end of 2020 you may be right, I am skeptical that the expected glut in oil output will come to pass. For that reason I think we may see oil prices gradually rise to $70/b by mid 2020, my $70/b and $80/b scenarios only have US tight oil increasing by 500 kb/d in 2020 (from Dec 2019 to Dec 2020) and annual average tight oil output increases by 636 kb/d from 2019 to 2020, in 2019 the annual average US tight oil output increase by 1130 kb/d from the 2018 annual average, so 1768 kb/d increase in the 2020 annual average compare to the 2018 annual average tight oil output, for my $80/b scenario (first chart in the post). No doubt this is still too optimistic for some, my guess is that the future will prove that it was a pessimistic scenario, like many of my past scenarios.
I could be anything. Been following projections of supply/demand for more than a few years. No prediction by EIA, IEA or OPEC has been anywhere near close. Each year seems to differ by semantics, or timing. Lower by demand this year by .4 million. Shoot, it won’t happen later, it’s already happened. Three of Europe’s top GNP countries are in what resembles recession. Look at the OECD draws, they haven’t happened. Ain’t going to, much. On the supply side, US production growth is stunted, to say the least. So, what is happening NOW, on inventory draws, is only going to get worse. And, we can’t really tell what that is, because we can’t get a handle on all inventories. (So what’s new?)
So, your standard response is to guess that if prices improve, the walking dead can come to life again. From an accounting viewpoint, I have a hard time understanding that. Voodoo cures are not an option. They are walking dead, and will remain zombies. That is it, and that is close to 90%.
GuyM,
Generally higher prices result in higher profits. Also lower supply tends to increase prices, though certainly you are correct that if demand falls while supply falls there would be no change in price. I guess that is where you think things stand and that it will continue. My guess is different that is all. I agree both demand and supply at the World level will fall at current price level. Where I differ is that I expect supply will fall more than demand between now and 2020 and lead to higher oil prices which will lead to better profits. I also think the better companies will buy up the decent assets from the zombies. Then the tight oil industry will be better off with decent companies running the show.
I have $8000 in options that will cover if prices rise by Jan 2021. Yes, supply will fall more than demand. But, there won’t be much price movement this year. That will set up a long time before things can be geared up again, when prices do rise, which I also fully expect.
Guym,
Many of the forecasts are too high. On that we agree. I also agree most predictions are incorrect. The EIA prediction for the US through 2038 looks reasonable to me. Perhaps oil prices do not recover. Difficult to know, I agree it might be anywhere from 50 to 70, as to it being anything, I think less than 30 or more than 90 between now and 2022 are not very likely.
correction I said 2038 above and meant 2028 for EIA forecast (AEO 2019), sorry.
I bought a 2013 Nissan Leaf used in early 2015 for $10K. I have driven it as my primary car for over four years, including using it in my home inspection business and tooling my kid around town. At first I thought I would be needing a new battery around now, and I had budgeted to replace it after 8-10 years. But after six and a half years the battery is still over 90% capacity, and I now have no intention of ever replacing it. The costs to operate are negligible, maybe $10-15/month, putting on about 8K miles a year. There are no oil changes every 3 month, no radiator flushing, etc. The biggest cost is the tax my state NC puts on the car every year – this is roughly equivalent at $160 to the amount spent on fuel. Once the shop had to put some brake fluid in. I bought a new set of tires recently. It is not kept in a garage. It just turns on and goes when I need it, and never has any problems. It is limited in range as a first generation EV so I have to plug it in every day or two, but other than that, I plan on driving it for the next ten years and then handing it over to my son as his first car. And oh yeah, the best part – even in Eco mode when I am stopped at a stoplight next to a rumbling brand new Camaro or some other such nonsense, I leave em in the dust like they’re standing still, laughing all the way.
At some point, the government is going to have to find some way of replacing the road tax that is paid through gasoline. I think that eventually the electricity going into your car will come through it’s own meter so that it can be taxed at a different rate than home electricity. Also there is early talk of adding a mileage charge when you renew the license on a BEV. In the meantime, enjoy the free ride.
Ovi,
I agree, the logical choice is to tax based on miles on odometer and Gross vehicle weight as heavier vehicles do more damage to roads per mile, this tax can be paid when the car’s registration is renewed, for cars that are sold privately it might require a tax to be paid from most recent registration to miles on car when it is sold.
Note that this applies to PHEVs as well as most miles travelled probably are on electricity.
Dennis
I don’t think there is a good solution for this issue. Special meters are too expensive. Miles work for BEVs. It is not going to work perfectly for PHEVs, because of the different size batteries that will be used. For instance the Prius prime gets 25 miles on battery. The BMW I3 second generation gets 115 miles on battery. So if miles are used, maybe they will have to add some arbitrary factor based on battery range.
If the Prius does 10,000 miles, maybe 60% are done in EV mode and would pay the tax on 6000 miles. For the BMW, maybe 90% are done in EV mode and pay appropriately.
I am also thinking that this factor might be used by the govt to push larger batteries.
Maybe a battery range tax, in addition to the mileage charge could be used to encourage a bigger battery in a PHEV.
For example:
25 to 49 miles: $150/yr
50 to 74: $100
75 to 99: 50
>100: No battery tax
Ovi,
Battery range should not be a factor. Just eliminate road taxes based on fuel use for all vehicles. We could leave a carbon tax on fuel.
Ovi,
Solution is simple, eliminate fuel taxes on all vehicles, road tax paid at registration based on gross vehicle weight and miles on odometer.
That works.
The whole idea of using gas taxes to pay for roads is kinda dumb, and was abandoned decades ago, when Republicans started refusing to raise taxes in attempt to destroy the government. The Federal Highway Fund is broke, as is every state DOT. Governments across the country have been dipping into the general fund for years.
The solution to the problem is to stop building new road capacity. Most road expenditures in the US are to increase capacity, even though there isn’t enough money there to repair existing capacity. It’s the same problem as the shopping mall problem. There are simply too many around. Pounding more money down that rathole is not the solution.
Here is the background of the guy behind this scientific paper:
Mark Lewis joined in January 2019. Previously, he was Managing Director and Head of Research at the Carbon Tracker Initiative (April-December 2018), Managing Director and Head of European Utilities Research at Barclays (2015-18), Chief Energy Economist at Kepler Cheuvreux (2014-15), and Managing Director and Global Head of Energy Research at Deutsche Bank (2005-13). He has also been a member of the Financial Stability Board’s Task Force on Climate-related Financial Disclosures since May 2016.
Mark is a UK and French Citizen and holds a BA (First-Class Hons) in Modern Languages and Economics from Sheffield University, an MPhil from Cambridge University, and an MA from London University.
https://investors-corner.bnpparibas-am.com/mark-lewis/
—————–
This guy is anti-oil through and through and I am not sure how his modern languages, philosophy and economics arts degree qualify him to do any credible EROCI calculations. Its mind boggling how guys like this get so much press in the media because they work for some bank.
Ivan, other than character assassination, do you have reality based issues with the assumptions or analysis presented in the study?
It’s deserved character assassination. There is agenda here. Agenda is pretty much all that matters in a world where data avalanches and can’t be screened for identity other than the dood’s background.
Why go and get data from a guy with this sort of radical extreme green background. There are zillions of other places to get data.
And btw, why all the talk about cars. They undersell SUVs and trucks by a huge amount.
Exactly right Watcher, the guy is selling “sustainability” investments for the bank clients. Is he going to produce a paper stating that EV’s are not competitive? That solar and wind are not as reliable as NG? Of course not. Producing papers with provocative headlines such as oil at $20 a barrel is great for business, it gets the sensualist media attention, it gets them virtue points with the climate change crowd, it gets them green investment banking, environmental government contracts. Going back to the paper, Lewis states:
“The reason why wind and solar energy pose such a threat to the energy system established over the past 100 years is simple: they have a short-run marginal cost of zero. In other words, when the wind blows and the sun shines, the energy itself arrives for free.”
Well just because the marginal cost of solar is zero at the panel doesn’t mean that it is zero to the user. The bit in between – transmission and storage – still has to be resolved. The cost and complexity of that bit will ensure that fossils are in business for some decades yet. The Manhattan Institute does a good job of disputing all this green magical thinking in this paper:
https://www.manhattan-institute.org/green-energy-revolution-near-impossible
Actually, even Micheal Moore seems to have figured the renewable scam, from ABC News:
What if alternative energy isn’t all it’s cracked up to be? That’s the provocative question explored in the documentary “Planet of the Humans,” which is backed and promoted by filmmaker Michael Moore and directed by one of his longtime collaborators. It premiered last week at his Traverse City Film Festival.
https://abcnews.go.com/Entertainment/wireStory/michael-moore-backed-doc-tackles-alternative-energy-64844048
The Manhattan Institute does a good job of disputing all this green magical thinking in this paper:
And by that statement I assume you do not include the possibility that the Manhattan Institute has an agenda and ideology of it’s own which they are defending?
https://www.manhattan-institute.org/?gclid=CjwKCAjw1rnqBRAAEiwAr29II9CIptrYAEK_zQy71QrKnmCy1xEGcmYTtPFJ-XA9Mv_uzbTTF4bOwhoC8SYQAvD_BwE
A leading free-market think tank focusing on Economic Growth, Education, Energy and Environment, Health Care, Legal Reform, Public Sector, Race, & Urban Policy
Lets see how these completely unbiased people without any agenda discuss issues such as Public Sector, Race and Education.
https://www.manhattan-institute.org/new-report-proves-trump-right-rescind-obama-era-school-discipline-policies
Uhuh! I see! I’ll bet they are just as unbiased and agenda free when they discuss energy and renewables.
Manhattan Institute was founded by William Casey, Reagan’s CIA boss, and funded by Charles Koch. It’s just a Republican propaganda outlet, like Fox News, plain and simple.
How about Micheal Moore is he the Koch brothers shill too?
You are making my point Fred, you can’t look at these papers without looking at who’s behind them.
Neither ad hominum or appeal to authority are useful.
Specific criticisms of the analysis are. Make an argument guys, so far there has been little.
We have a much more in depth discussion about this topic on the non petroleum thread. I don’t want to hijack this thread with political, ideological and non petroleum related topics. This comment of mine from that thread should clarify where I stand.
http://peakoilbarrel.com/open-thread-non-petroleum-august-9-2019/#comment-684800
Cheers!
In a free market, marginal costs set prices. We have no Soviet style Five Year Plan to worry about “total system costs” in capitalism. The problem is that you simply can’t win market share from renewables on price, no matter how cheap your fuel is.
Because we live in a free market, solar is set to kill all other energy sources. It will do so by stripping all the profit out of the fuel selling business. What happens afterwards is an interesting question, but it doesn’t solve the problem for the traditional energy industry.
This is hard to imagine because it is happening so quickly. In the 2020s an enormous flood of dirt cheap solar panels will hit the market. Production was up by 30% last year, and there is no end in sight. Installed capacity will double by 2024, and again by 2030 at latest.
Profits in the industry will continue to fall, making new investment less and less attractive. Meanwhile the existing fleet will continue to age and shut down.
Watcher,
The focus is on light vehicles including all vehicles weighing less than 6000 pounds, includes most SUVs including Ford expedition and all varieties of F150.
So cars suvs and pickup trucks included.
Ad hominum agrguments convince nobody.
Not really a scientific paper, it is investment research by an investment bank, I think it is pretty well done.
More information on Mark Lewis here
https://www.bnpparibas-am.com/en/author/mlewis/
It his experience as a chief energy economist which is important in my view.
In addition specific criticism’s of why you might think the analysis is incorrect are more useful than an ad hominem argument.
“An interesting analysis was recently published by BNP Paribas (one of the top 10 banks in the World by assets) entitled Wells, Wires, and Wheels… . In that analysis they argue that long term oil prices will fall to $20/b or less in order for oil used for personal land transport to compete with EVs powered by wind and solar at current cost levels.” – I am not an oilman but somehow this strikes me as being absurd.
You see . . . these green wackos said oil consumption was going to fall because of the magic of EVs (that only sell to other green wackos with a lot of money, and who don’t drive much, and when they do they don’t talk about the winter). They said that 3 yrs ago. 2 yrs ago. And last year.
But son of a gun, US 2018 oil consumption grew 2.5%. That ain’t a small number. Global consumption grew 1.5%.
There was an article the other day about the IEA getting headlines because they changed their global consumption estimate for 2019, and the change was downward. That essentially was the headline. Lots of exclamation points. IEA sees lower oil consumption in 2019 than their previous estimate!!!
Well, I went and looked for their estimate. It did decrease. By 50K bpd. Out of 95 million bpd. that’s 0.05%. Oh, and the estimate that decreased . . . it was a 1.5% global consumption growth number. They got headlines by reducing 1.5% by 0.05%.
Actually in their last OMR, the IEA upped their baseline demand estimates for 2017 and 2018 by 200K, thus while lowering YoY demand growth for 2019 by less than 200K, they actually increased their demand estimates for this year. The media never gets their story right, it is either stupidity or spinning some bias narrative.
Ivan,
Output of C+C has increased by about 811 kb/d per year on average from 1982 to 2019. The average rate of increase for World C+C output in percentage terms has been 1.2% per year. From 2010 to 2019 the rate of increase was 1.3% per year and from 2000 to 2019 the rate was 1% per year.
I expect the rate of growth will fall going forward.
see international energy statistics at EIA
https://www.eia.gov/beta/international/data/browser/#/?pa=00000000000000000000000000000000002&f=M&c=00000000000000000000000000000000000000000000000001&tl_id=5-M&vs=INTL.57-1-WORL-TBPD.M&cy=199401&vo=0&v=H&start=197301&end=201904
Also note that using BP Statistical Review of World Energy data for European oil consumption in millions of tonnes of oil equivalent from 2005 to 2015, the oil consumption decreased at an average rate of 2% per year over that period.
The rate of decrease was pretty steady over the entire 10 years, some may have been due to GFC, but we would expect if that were the case we would see a rate change.
Eventually the rest of the World will catch up with Europe, possibly North America and then Asia and South America.
Hi Watcher,
I talked about my Model 3 all last winter. Drove the car to the ski resort and back almost every weekend, charged car at resort and yes range is lower in winter as is true of all cars.
I do confess to caring about the environment (guess that would be a green whacko), guilty as charged. 🙂
Again ad hominem not really convincing.
Robert, without getting into the hardcore data analysis, consider several big factors here.
-Solar and wind electricity at utility scale in the favorable areas has become very inexpensive in just the past 2-3 years.
-While these forms of electricity do have transmission losses and a significant cost for storage (primarily batteries and pumped hydro), they do not require transport to centralized facilities, refining, and then dispersal to distribution locations (all as a liquid).
-the conversion of liquid fuel into kinetic in a ICEngine is an inefficient process compared to conversion of electrical energy into kinetic energy in an electric motor. One fellow on this post quoted-“An ICE motor has an energetic efficiency of less than 25% , an electric motor more than 80%.” This alone gives a huge cost advantage to the electric vehicle scenario.
Keep in mind that the study looked at “how much a given capital outlay on oil and renewables translates into useful or propulsive energy at the wheels: in other words, for a given capital outlay, how much mobility can you buy?”
Robert,
Read the paper, I see no problem with the analysis and so far I am still waiting for valid arguments.
Astonishment is not an argument.
Read and find specific flaws.
“Accordingly, we calculate that the long-term break-even oil price for gasoline to remain competitive as a source of mobility is $9-$10/bbl, and for diesel $17-19/ bbl.”
Again I claim no expertise but simply believe that it is highly improbable that we will ever see such prices. Incidentally Leisure Village in Camarillo CA has 2100 homes. One of the patrol officers recently told me that he recalls only seeing about 3 EV’s with outside wiring. My wife tells me that she has seen a Tesla that is garaged near us. I personally have not seen a Tesla in LV this year.
I am probably wrong but i think they are making an error on page 34 of the report.
It says $100 billion dollars of oil purchased at $60/barrel, refined to gasoline gives gross energy at the pump of 1347TWh. And they continue with their calculation based on this figure.
According to my quick calculation, 1 litre of gasoline gives an output energy of 15.66 kWh
This can be calculated a number of ways for those interested. But the simplest way is look at the reference website below. 12.06 kWh/kg [NOTE: I’ve taken the lower caloric value!]. Since the density of gasoline is ~ 0.77kg/L you get the 15.66kWh/litre.
reference: https://www.engineeringtoolbox.com/fuels-higher-calorific-values-d_169.html
Now 1 barrel of oil is 159 litres. So 15.66*159 ~ 2490kWh per barrel of gasoline.
$100 billion / $60 nets you 1.6*10^9 barrels of oil (rounded down). Or gasoline in this case.
Continuing 1.6*10^9 barrels * 2490 = 3.984 * 10^12 kWh. Now lets convert that to terrawatts hours.
~ 3984TWh. They report 1347TWh.
That’s close to a factor of 3 off, and i’ve taken the lowest test case, a higher rounding, caloric value and lower density would net a result more than 3 possibly even 4. So I think i must be wrong somewhere. Please correct me.
Have you considered that in the USA a barrel of oil yields about 20 gallons of gasoline from the refining process, or about 76 liters (rather than the 159 that you included in your calc’s)?
That is one issue to factor.
Ohh yes i see what you mean. If that is the case I still disagree with their calculation. Because if 1 barrel of oil yields ~ 76 litres of petrol, the rest of the barrel is not thrown away.
One barrel of crude oil can make about 19 US gallons of gasoline, 10 gallons of diesel, 4 gallons of jet fuel and another 9 gallons of other oil products such as liquid petroleum gas, plastics, lubricants or heating oil. So the calculation is not a fair one in my view.
ref: http://www.econtrader.com/economics/explain/how-much-gasoline-one-barrel-crude-oil.htm
And readjusting for the factor you pointed out you have:
~1904TWh which is the figure they should use for gasoline. And diesel should be slightly less. But they have diesel at more. (The caloric value of gasoline is higher than diesel and 1 barrel of oil produces only 10 gallons of diesel). Seems to be an error there also.
Bear in mind i am half asleep when doing this lol
It’s barrels of oil, not barrels of gasoline 😉
There are 42 gallons (approximately 159 liters) in one barrel of oil. The energy contained in a barrel of oil is approximately 5.8 million British thermal units (MBtus) or 1,700 kilowatt-hours (kWh) of energy.
Oh, seems that Hickory already pointed that out…
Cheers!
An ICE car only gets about 20% of the energy contained in a litre of gasoline/diesel to the wheels. The rest is just heat. So you only use aroud 3kWh to move the car.
Yes so you get ~ 365TWh of useful energy. Compared to their figure of 270TWh.
I need independent sources to see whether their $100 billion dollars is reasonable to get them their respective TWhs of wind and solar.
Yes, an ICE vehicle is primarily a heater on wheels, from an energy point of view anyway. The mechanical energy it produces is more a footnote.
Iron mike
You have an error on your calculation . 1 liter of gasoline has 0.77 kg and corresponding, it has
0.77*1 2 kwh of energy , only 9.3 kwh
Beside this , 1 kwh in battery of a BEV is much more valuable than 1 kwh in gasoline of your ICE car, at least by a factor of 3. An ICE motor has an energetic efficiency of less than 25% , an electric motor more than 80%.
Yes thank you, you are correct.
Iron Mike,
They are looking at energy at the wheel. Basically in an ICEV 67 % of energy in the fuel is waste heat.
The calculation is spot on for energy at wheel, perhaps conservative as I would e pect a 4 to one ratio rather than 3 to 1.
This is what i was looking for.
Section 1.2 of their report:
REALITY CHECK: OIL HAS A MASSIVE INCUMBENCY ADVANTAGE
The oil industry today enjoys a massive scale advantage over wind and solar of several orders of
magnitude – oil supplied 33% of global energy in 2018 compared with only 3% from wind and solar.
Moreover, EVs are currently more expensive than ICE and diesel vehicles on a sticker-price basis, and
likely to remain so until 2023-25.
This scale advantage over wind and solar gives oil the further advantages of speed and convenience:
the oil industry is so massive that the amounts that can be purchased on the spot market can provide
very large and effectively instantaneous flows of energy. By contrast, new wind and solar projects will
only deliver their energy over a 25-year operating life. This underlines the point that the renewable energy industry needs to scale up massively over the coming decades since on an absolute unadjusted
basis wind and solar cannot deliver anything close to the energy that the global oil industry can deliver
today as an instantaneous flow.
So their calculations are done over a 25 year period of output for wind, and solar, $100 billion worth. Feeding the respective TWhs into EVs, vs $100 billion of oil at 60/barrel feeding the respective TWhs into gasoline and diesel transportation. I think probably a years worth of an oil field pumping at 1 million barrels/day.
I can’t see how wind and solar can ever scale up to what oil and nat gas are doing. I could be wrong though.
Hello Iron Mike,
Just think back over how fast cell phones took over from personal land line phones in places where the service was good, and how fast cell service has expanded into formerly unprofitable markets as the price of the phones and provision of the service has declined.
Wind and solar power are getting to be more economical from one month to the next. Within two or three more years the number of places where wind and solar farms can be built profitably will have grown substantially, and every time the price of oil and gas spike, people and governments are going to better understand that once a wind and solar farm IS built, it’s going to run for twenty plus years essentially fuel free.
And after that….. a complete overhaul, back to BETTER than new, will cost only peanuts, compared to starting from scratch.
Renewable electricity production is going to grow, globally, like an explosion of insects in a farm field.
Hardly any to be seen today, crop wiped out a couple of months later. The renewable electricity industry is going to wipe out the fossil fuel electricity industry, excepting whatever can’t be provided due to intermittent wind and solar production, in most parts of the world.
And a large part of what is considered essential around the clock around the calendar electricity use can and will be eliminated by load shifting and by the adoption of de facto and actual electrical energy storage.
A double insulated triple sized electric water heater can easily be accommodated in most houses these days, and can be allowed for in new apartment construction in the future. Such a water heater might still need a little fossil fuel juice once in a while, but it will run ninety percent plus of the time on wind and solar power, any place where wind and solar farms are numerous. That makes it a de facto battery. Ditto washers, refrigerators, etc. Even heating and ac can be nearly all provided for with renewable electricity by way of using lots of thermal mass and plenty of insulation.
BUT we WILL be using fossil fuels out the ying yang over the next couple of decades to BUILD OUT the renewable electricity industry to the point it can actually pull itself up, as the saying goes, by it’s own bootstraps.
I’ve actually worked in a mine, part time , back when I was an undergrad….. a gravel quarry where the machinery, other than the crusher itself, and the many belt conveyers, all ran on diesel.
But there’s nothing to STOP this quarry from going electric. The drills that punch holes for the explosives need move only a few feet once in a while, the big loader that loads the trucks need move only a few feet once in a while, and the trucks themselves could easily be run on electricity provided via overhead wires, with either batteries or diesel used to maneuver them the short distances needed for loading and unloading in the pit or at the crusher.
They run the drills on compressed air, and the air gets to the drills via large hoses laying on the ground, with one big diesel driven compressor centrally located. By now, they may have switched this compressor over to electricity. I’ll ask some guys I know who work there now. Those air lines could easily be replaced by well armored electric cables. Likewise one big well armored cable could power the loader, which ROTATES, but it’s dozer type tracks don’t move on the ground, to load the trucks. It needs move by ground travel only about once an hour or so.
The entire operation could be powered by a dedicated solar farm. So WHAT if it will only run when the sun is shining? I bale hay only when the sun is shining. Gravel doesn’t rot. As much as is needed can be produced without burning any diesel fuel at all, simply by stock piling it for rainy days.
A Tesla car battery would giterdone in the trucks, because a hundred ton truck could go four or five miles a day at two or three mph using such a battery…. which is as far as they would have to go, on battery power, and fast enough, turning around and backing in to be loaded or unloaded.
My great grand parents couldn’t see cars and trucks displacing horses and mules but from start to pretty much the finish, it took only about forty years. By the time I was a kid on the farm, we had left only a couple, and that couple was kept around only for old times sake, back in the fifties.
I’m one of the small handful of people in this country who has ever plowed with a mule because the mule was NEEDED. We had tractors then, but we still needed the mule for some small scale close quarters work where the tractor just wouldn’t do. Plus when harvesting sweet corn, or cabbage, etc, the mule and cart served as an early autonomous self driving machine. The mule knew just when to start and stop as we loaded the cart by hand, and routinely drove itself back to the barn, to plug itself into its feed bin and recharge with corn on the cob, no fermentation and distillation necessary, lol.
Having seen change at this scale personally makes it a lot easier to accept that change on an even bigger scale is coming again.
I put a 1.2KW solar PV system on my home in 2007. Last year I doubled the capacity. The retail price of the panels had fallen 95%. If anything remotely similar happens with batteries, ICE vehicles will be in the dustbin of history. Electric motors are four times as efficient as internal combustion engines.
Furthermore, the other development that is happening is that fuel cell prices are falling rapidly. This is important for oil because fuel cells can run on natural gas but produce electricity with no combustion. This makes them a natural as a backup fuel source for larger BEVs such semis, boats, heavy equipment, etc. Also individual homes can easily go off-grid on solar and battery with just natural gas/propane connection and a small fuel cell to correct solar’s intermittency problem – presto, no need to connect to the electrical grid. With fuel cells, oil will loose its special place as the only viable transportation fuel. It will have to compete with solar/wind prices AND low natural gas prices.
https://www.greentechmedia.com/articles/read/fuel-cells-in-2017-are-where-solar-was-in-2002#gs.vmjbzz
All this would happen much quicker with a gradually rising oil price instead of low prices and complacency about the status quo. Of course there’s a good chance it won’t happen at all because we’ll fuck it up even though we have the the pieces of the puzzle. Humans seem fatally flawed on some level. That’s what makes this all so damn interesting and why I keep reading this blog so much 🙂
Iron Mike,
The cost advantage of wind solar and EVs is 4 to 5 times cheaper. It is just a matter of using capital that would be invested in new wells and deepwater project being reallocated to wind solar and evs. For exergy you get 4.5 times the bang for your buck.
Seems a no brainer from my perspective. Say we get a 30% increase per year, stuff can happen pretty quickly.
Yes Dennis,
4-5 times cheaper where? Antarctica, Indonesia? Where? You can’t just throw a figure and assume it is uniform around the earth.
Lets for the sake of argument assume it is 4 to 5 times cheaper all over our planet, then the world will change quickly. I am very skeptical. So lets agree to disagree and wait and see what happens.
Iron Mike,
Yes good point, I imagine the analysis took the average cost of new wind and solar investment where it is taking place around the World. As far as I know the population density is fairly low in both Antarctica and the Arctic circle, so there is likely very little investment in wind and solar in those areas. 🙂
But seriously, how would you do such an analysis?
I would take all solar and wind projects over the past year throughout the World and look at projected output over the life of those projects (based on location and average weather over the past 30 years to project for the next 30 years, possibly using climate models for forward projections if available), then I would look at the capital cost of all those projects and then figure out the average output per dollar of capital spent.
Of course there is variability from place to place, using averages just simplifies the analysis. Note that the analysis did not even project falling costs for wind and solar which are likely, so in my view the analysis is quite conservative.
Average solar cost in the US is expected to fall to half the 2017 level by 2030, I imagine this will be matched throughout the World. Note that the original US goal was to reach 6 cents per kWh for PV solar utility scale by 2020 (goal set in 2011) the goal was attained 3 years early in 2017, te new goal is 3 cents per kWh by 2030.
https://www.energy.gov/eere/solar/sunshot-2030
Note that in 2010 PV solar utility scale was 28 cents per kWh and fell to 6 cents per kWh by 2017, these are LCOE estimates.
Funny enough Antarctica and Arctic regions would be ideal places for wind farms.
I think the analysis is extremely difficult to do Dennis. It is as usual multi-variable. One factor for wind or solar viability is country dependence. For example take where I am in Australia. The country sits on vast coal and gas reserves. Right now gas is taking over, especially with new technologies the efficiencies are really attractive, not to mention the glut of natural gas and subsequent drop in prices, makes it really attractive for consumers.
I can’t see investment in solar and wind here on the scale needed for complete transition by say 2035-2040 for Australia, let alone the rest of the world.
Let me posit this too if i may. If you have $100 billion to invest as the paper discusses, if you have a hypothetical oil discovery which is profitable at say $30-$40/barrel. For a nice quick turnover you rather invest that money in the oil field rather than say a wind farm which the investment is spread over a period of 25 years as the paper says, assuming not much goes wrong with it.
And they acknowledge how scalable oil, and how it can’t even be compared to wind and solar, a very fair and honest inference in my opinion, so good on them for adding that. I dont see wind and solar being scalable like FFs Dennis. I am very much open to being wrong and probably am. But there is so much issues with making them as influential as FFs have been, and more importantly on the scale FFs have changed the world. We’ll see what happens I suppose.
I have problems with LCOE as we previously spoke about. I dont believe they are a fair assessment of the real world.
Iron Mike,
Can you remind me of your specific problem with LCOE, it is what the industry uses to analyze electricity projects?
I imagine you are familiar with statistical physics. Averages tend to be used to describe a complex system there (as in the average energy of a system, clearly each molecule in a container filled with air has a different kinetic energy and potential energy and likewise each specific oil well project, wind project, or solar project may have a different annual energy output or total project cost. When doing an analysis for the World we simplify by using averages, just as is often done to describe a container of gas in statistical physics (difficult to keep track of each of 10^23 molecules in a mole of gas).
Also keep in mind that investment dollars spent on oil and gas is a continuous process, so in net energy terms for society the wind solar and EV investment will be 5 times less expensive.
You are likely correct in the following sense: nobody thinks about an investment in net energy terms, full stop.
Projects are evaluated on the return on investment over the life of the project. A better comparison would be to look at the return on investment for an average utility scale solar project in comparison with a new project for natural gas or for oil.
Note also you suggest coal and natural gas are very cheap so that wind and solar won’t scale in Australia, this would be a reason for wind and solar not taking off there (though high prices on world markets might drive up prices in Australia unless there are export restrictions), it would not prevent EVs from taking over from ICEVs.
I am not familiar with the Australian Market, but in the US and Europe electricity generation from coal is decreasing and in high resource areas such as US southwest and southeast, natural gas is no longer competitive with new utility scale solar projects, as the cost of solar power decreases further (in whatever manner you believe is a good yardstick) natural gas will be competitive in fewer areas. Likewise wind power prices may also continue to fall (though perhaps not as fast as solar PV), again in the better resource areas (Texas panhandle and Great plains) wind power is cheaper than new natural gas power plants. The “peaker” natural gas plants will be the first to shut down as peak solar output often coincides with peak demand, wind power will also cut into some of the peak natural gas power plants.
The EVs will be cheaper than ICEVs regardless of whether the electricity is produced with coal, natural gas, solar, wind, or nuclear . Oil prices are likely to fall as plugin vehicles gain market share (by 2036 I expect at least 50% of all personal vehicles to be plugins, if autonomous vehicles have not been approved by that date.)
Hi Dennis,
Regarding LCOE: (There are more articles online but i think this is pretty well structured)
https://www.sparklibrary.com/9-reasons-why-lcoe-can-mislead/
Yes, i am very familiar with statistical physics. But we aren’t talking about the behaviour of an ideal gases at room temperature here. I mean you can for argument sake take the average of different projects from around the world but again for me it doesn’t give a pertinent result. There are so many factors which would influence the respective project and they are consistently changing. It seems to me, we are trying to linearize a non-linear system. Or maybe i am overthinking it, that is another possibility.
EVs could definitely be cheaper than ICEVs regardless of electricity production sources. I totally agree. But from the little reading I’ve done, i believe nickel will be the metal that batteries will have an issue with. There seems to be a constraint on nickel and recent inventory numbers suggest a possible future shortage. Again i could be wrong, time will tell.
Doubt there will be metal constraints, aluminium can be used in cathodes as well as nickel, if nickel becomes a constraint manufacturers will switch to aluminum. There is a lot of aluminum and graphite in the world, not sure if cobalt and lithium will become a constraint, but there is the possibility of recycling materials.
Tesla already recycle cells.
NAOM
Iron Mike,
That is a good piece, but as long as one makes reasonable interest rate assumptions, most of the points in the article point to LCOE for coal, nuclear and natural gas being too low relative to wind and solar for various reasons, the only exception to this is high capital costs upfront for wind and solar relative to some other types of generation. A higher interest rate as chosen by Lazard (8%) properly reflects actual interest rate conditions and in fact in today’s environment (very low interest rates) probably overstates the LCOE of wind and solar relative to other power sources.
There are no perfect measures. As long as appropriate assumptions are made in the analysis, LCOE works fine in my view.
In any case based on the paper you cited the analysis by BNP Paribas looks conservative if anything, keep in mind that it ignored the falling costs of wind and solar and low interest rates (which favor wind and solar). It is also likely that as oil demand falls and prices of oil falls there will be less associated gas produced from oil wells, this will tend to reduce the supply of natural gas and drive natural gas prices higher over time making wind and solar more competitive. In most advanced economies (Australia may be an exception) there are very few coal power plants being built and older plants are being shut down because they are no longer competitive. Soon this will be the case for natural gas power plants as well.
Yes regarding low interest rates, we can actually test how quick wind and solar projects grow. This is an ideal environment for their growth. Though the current low gas prices might compete with them in some places.
We’ll see in a couple of years or so.
Hey Iron Mike,
“I can’t see investment in solar and wind here on the scale needed for complete transition by say 2035-2040 for Australia, let alone the rest of the world. ”
I agree. In most of the world, there is no policy imperative to accomplish that. I don’t think most places will accomplish energy transition prior to a major shortfall in energy, related to fossil fuel depletion.
They’d prefer (unconsciously) to do things the hard way.
Australia will be able able to hang on for along time with nat gas and coal (CO2 aside), if it all doesn’t get exported. But most the world population is not so well endowed.
In a world that is falling short on fossil fuel, whats a good course of action, short of warfare?
My state, largest in the USA, has chosen to mandate pretty big increase in solar deployment. It doesn’t have great wind resource, except offshore. That may come in a decade or so.
Of course, we could just sit on on hands.
Large electric utilities in the USA do tend to look at long range cost of energy for decision making. LCOE is not theoretical to those who have to make these big decisions. This is why coal has dropped from about 40% to 22% of USA electricity generation in the past 6 yrs. Gradual retirement of coal plants, because the LCOE with coal is being trounced by NG, solar and wind. They don’t make these decisions based on short term price fluctuations.
Hi Hickory,
As usual you make some good points here.
With regards to LCOE, i am not alone in criticizing it.
I honestly don’t know what the future holds. Nobody does really. But it seems to me for a real transition to work, we have to scale down this so called civilization of ours. Like really scale it down. It seems we are playing the same BAU game but this time with “green” energy. Dangerous game to play in my humble opinion.
Agree.
Yet there is no recipe for ‘scale it down’.
No winning economic formula.
No long line of volunteers.
Iron Mike,
We may be able to walk and chew gum simultaneously, transition to wind solar and EVs while changing our demand for stuff.
In fact some changes naturally lead to others, it is possible that a decentralized power supply (as in rooftop solar) could lead to people being more aware of energy use and working hard to minimize that use, this might lead to other changes in behavior, as in using less stuff in general, buying quality goods that last, sharing goods with other in a sharing economy, recycling, having a garden in the backyard, buying local.
In addition, better education may lead to more equal right for women worldwide, better access to modern birth control for those that want to control family size. Generally where such changes have occurred the Total fertility ratio (TFR) has decreased and when it falls to 2.1 births per woman population growth eventually stops. When it falls below that level (as is the case in most advanced economies) population growth (if there were no migration) falls,
For planet Earth, if the TFR falls below 2.1 population will decline, assuming no interplanetary migration. 🙂
Some demographers expect this to occur around 2070 (Wolfgang Lutz).
https://en.wikipedia.org/wiki/Wolfgang_Lutz
“..if the TFR falls below 2.1 population will decline,…Some demographers expect this to occur around 2070 (Wolfgang Lutz).”
which is about 80 years too late.
Better late than never. If World TFR falls to East Asian levels (1.5 births per woman), population falls relatively quickly. This eases environmental damage.
I just did a small holiday trip with my family in my e-golf. Despite this being in Norway and Denmark with great charger facilities, it was extremely painful and at times stressful (also not very cheap). It is just ridiculous how much the range drops if you go beyond 50mph.
When my lease expires I will go back to petrol car. Until the (usable) range of electric cars has increased significantly their usability is limited.
It is just ridiculous how much the range drops if you go beyond 50mph.
Must be a problem with your e-golf! I got to drive my brother’s Nissan Leaf in Germany last winter, did fine!
Then there’s the Model 3… even at top speed it still gets decent range
https://www.youtube.com/watch?v=L8LLb4HXd_M&t=1609s
Model 3 hitting 262 km/h on German autobahn
Is that a 2016 or 2017+ model? Range was increased by about 50% in the later models. The following 2 reports do not seem to agree with your assessment
https://www.greencarreports.com/news/1091182_2017-volkswagen-e-golf-weekend-drive-report-and-range-test
https://pushevs.com/2018/01/28/volkswagen-e-golf-range-calculator/
A very strange feature from the VW web site for this car, not something you would expect on an EV
“Intelligent Crash Response System (ICRS)41
In the event of a collision that deploys the airbags,42 the ICRS can turn off the fuel pump, unlock the doors, and activate the hazard lights.43 It helps react if you might not be able to. ”
Spot the oddity?
NAOM
LOL! ICRS can turn off the fuel pump
Maybe it’s the version with the Flow Batteries…
Daniel.
How much was egolf? Tesla Model 3 is pretty nice, though expensive. The electricity was more than petrol?
I wonder if the prediction of large scale BEV adoption has already now a surprising effect on oil industry and oil prices. I am just thinking of the strategic game of a major OPEC oil producer. To present it binary, it has 2 options:
1. to reduce production in order to cause a high price of oil immediately;
2. to maximize production in order to sell most of the TRR of oil before the price will go down because of transition to electric vehicles.
The timing of transition to BEV is not known, but the fear that this transition will be fast is driving all oil producers to adopt strategy 2. This may be completely irrational, because the transition arguably takes a long time but the fear of stranded assets may be larger than the fear of selling oil too fast too cheap.
This dilemma is for all oil producers, including oil companies.
We may think again of what happened in 2014, as KSA decided for strategy 2, instead of reducing production to maintain oil above 100$/bl , even as it was an established fact for more than 3 years.
The rush to produce now more oil at any cost may delay the global peak oil temporary and produce a temporary glut, at the price of faster depletion.
Fortunately, is is already too late to put a drag on large scale BEV adoption, because fueling a BEV car is inherently cheaper than using gasoline and BEV cars are already affordable.
As you point out Alex, the timing is unknown, and is the big variable in all of this. My guess is that the period from about 2022-2030 will be an opportune time for oil producers. Demand will be high, with electrification of vehicles just beginning to leave a mark. Just a guess, as is all of this. Some guesses much more informed about it than others.
Other variables besides timing are also huge, like energy policy, relationships between countries, and production from Iran and Venez, for example.
Hickory,
I would say that one must consider the payback period for a well is typically 3 to 5 years, we will call it 4 years, so if prices start to drop in 2030 the prime period would be 2022 to 2026, though perhaps you have assumed oil prices start to drop in 2034, in which case I would agree that 2022 (perhaps 2024) to 2030 would be the sweet spot. Note long term projects such as oil sands or deepwater take 4-5 years from FID to production so really 8 years for those from start to payout and probably longer as wells are greadually drilled over time so maybe 20 year life for project, those projects may be hit hard by falling oil prices.
Option 3, save it for raw material use instead of burning it.
NAOM
I have to wonder how the perception of EV sales are influencing opinion writers and analysts by the disproportionate sales and penetration of EVs in California.
Overall, registrations are up across the board with several states more than doubling their 2017 numbers. Here are the top 10 states for EV registrations between January and December of 2018:
California – 153,442 (Up from 94,872)
New York – 15,752 (Up from 10,090)
Florida – 13,705 (Up from 6,573)
Washington – 12,650 (Up from 7,068)
Texas – 11,764 (Up from 5,419)
New Jersey – 9,230 (Up from 5,033)
Massachusetts – 8,990 (Up from 4,632)
Illinois – 7,357 (Up from 3,812)
Arizona – 7,086 (Up from 2,976)
Colorado – 7,051 (Up from 4,156)
Overall, 328,118 plug-in vehicles were registered through December 18. So California sells almost 50% of the EVs in the US. Is this because they have high income and 40k for an EV is chump change for them or is that they are more environmentally conscious or some other reason. Clearly California is a different world when it comes to EVs.
Also note that New York has a population about 1/2 of California (19.5 vs 39.5), yet their EV sales are 1/10 of California. Maybe excluding California numbers from various projections might provide a truer picture of where the EV market is headed.
https://insideevs.com/news/343555/ev-registration-by-state-tesla-model-3-brings-new-records-across-the-board/
I hate to admit it, because my old buddy HB lives in California and will have some fun out of me for doing so, if he hasn’t died or anything, but California is about five or ten years ahead of the rest of the country, politically and environmentally.
Note that the numbers increased year over year in all ten states by fifty percent or so. That is one hell of a fast rate of increase.
So California sells almost 50% of the EVs in the US.
Reality sometimes over rides ideology.
I googled US vehicle registrations and what I found was in 2017 there were 270.4 million privately registered vehicles in the United States. This number increased by about 6 million from 2015 to 2016, and by about 6 million again from 2016 to 2017.
Owning oil working interests, I do think quite often about EV. I have been surprised adoption hasn’t happened faster, since my first experience with a Tesla was in 2012.
I really don’t know what to think. They seem to make sense for those who live in urban areas and who do not have to make long driving trips on a regular basis.
For me, they don’t make sense yet. Due to my employment, location of family and living in a very rural area, I unfortunately put over 25K miles per year on my pickup truck. If the technology reaches the point where there are pickup trucks with 450 mile range and full charging that doesn’t take much longer than gasoline refueling, I see no reason why there won’t be much more rapid transition.
I just really don’t know what to think. I follow the Tesla story very closely too. Huge production increases. Huge financial losses. Similar to shale in those respects. Tesla has to be one of the most polarizing companies in recent memory.
So much uncertainty. To go along with a President who has no plan, shoots from the hip, tweets, etc.
Tries to shot from the hip, mostly I see it snagged in the holster, as he so often hits his feet. But, there is some accuracy in that. And his tweeting is classic Harpo Marx.
Shallow sand,
Amazon lost money for years. As Tesla reaches scale and stops growing so rapidly profits will be better.
Automobile industry is a tough business, even the largest producers don’t always do well. Also prices of EVs will come down.
You drive 450 miles on most trips? No stops?
Tesla Model 3 with 300 miles of range works fine in my very rural state. Maybe check out Rivian, though quite expensive probably 75k for 300 mile version.
Dennis, I frequently make trips to San Antonio from Ft Worth. About 270 miles, now I add on to South Padre. Almost all non stop. Fort Worth to Midland is 300 miles. Nobody stops for these. It’s a way of life. 300 miles for Texas is pretty useless. Been doing this for about 70 years, 16 of those I was just the passenger. Fort Smith to El Paso is about 900 miles, but you usually stay overnight once. Some don’t. When I was younger, I used to drive non stop from Okla City to Las Vegas, 1116 miles. And in my Navy days I made it to San Diego from OKC non stop. Over 1300 miles. 300 mile limit is fine for many. Probably not in Texas, or Okla, or many other Southern states.
Guym,
Doesn’t take long to charge a Tesla. Probably 150 miles in 15 minutes at supercharger.
You drove 1116 miles with no fuel stops or food breaks?
That is a brutal trip.
300 miles works nicely for me. I make a 250 mile trip routinely, not an issue.
So from Forth Worth in a Tesla Model 3 with 300 miles range I would drive to Austin super charger charge up and maybe grab a bite to eat, go to san Antonio, do my business, maybe hit Waco supercharger on way back or go back only to austin and charge there, would depend on if there are any destination chargers in San Antonio, would probably be tough to make it from Austin to San Antonio and back to Waco. Chargers are closer together where I live, I agree it could be a problem in Texas especially if you drive 80 on the highway, range is better at 70, better still at 65. Range may get longer over time.
Course there fuel stops, meals at 7-11. No biggie.
Beats the hell of trying to find a supercharger, and wait in line for that. And brutal is not being to make it on time. Missed connections, the brig, yadda yadda yadda.
GuyM,
I have never seen a line at a supercharger have you?
The navigation system automatically routs you to the supercharger if needed. Not as convenient a gas power I guess, but guess which car we choose to drive most? After driving a model 3, you don’t really want to drive anything else (unless one owns an S or X) 🙂
Not for everyone though, but my 2013 Camry XLE hybrid seems like a dog now, I was perfectly happy before owning the 3. First world problem.
Thats interesting. They got plenty between FT Worth and S Padre, or West Texas and NM? Not the last time I checked. If they at trying to be truly competitive with oil, they have to have a multitude between Ft Worth and Albuquerque.
@GuyM
You can see chargers on Google Maps, I can’t remember the precise invocation, I’m sure someone can add it.
NAOM
GuyM,
https://www.tesla.com/trips#/?v=MS_2017_75D&o=Fort%20Worth,%20TX,%20USA_Fort%20Worth%20Tarrant%20County%20TX@32.7554883,-97.3307658&s=&d=Albuquerque,%20NM,%20USA_Albuquerque%20Bernalillo%20County%20NM@35.0843859,-106.65042199999999
Also, motels are now installing Level 2 chargers so you can recharge overnight.
After purchasing an EV, I find that “range anxiety” is overblown and is replaced by planning ahead. PlugShare is my go to App for finding available chargers.
I keep reading in the paper where various governments and businesses are installing charging stations.
I’ve read where several people have driven their EV’s to Alaska and its not that difficult. A few years ago, it would have been a real challenge.
Dennis. I have to make a trip that is over 300 miles one way quite often. When I fill up my truck it shows a range in the neighborhood of about 450 miles. That is where I came up with than number.
I make a 900+ mile trip one way 1-2 times per year. I expect few do that. So I am definitely the exception.
I also haven’t owned a car since college. I have several different ways I use the bed of a truck.
This past winter I made the 300 mile trip when it was -10 F once. 50 miles from the destination, the interstate was closed due to black ice. Traffic was diverted. We sat still on the interstate for over 1/2 hour and then were diverted onto two lane roads. I had my heater on, of course.
I am the exception. I wrote that. I also wrote that for most urban people electric vehicles seem to make sense. In 2012 I thought they would be less of a rarity for me to see in 2019 than they are. Major cities, I might see one or two. 3,000+ driving vacation through national parks, I saw a total of six. I don’t go to California. Appears I would see many more there than in the Plains states/Midwest.
Amazon did lose money for years. Tesla has also lost money for years. Shale has lost money for years. I wrote I don’t know what to think.
IEA keeps trimming oil growth forecasts. 1.1 million per day 2019. 1.3 million BOPD 2020. Still is growth, even in the face of a tariff induced economic slowdown.
You have to admit there is much uncertainty.
It will be clearer in 3-4 yrs.
Many more competitive models will be appearing.
Batteries may get cheaper.
If was doing all those long drives,
I’d probably just try to keep driving what I have for the time being.
And keeping my eyes on the many models in the pipeline.-
When something like this gets cheaper, I’d be salivating.
https://www.caranddriver.com/rivian/r1s
shallow sand,
A 300 mile trip would require a stop. I realize a model 3 does not work well for many. Quite a few drive pickup trucks where I live, I have never been a fan, but clearly some people need them for work. Typically if you run the battery down to about 20% SOC it charges pretty quickly to 65% SOC. I imagine there are superchargers on freeways there and at some point there will be an EV pickup truck, first will probably be Rivian, then Ford, and maybe Tesla next. They will be pretty expensive, but there will be quite a bit of fuel savings, probably not worth the risk for a work truck.
I would think there might be a car in your family, though often everyone drives a pickup though really only one per family may be needed.
Have you ever driven a Model 3, my wife loves hers (she lets me drive it on weekends)?
shallow sand,
Absolutely agree, much uncertainty, Perhaps Tesla will never be profitable, hard to say, as I suggested it is a tough business. Amazon did turn the corner, perhaps Tesla will do the same.
Related
https://www.economist.com/business/2019/08/10/investors-flee-the-permian
Don’t know how this got missed. China has committed 77 billion dollars over the next five years to increase their domestic oil production by 50%. The 2019 expected production from their current fields is 3.95 mbpd. So their goal is to raise that to 6 mbpd and they’re spending serious money to do it, though let’s note that this is purely domestic so the Yuan that will pay their workers can come from the PBOC and not necessarily from the National People’s Congress.
I have a vague recollection that we examined the geology in the northeast part of the country and I don’t recall any talk of shale, or of magical Recovery Factor augmentation that was even being discussed at the time. So one can only conclude that they’re going to make that oil flow at a loss. There is certainly precedent for that.
Very strict attention should be paid to this. It is Chinese oil scarcity that is most likely to start the wars upcoming. The flow to Japan is just too convenient for grabbing and that event has fairly significant trigger potential.
So this could buy them time. About 2.3 years, before their consumption growth rate eats up that extra 2 mbpd. Ha. I should rephrase that. Since their plan is to get that extra 2 mbpd over 5 years it will already have been eaten up by the time it flows.
Watcher
Do they know where the oil is or do they have to find it. Also, any idea if they are going back to known fields and will re-drill with horizontal wells and water injection.
the article said they will “invest in currently producing fields” which is always euphemism for going after oil not thought to be economical originally. Horizontal drilling is not magic and there would be no need to do it in a conventional non shale field. Yes, augmented recovery is being done but that doesn’t have to mean water drive or CO2 or anything else.
If you’re throwing 77 billion at your oil field, you can flow oil from smaller aggregates of porosity that you did not bother with before. When you have to have it, and you do have to have it, you go get it. That 77 billion can come from the PBOC. Who is going to care?
The article is in forbes if you wanna go find it.
The dollar figure (a lot) vs. time (not much) means they’re going to ignore economics with massive enhanced oil recovery and probably mass drilling of less valuable areas.
It will be an interesting exercise in how much higher prices will slow down the decline from peak. Ignoring cost is the same as saying it is very lucrative.
‘It is Chinese oil scarcity that is most likely-‘
this explains much of their actions in the S. China Sea, and Belt/Road initiative.
They get their imports through the same channel as Korea, Japan, Taiwan, Phillipines, Viet Nam,
and these countries are much more heavily dependent on imported oil than is China. China is depleting.
I totally get why people are bonded to the idea of electric cars and how solar will save the day.
I just can’t find anything in the numbers (yet) to suggest that’s a realistic hope to have.
We could begin by noting that output from sun and wind have indeed grown really fast of late, it’s just that fossil fuel use has grown even faster, making the gap between the two the widest it’s ever been (and currently getting wider). See image below.
(source for image below: https://www.nationalobserver.com/2019/07/31/opinion/fossil-fuel-burning-leaps-new-record-crushing-clean-energy-and-climate-efforts)
Or we could also observe that EV’s and solar panels and wind towers don’t just magically appear. They require an enormous amount of energy to conduct the mining, manufacturing and transportation from factory to installation, virtually 100% of which happens to come from fossil fuels.
According to a Manhattan Inst. article in the WSJ recently (I know, I know, two suspect sources, think of the spin, etc.) there’s this to consider:
“A single electric-car battery weighs about 1,000 pounds. Fabricating one requires digging up, moving and processing more than 500,000 pounds of raw materials somewhere on the planet. ”
Imagine if you had to personally move that 500,000 pounds yourself? I think you’d better appreciate the scale of the problem and the energy involved.
At any rate, I remain skeptical because every single thing we do requires an amazingly complex economic structure, and that itself depends on surplus energy to persist. I know of zero (0) examples of a rebuildable alt-energy system (hit tip Hagens) having produced the energy used to for its replacement.
Until we conduct that experiment, we don’t know jack shit.
Hey, maybe the output from solar panels is more than sufficient to fund the expansion of the existing economy, pay back the prior debts and investments, and also it’s own replacement. Or…maybe it’s not. I find it thoroughly ridiculous that we don’t have a proper and detailed understanding of that because, well, everything hinges on the answer.
Also, for your Sunday reading pleasure, my latest which covers the intersection between the (exponential) economy and energy, oil specifically: https://www.peakprosperity.com/the-hard-truth/
Hey Chris,
on a micro level, my home PV system up front price paid includes all the manufacturing , materials, energy input costs etc. Even with all these inherent costs, the system will likely be producing energy for 20-40 yrs beyond its payback time.
I’ll take that deal.
Same scenario with utility scale solar PV, except better since the price/installed watt is lower at scale.
Secondly, if we don’t take that route (wind and solar energy on mass scale), what do you propose to replace the energy that will be lost by fossil fuel depletion?
Hickory – I’m trying to not confuse costs with energy. Separate concepts. Shale might be our current version of Easter Island, I suspect. The subsidized costs sorta almost pencil out. A full accounting would very likely show otherwise.
It may make dollar sense for you to have solar on your house. But that doesn’t mean you’ll get replacement panels when those wear out in 20 years because your panels fed enough back into the system to allow that to happen.
My solutions?
1 – Use less. All buildings should be built and retrofitted with max insulation, and designed to last hundreds of years.
2 – no more concrete with rebar, especially untreated rebar. Use spun basalt or some other equivalent material.
3- Public transportation. Rebuild and electrify the entire public transportation system. If you like EV’s you should love electric trains and buses. Make it dead easy to use and far more convenient.
4 – Rebuild the soils. Stop all soil destructive practices, and start recycling nutrients. It can be done, and it needs to be done.
5 – No more use of ancient aquifers to irrigate foods. Just stop already. If you can’t grow what you want to grow with the rains that fall there, grow something else.
6 – Align incentives. Give everybody a booklet of coupons (or their electronic equivalent) that entitles them to buy a certain allotment of fossil fuel energy. Want to burn more than that in your yacht? Great, go buy them from somebody. Want to live with your ageing partner in a 12,000 square foot house kept at a constant 68 degrees? Great, go buy enough energy stamps from someone to allow you to do that. Want 6 kids instead of 2? Sorry, the energy allotments were made in 2019 and fixed which means that your kid’s energy allotments are going 1/3rd the size of your neighbor’s 2 kids. Tougher going for them. Each year there would be fewer and fewer energy stamps on the market because depletion (and climate). People’s actions and the prices would now be aligned and sooooOoooo much changes without any apparent regulatory effort at all.
Stuff like that.
I am not a believer that we can keep our suburban, nuclear family, happy individual motoring deal going by some other means. Changes are coming. Best to reorient now while time remains.
Chris,
-lets assume that all the major solar PV manufacturers are including all the energy costs of production in their product pricing. This includes the whole chain, from mining of the minerals to AC for the secretaries. If this assumption is correct, the energy necessary for the PV production is small compared to their lifetime electricity output. Nothing complicated here.
If the assumption is wrong, and the companies are all not even recouping their energy costs in the PV product at time of sale, then the whole industry would be bankrupt and gone by now. Rather, it is a thriving industry.
-PV panel efficiency degradation is average 0.8%/yr. No need to replace at 20 yrs. Some premium panel manufacturers like LG offer better warranties (87% after 25 years) .
As you say- ” Best to reorient now while time remains.” Agree- and in my mind, part of that is getting our shit together on energy, and deploying renewables.
Chris
On the graph you presented, the green energy bounds together nuclear, hydro, wind and solar.
This masks the steep exponential growth of solar and wind energy in last years. The potential for solar is practically unlimited and its cost went down steeply in last years. The solar energy is competitive now in price with coal , natural gas and oil. So, it’s expected that its exponential growth shall continue.
Alex,
you lost me on that one. If anything, given the number of hydro and nuclear put in by China that should only have helped close the gap.
Meanwhile, being a numbers buy, I wonder what your reaction to his might be?
++++++++++++++++++
London and New York, July 10, 2019 – The first half of 2019 saw a 39% slowdown in renewable energy investment in the world’s biggest market, China, to $28.8 billion, the lowest figure for any half-year period since 2013, according to the latest figures from BloombergNEF (BNEF).
The plunge in activity in China, as the country shifts this year away from government-set tariffs to auctions for new wind and solar capacity, also depressed the 1H 2019 global investment figure – to $117.6 billion, down 14% compared to the first half of 2018.
https://about.bnef.com/blog/world-clean-energy-investment-slips-1h-2019-despite-billion-dollar-financings-solar-dubai-offshore-wind-taiwan/
++++++++++
It’s very hard for me to make the case that the exponential explosion you speak of will somehow materialize without corresponding investment.
Instead we might fully expect a saturation curve to materialize as the best wind spots get taken and the amount of solar that can be incorporated becomes limited by a lack of battery storage, and such because of the intermittency issue.
Maybe you know differently, but the load engineers I talk to tell me that there are real, practical limits to how much solar can be employed across a grid.
Yes, the exponential took a pause in USA and China in the last year or so…
Still, the low cost for PV electricity is compelling. I guess ( hope ) that the pause is only conjunctural.
https://www.cia.gov/library/publications/the-world-factbook/geos/ch.html
China had in 2017 nuclear 2%, hydro 18% and other renewables 18% (of installed power).
Chris,
As costs go down fewer investment dollars needed.
It is output that matters not dollars world growth last 7 years about 29%/year for solar consumption.
Chris’ original point still stands. No one anywhere, ever AFAIK has ever built a solar panel or wind turbine using only power from solar panels or wind turbines. The underlying assumption about future energy supply seems to be that we can transition off of fossil fuels onto renewables yet we have absolutely no working examples of doing this in the real world.
It seems far more reasonable to me to expect that we will have a mix of renewables and continued strong use of fossil fuels at the same time.
Also one thing being totally overlooked in these discussions is the limitations of the physics of turning diffuse (wind, solar) energy into more concentrated / useful forms and the massive variability of doing so at different physical locations on the globe.
For example – taking figures from David MacKay’s book “Sustainable Energy – without the hot air” if you cover 10% of all land in UK with wind turbines you get 20 kW/h per person. This would require constructing twice the number of wind turbine currently in existence in the whole world.
Then turning to solar you can get 5 kW/h per day per person (but only if you dont use the 10 m2 of roof space for solar heating instead) if you want to get real energy and go to solar farms to get you 50 kWh/day/person you need to cover 5% of all land in 10% efficient (low efficiency due to mass production) of UK with panels. This number of panels equals 100x the number of solar panels in existence in the whole world.
And still even if you could do this that gets you 70 kWh/day/person and this is still well less than the 125 kWh/day/person consumed on average by folks in the UK. Note that in USA and Australia the consumption is much much higher like 200 to 300 kWh/day/person.
Is it realistic to think any country is going to agree to cover 15 to 20% of their total land mass in solar panels and wind farms? Please, just putting a few wind farms in place faces massive resistance even today.
Converting over to using EV’s will likely help in the overall picture but like Chris I am hugely skeptical that we can transition significantly off of fossil fuels AND still live our extravagant / wasteful modern lifestyles.
BTW – if you want to check the numbers I quote above from David MacKay’s book there is an online version of the whole thing https://www.withouthotair.com/reviews.html
NOTE: David was a PhD physicist, professor of engineering at Cambridge University and Chief Scientific Adviser to the UK Department of Energy and Climate so I tend to believe his numbers and calculations Changehttps://en.wikipedia.org/wiki/David_J._C._MacKay
“Also one thing being totally overlooked in these discussions is the limitations of the physics of turning diffuse (wind, solar) energy into more concentrated / useful forms”
These guys don’t seem to have any problem doing that:-
https://en.wikipedia.org/wiki/List_of_photovoltaic_power_stations
NAOM
I’m not an engineer, or a physicist, but I THINK I understand the basic limitations involved in adding solar ( AND or wind power) to any given grid.
The limitation that was thrown out up until maybe two or three years ago by all the naysayers was the need for “hot spinning reserve”.
There is a need for hot spinning reserve, meaning some fossil fuel plants fully heated up, with the boilers popping off, so that the operator ( there is an operator, but he just LOOKS at the instruments, mostly, and the plant mostly governs itself) can go from what we farmers and lots of other people call fast idle to full throttle, in a matter of a few seconds or minutes.
This reserve is ALWAYS needed, because any conventional plant or nuke can and does eventually go down. Breakdowns are a fact of life. MORE hot spinning reserve is needed, with lots of wind and solar power, for now. Later maybe LESS will be needed, because a large enough wind and solar powered grid will always be producing SOME power, and wind and solar farms are not so large that losing any one of them , or even two or three, to unexpected problems is a big problem. .
The need for this hot spinning reserve is declining, as a percent of the total load on the grid, because weather forecasting has improved substantially, and because the control systems of newer conventional plants work more accurately and faster, and BECAUSE there are more gas and more gas PEAKER plants around now, and gas plants, and especially peaker plants, can rev up on short notice.
As a matter of fact, I haven’t even SEEN hot spinning reserve mentioned in any debate about wind and solar power within the last few months, maybe even for a year.
So it seems that the argument about “just so much solar power” is based on the engineers’ BOSS, the bean counter/ corporate manager. HE has to maintain enough fossil fuel and or spare hydro capacity to make up not only for sure to happen at the worst possible time outages at ff plants and nukes, enough to be sure there will always be plenty of juice on a hundred degree afternoon when the air is dead still and it’s cloudy.
Sometimes management is already working on a razor thin reserve margin, and occasional rolling blackouts are not unheard of. No siree!
Maintaining those big assed old fossil fuel plants cost a hell of a lot of money and the only hope for doing so profitably is to utilize them to the extent possible.
A half truth propaganda campaign about the lights going off is very helpful when it comes to convincing the customer that more solar and more wind are a BAD idea.
And of course pretty soon we will have cost effective super batteries of the sort Tesla builds, at most electrical utilities, which will make it EASY to balance the load for a few minutes while the operator revs up some gas and puts the pedal down on a coal plant running at say half capacity.
They used to say fifteen or twenty percent was all that can be dealt with.
It’s easy to find references today documenting far higher penetration , even above forty percent, without any problems whatsoever. Even higher than that.
Once we have more and better long distance transmission lines, and MORE wind and MORE solar farms, the easier it will be to ramp up to fifty sixty seventy eighty, and yes EVENTUALLY one hundred percent wind and solar power.
But I expect that SOME gas and coal fired plants will be kept ready to run, standby, for thirty years at least, even in a country such as the USA.
The less often they are run, the less of an issue pollution associated with them will be, and in a forum such as this one, we all know about the LAW OF DIMINISHING RETURNS.
Building out that last big chunk of wind and solar capacity, which will SELDOM be needed, to cover a really rotten wind and sun day, will cost a HELL of a lot.
It will be much more sensible to spend all THAT money on something OTHER than wind and solar farms that will be needed only at long intervals for short periods… say on subsidizing the retrofitting of older houses and buildings for energy efficiency.
Or maybe not. Maybe batteries will get to be cheap enough that battery back up will be cheaper than maintaining some ff plants as last ditch backup capacity.
The industry is predicting solar/wind + batteries to be cheaper than all but the cheapest gas plants by around 2022. The UK national grid could have done with some more batteries but they have been under pressure to cut investment – they just paid for it.
NAOM
Hey, maybe the output from solar panels is more than sufficient to fund the expansion of the existing economy, pay back the prior debts and investments, and also it’s own replacement. Or…maybe it’s not. I find it thoroughly ridiculous that we don’t have a proper and detailed understanding of that because, well, everything hinges on the answer.
Actually it doesn’t! It hinges on the viability of the multiple interconnected earth systems that support healthy ecosystems. Every known economy is just a subsidiary of ‘Ecosystems Inc’.
So at the end of the day, if we are truly honest, given the current ecological overshoot in which find ourselves, the risks we face due to climate change, and a high likelyhood of being in the 6th mass biological extinction event, none of which bode well for the continuation of industrial civilization, clinging to a hope that this, that or another technology will present itself as our ultimate saviour, is probably not very realistic.
We probably should have done a full political, social and economic system reset 50 years ago. I’m afraid the bills are coming due and now Mother Nature will collect and then do the reset for us!
As she is the sole proprietor of Ecosystem Inc. and doesn’t have any obligations to any shareholders
Cheers!
You seem to be under the impression that IfCE vehicles are made from pixie dust and unicorn farts with the fuel supplied by flying monkeys. Have you noticed that PV manufactures and the Gigafactory are covering their roofs with solar cells? They are eating their own dog food. Yeah, it will take a little while to fully transition but it is something we should have started a long time ago and need to be going at like the clappers.
NAOM
Hi Chris,
Just because something has not been done does not mean that it cannot be done. There was a time when very little energy for the World was provided by oil, natural gas, and coal and one could have argued that they would never amount to much in the future.
In 1990 12.3% of fossil plus renewable and nuclear came from non-fossil fuel, in 2018 it was 15.2%, if we look at wind and solar, the growth rates have been rapid for the past 10 years. If these rapid growth rates continue, the proportion of total energy provided by non-fossil fuel will be significant by 2035 at about 49% of the total. The proportion is likely to be greater due to a peak in oil output in 2025, though potentially use of coal and natural gas might increase as oil use declines. By 2035 it is likely that all fossil fuel use will have peaked and the use of solar and wind will continue to grow to fill the gap in declining fossil fuel output.
An alternative projection is to look at the linear rate of growth of primary energy consumption for the past 10 years, if we assume that rate continues to 2035 and solar and wind continue to grow at the 2011 to 2018 rate of growth, then solar, wind, hydro, and nuclear provide 83.5% of primary energy consumption in 2035. It is assumed both hydro and nuclear consumption are flat at the 2018 level and wind grows by 15% per year and solar by 29% per year. Primary energy grows by 219 Mtoe per year (2009 to 2018 rate of growth).
Dennis,
(Posting again here as I posted above earlier in the thread but am not sure you will see it)
Chris’ original point still stands. No one anywhere, ever AFAIK has ever built a solar panel or wind turbine using only power from solar panels or wind turbines. The underlying assumption about future energy supply seems to be that we can transition off of fossil fuels onto renewables yet we have absolutely no working examples of doing this in the real world.
It seems far more reasonable to me to expect that we will have a mix of renewables and continued strong use of fossil fuels at the same time.
Also one thing being totally overlooked in these discussions is the limitations of the physics of turning diffuse (wind, solar) energy into more concentrated / useful forms and the massive variability of doing so at different physical locations on the globe.
For example – taking figures from David MacKay’s book “Sustainable Energy – without the hot air” if you cover 10% of all land in UK with wind turbines you get 20 kW/h per person. This would require constructing twice the number of wind turbine currently in existence in the whole world.
Then turning to solar you can get 5 kW/h per day per person (but only if you dont use the 10 m2 of roof space for solar heating instead) if you want to get real energy and go to solar farms to get you 50 kWh/day/person you need to cover 5% of all land in 10% efficient (low efficiency due to mass production) of UK with panels. This number of panels equals 100x the number of solar panels in existence in the whole world.
And still even if you could do this that gets you 70 kWh/day/person and this is still well less than the 125 kWh/day/person consumed on average by folks in the UK. Note that in USA and Australia the consumption is much much higher like 200 to 300 kWh/day/person.
Is it realistic to think any country is going to agree to cover 15 to 20% of their total land mass in solar panels and wind farms? Please, just putting a few wind farms in place faces massive resistance even today.
Converting over to using EV’s will likely help in the overall picture but like Chris I am hugely skeptical that we can transition significantly off of fossil fuels AND still live our extravagant / wasteful modern lifestyles.
BTW – if you want to check the numbers I quote above from David MacKay’s book there is an online version of the whole thing https://www.withouthotair.com/reviews.html
NOTE: David was a PhD physicist, professor of engineering at Cambridge University and Chief Scientific Adviser to the UK Department of Energy and Climate so I tend to believe his numbers and calculations Changehttps://en.wikipedia.org/wiki/David_J._C._MacKay
” The underlying assumption about future energy supply seems to be that we can transition off of fossil fuels onto renewables yet we have absolutely no working examples of doing this in the real world.”
In the early days, iron was smelted with charcoal,with WOOD. It was quite sometime before the iron industry switched to coal. No doubt we will use coal, gas and oil for decades to come, and we will be using a hell of a lot of them to build out wind and solar capacity.
There’s no reason in principle to believe we can’t giterdone, but it WILL take some time, probably at least forty or fifty years.
“cover 10% of all land in UK with wind turbines you get 20 kW/h per person.”
How much of the UK is already converted to roads, buildings, pastures, cropland?
The people of the UK will do what they HAVE to do to get along, as will everybody else.
“5 kW/h per day per person (but only if you dont use the 10 m2 of roof space for solar heating instead) ”
Insulation is WAY cheaper than energy, long term. The people of the UK have the crappiest houses in the modern western world, as best I can find out, in respect to heating and cooling them economically. Comes from having all that coal, a century ago, I guess. They will FIX the insulation problem, because they won’t have any choice, except freezer or bake, if the climate goes nuts. Fixing it will be WAY cheaper than providing energy to be wasted trying to heat houses that aren’t even up to the standards of fifties era Yankee houses.
“go to solar farms to get you 50 kWh/day cover 5% of all land in 10% efficient ”
I don’t think anybody even makes ten percent efficiency panels anymore. Figure twenty percent average over the next five or ten years production MINIMUM.
The UK has a rotten solar resource. Wind and solar power can be built both on the same tracts of land. Farmers grow corn and graze cows routinely on wind farms. Grass and corn do NOT grow in serious shade. The turbines don’t throw all that much shade.
Plus they’ll be building wind farms out on the nearby sea, where the wind blows harder and steadier…. and the fish will LOVE the new habitat. Wrecks are the best places ever to find fish, at least in moderate numbers.
Hardly any modern western country has a worse solar resource. . They’ll get their juice via HVDC from the Med area maybe…… or maybe most of them will simply EMIGRATE, if they can’t live comfortably there anymore. I believe the UK is already up to its ass in alligators in respect to producing enough food and must export SOMETHING to pay for imported food.
“125 kWh/day/person consumed on average by folks in the UK.” “USA and Australia the consumption is much much higher like 200 to 300 kWh/day/person.”
ALL of us, excepting maybe a few Trump types, will learn how to live on a hell of a lot less, and we CAN do so, and live just about as well, and even better. If I were a young guy again, I could fix things at my house to use half as much, maybe even a quarter as much, and save a lot of money, long term, by doing so, and live just as well or better. Too old to bother now though.
Is it realistic to think any country is going to agree to cover 15 to 20% of their total land mass in solar panels and wind farms?
SURE as hell it is, ONCE the choice is between staying warm, staying cool, having a refrigerator, tv, computer, and yes, an electric car as well……… or doing WITHOUT.
David MacKay’s book https://www.withouthotair.com/reviews.html
This book is TEN YEARS out of date. Probably longer than that, considering that he probably researched and wrote most of it even earlier.
NOTHING in it is even half right, as of today, in terms of how much renewable energy costs.
A hell of a lot of competent and highly respectable peopledon’t have much if anything to say when it comes to admitting how far wrong they were ten years ago.
He’s dead, and a quick search shows that his LAST book was copyrighted in 2008.
OFM
“NOTHING in it is even half right, as of today, in terms of how much renewable energy costs.”
Err – he did not really discuss how much renewable energy costs. That was the smart part of his book IMHO – he pointed out that setting aside cost the massive amount of land needed to support current energy consumption rates was substantial and there are hard physics based limits to taking that much above those existing thresholds.
Also the point about nobody makes 10% energy efficiency solar panels is fair enough – if you read that section on solar he was only using that number when speculating that if you were going to need to do a mass production run to generate double the current number of solar panels in existence in the world for each country (e.g UK) it’s unlikely you could do that at the highest efficiency rate. I took his word for it not being an expert in these things. But fine, even if you make then 20% efficient it still is a massive amount of land you need to cover which itself presents a practical conundrum AND it is a fact that you dont get anywhere near the current consumption levels.
Point taken that you are extremely optimistic about how everyone will do what they have to do. I rather think we will hit several brick walls and go down a slowly declining ragged descent towards a much lower energy consumption level that will be nowhere near current levels.
You also point out that the book is nearly 10 years old and that somehow makes his arguments obsolete. I beg to differ – again the arguments are well thought through, supported by figures and workings, and based in the limitations of physics, which were his area of specialty and expertise.
If everything is so much better since he wrote the book then why, as Chris’ original post points our is our consumption of fossil fuels continuing to increase year over year? Why have people not done what they have to do in that timeframe?
Cheers,
otp
Just been checking up those numbers myself and you are right. Total and utter bullshit. An 11 year old book using data from the early 00s, things have moved a LONG way since then. Even the consumption figure is an order of magnitude out. That comment is just a gishgallop of fake ‘facts’ from a troll, probably a paid shill.
NAOM
noam,
Ok care to provide a source that shows the energy consumption
– note that is all energy not just electricity but energy consumed for agriculture (food farming), heating and cooling, electricity, light, manufacturing and mining – is an order of magnitude out that also provides, like this book, actual working figures to back up the claim?
Are you claiming I am a paid shill or the professor is? Either way seems pointing out these data points has hit a raw nerve with you. Please note I am not saying renewables are useless or we should not try to use them jus that the current narrative that we could *easily* switch to renewables if we just got on with the job does not gel with the numbers in my opinion.
There is absolutely no way you could have even read and absorbed a chapter of the book in the time since the post so I would say you are criticizing without having bothered to read the supporting evidence. Does that make you a paid shill for the renewable companies?
otp
Try Googling UK electricity generation. Try Googling UK population. Divide first by second. QED
Oh, while you on Google, try checking the other numbers too, you will see that a LOT has changed from the early 00s till today so don’t base your projections for the future on ancient data.
NAOM
Noam,
I am not talking about only electricity generation. The numbers quoted in the book are for all energy consumed not just electricity but energy for for agriculture (food farming), transportation, heating and cooling, electricity, light, manufacturing and mining.
Do you have a reference that talks about that? Pointing only to electricity misses the point he was making entirely.
otp
There is absolutely no way you could have even read and absorbed a chapter of the book in the time since the post so I would say you are criticizing without having bothered to read the supporting evidence. Does that make you a paid shill for the renewable companies?
Don’t know about anyone else, but I read that book a long time ago! I have also followed the development of the relevant technology in solar, wind and storage over the last decade. Most of what is discussed in the book is obsolete knowledge. It seems you have a lot of catch up reading to do! Though admittedly that doesn’t mean renewables can save us or allow us to continue with BAU, that however is a separate dissertation!
Cheers!
For anyone interested I found a source that provides numbers for Total Primary Energy Supply (TPES) per capita from world bank sources https://en.wikipedia.org/wiki/List_of_countries_by_energy_consumption_per_capita rather than just electricity consumption which seems a better surrogate for total energy use per capita.
Seems UK has done really well in reducing the TPES total energy use on per person / day basis. Used to be over 100 in 2003, down to 87 kwH per person / day in 2014. Quick google did not lead to any clear explanation
Hopefully this page will be updated with later figures for more recent years soon or someone else has a better source for later/better numbers.
Strangely Germany, despite it’s reported strong move to renewables was using pretty much the same in 2014 as it was in 2003.
USA 220 kWh/person/day
Australia 174 kWh/person/day
China increase from 57 kWh/person/day in 2003 to 70 kWh/person/day on 2013 as their middle class grows. Suspect same as China will happen in all countries where middle class is still being established.
Interesting.
TPES= “This is not the consumption of end-users but all energy needed as input to produce fuel and electricity for end-users. It is known as total primary energy supply (TPES), a term used to indicate the sum of production and imports subtracting exports and storage changes ”
It would interesting to see a country comparison of TPES vs energy consumption. There could be some surprises.
Here is very informative site- https://ourworldindata.org/energy-production-and-changing-energy-sources
They have an interactive graphic that you can sort by country to see their energy mix over time [Long-run view for single countries]
In Germany, the use of oil increased during this time. So the overall energy stayed the same.
“Is it realistic to think any country is going to agree to cover 15 to 20% of their total land mass in solar panels and wind farms? “
Many countries will build (more) wind farms off shore. However they neither will maintain the ‘ever lasting growth’ where the current economic system depends on. Global population growing with 80 million/year. Five times the inhabitants of the Netherlands or 25% of those of the U.S.. Each and every year. Though most of them with a future carbon footprint much less of many living in the two mentioned countries.
Regarding EV increase I wonder if the many hundreds of millions who live in skyscrapers easily will consider buying one, even if sufficient chargers are available nearby. I would stick to the trusted system as long as possible in that case. Possibly the much lower maintenance costs will do the trick for some.
The existing plans for building new mega airports don’t take into account Peakoil to happen in the coming decades at all. All is focused on rapid growth.
The increase of the middle class in China and India has ‘just’ started. Some African countries are waiting to get piece of the cake…soon.
So, massive increase of solar panels, wind farms and EV’s will help, but this expansion should have started long time ago. And even then.
Geniuses are talking about and planning getting rare earth metals from the moon, from Mars. Go figure !
“Is it realistic to think any country is going to agree to cover 15 to 20% of their total land mass in solar panels and wind farms? “
Have you ever been to a typical city anywhere on earth?! There’s a lot of available roof top space and parking lots that could be covered…
https://heatisland.lbl.gov/publications/analyzing-land-cover-urban
In downtown Sacramento, the top view (above-the-canopy) shows that vegetation covers 30% of the area, whereas roofs cover 23% and paved surfaces (roads, parking areas, and sidewalks) 41%. In the industrial areas, vegetation covers 8–14% of the area, whereas roofs cover 19–23%, and paved surfaces 29–44%. The surface-type percentages in the office area were 21% trees, 16% roofs, and 49% paved areas. In commercial areas, vegetation covers 5–20%, roofs 19–20%, paved surfaces 44–68%. Residential areas exhibit a wide range of percentages among their various surface-types. On average, vegetation covers about 36% of the area, roofs about 20%, and paved surfaces about 28%.
Not to mention a lot of agricultural land could be dual use as well!
https://civileats.com/2019/01/22/agrivoltaics-solar-panels-on-farms-could-be-a-win-win/
Hey Fred, the 15 to 20 percent of land is ridiculous. Why do you guys fall for such outrageous claims?
If we were to stick with the stupid power use of today, just the land used by coal mines, oil production and refining as well as gas production would more than produce enough energy.
Even Forbes published that we could power the world with 1 percent of the area of the Sahara.
https://www.forbes.com/sites/quora/2016/09/22/we-could-power-the-entire-world-by-harnessing-solar-energy-from-1-of-the-sahara/#3f35037dd440
And that is not including the large energy efficiency gain from using electric power versus carbon burn.
Of course I do not expect we will be able to continue the current ways and demands of civilization into the future, so energy demand will drop, like a rock anyway.
Hey Fred, the 15 to 20 percent of land is ridiculous. Why do you guys fall for such outrageous claims?
Yes, I actually know that but his claim is even more outrageous when we take into consideration that most places already do cover significantly more land with other things and those surfaces can be covered with solar. Making it unnecessary to cover even more land for that purpose alone.
It is a bullshit strawman argument pure and simple!
Offthepools,
And as I said, the fact that something has never been done does not prove that it never will be in the future. One could have made the same argument about any fossil fuel in 1700, such an argument has been disproven today, just as Chris’s (and your) argument is highly likely to be disproven by 2100 (and possibly by 2050).
Dennis,
Fair enough – I guess we will just have to wait and see. I hope the optimists are all right and my concerns are unfounded. Suspect reality will fall somewhere in the middle.
otp
otp,
My standard way of thinking is that reality tends to fall between the optimistic and pessimistic viewpoints. So on that we agree, you may think reality will be closer to the pessimists and I may tend more towards the optimists. Part of this for me is that adoption of technology in my lifetime has always occurred far more rapidly than I imagined when a new technology began to enter the mainstream economy. In other words, in the past I have been pessimistic and wrong, so I have tried to adjust.
Chris, I agree with most of your points. It is very difficult to build our way out of this situation, probably impossible.
Just living lower, healthier, driving less, being more efficient will accomplish more than replacing all the energy with renewables.
Heck, just cutting out meat and dairy products from our diets will do more for the energy and ecosystems than converting to EV’s and PV.
It’s also so easy to do and costs less. No need to build anything, just eat differently.
We certainly do not need to grow corn to burn in our fuel tanks.
However, we still need to consider the upper boundary of GHG emissions. It is probably around 2 Gt to bring the rise rate down to PETM levels in the long run. So building out a necessary amount of PV and wind while collapsing our demand makes sense.
Your graph shows how legacy industry and politics have overridden the buildout of efficiency, reduction, and renewable energy. Those are social decisions that we and the young people of today will strongly wish were otherwise.
Dennis,
I guess the price of oil cannot be expected to drop below producers marginal cost of extraction for any sustained period of time. Probably at too low price tight oil, deep water oil , oil sands and polar oil shall be out of game. Not only this, but I have seen hints that Aramco is profitable only for price over 40$/bbl ( probably in this case some rent/ taxes included ).
In current dollars, the price of oil averaged over the years in 20th century was over 20$/bl .
For the last 15 years , the average price was over 60$/bl .
2018 Aramco was the most profitable company on earth.
https://www.ft.com/content/f6a93762-551c-11e9-91f9-b6515a54c5b1
At 70$/bl in 2018 they had EBIT of 60% . That implies a production cost of 28$/bl .
I don’t understand the discrepancy with the 10$/bl presented in the same article. By the way, they present production costs in excess of 20$/bl for most OPEC members.
Alex,
Can you tell us what those costs are for the big producers (KSA, Kuwait, Iran, Iraq, and UAE)? I don’t subscribe to FT.
Dennis,
I have only seen before the FT link. Neither do I have subscription.
As I remember, they presented KSA with lowest cost of oil extraction, at 10$/bbl . Other OPEC members they listed , Iran and Iraq were slightly above 20$/bbl and Nigeria about 30$/bbl.
But I found anew an old reference , written by Robert Rapier:
https://www.forbes.com/sites/rrapier/2019/04/01/saudi-aramcos-breakeven-oil-price-is-higher-than-expected/#3d7c2e981c02
By the way, WSJ has other guesswork numbers, completely different:
http://graphics.wsj.com/oil-barrel-breakdown/
Thanks Alex.
Rapier thinks about $40/b for KSA to breakeven, his analysis tends to be pretty good, WSJ, less so.
That suggests$40/b should be the minimum price that oil can fall to in the long run, below this price for any long period should result in output that is negligible.
By the way, WSJ presents cost of US shale, oil & natural gas at 23$/bbl, of which capex at exactly 7.56$/bbl !!!
Enno presents US shale with 112000 wells and cumulative production of oil of 11.3 billion bbl, average cumulative production per well at about 100000 bbl. Supposing only 5 million $ per well drilling and fracking costs, the capex till now is over 50$/bbl. Of course, many wells are for natural gas and most wells are still producing. Even so, the discrepancy is mind boggling. So much for second hand data reliability.
Alex,
That estimate is BS, as I suggested earlier, WSJ does not seem to have very good economic analysis.
To present the inverse problem, knowing that “shaleprofile” presents actual data and supposing WSJ also presents true data, what is the implied shale well cost to conduct to $7.56/bbl capex.
The data are as follows: tight oil production/month is about 200 Mbbl.
I suppose the number of new wells/month for steady-state production is around 756 wells/month .
The total capex/month : 200 000 000 * 7.56 = 1.512 billion $
The implied result is : around 2 million $/new well , drilling and fracking.
Unless we count together shell oil & gas: the monthly production is 470000000 BOE , the total capex 3.55 B$ and about 4.7M$/well.
We must keep in mind that 1 BOE of NG ~= 6Mcf ( energy equivalent ) has the $ value of a quarter of bbl of oil. There are much oil wells than gas wells and the gas wells are much more productive in energy terms, but not in $ terms.
So , WSJ may be right on average, but it is confusing.
Alex,
You may be right, I have heard claims that OPEC can produce at $20/b, but if not then yes marginal cost should determine the price of oil. I don’t know what that cost would be at World output of 30 Mb/d, I agree high price oil like oil sands, tight oil, deep water, and arctic oil will no longer be produced, it may be only the middle east/OPEC that produces oil at 30 Mb/d of output.
The marginal cost of NOCs is in most cases a state secret so I have little insight as to what the marginal cost would be.
https://finance.yahoo.com/amphtml/news/permian-slowdown-could-start-2020-210000268.html
Uh, yeah, no doubt.
https://oilprice.com/Energy/Energy-General/Permian-Slowdown-Could-Start-In-202021020.html
Yeah, probably Permian hits peak oil production before end of 2019
“So far this summer season we have heard two unthinkable utterances come from shale oil industry executives. The first linked above was that the industry has destroyed 80 percent of the capital entrusted to it since 2008. This came from a CEO no longer in the industry.
The second, however, came from one of the largest players in the Permian Basin, the hotbed of shale oil activity. Pioneer Natural Resources CEO Scott Sheffield said that the industry is running out of so-called Tier-1 acreage. That’s oil-speak for “sweet spots.” Those are the circumscribed areas in shale deposits within which extraction costs are low enough to justify drilling.”
https://peakoil.com/production/kurt-cobb-the-wheels-come-off-shale-oil/comment-page-1
Tony,
The articles don’t say that at all. They suggest 8 Mb/d in 2026/2027, the current level is about 4 Mb/d. I think these estimates are fairly reasonable, though a bit more optimistic than my estimates at 5 to 6 Mb/d for the Permian at peak, from about 3.5 Mb/d at present.
Guy
That article may be dead on, but it is the RATE OF GROWTH that will slow down, as that article repeatedly states.
Permian will continue to grow 200,000 bbls/year ultimately hitting 6.5 million bbld, 10 years out, total, according to that study’s projections.
Likewise, the THREE major shale basins (unidentified in the Yahoo blurb, but noted in the referenced Goehring & Rozencwajg report as the Permian, Eagle Ford, and Bakken), will increase output up to 360,000 bbls per YEAR before peaking at about 10 million bbld a decade from now.
Whether they – Goehring/Rozencwalg – are correct/incorrect, whether one agrees/disagrees, these are extraordinarily bullish estimates that are merely in sync with the multi billion dollar buildout of pipelines and port facilities in the area.
Coffeeguyzz,
I agree the estimate is not unreasonable, though I would say more than 7 Mb/d at $60/bo or lower is not that likely. At $80/bo perhaps.
Several blurbs are floating around about India offshore production. They have something like six billion barrels of quoted reserves, and interestingly enough only 44% of that is on shore.
There is talk of Exxon and Chevron both getting involved with their offshore efforts. They’ve always been a presence in India but there is talk of rapidly growing that presence, likely because India’s oil production fell 4% in the first half of this year and are at about 600k bpd.
India is #3 consumer of oil in the world, and is growing at 5.9%/yr.
Enno has just posted US LTO production for April. Attached is a portion of his well quality chart. Note there is no well improvement for 2019, the purple line in the middle of the dark blue one (2018).
Thanks Ovi,
Here’s US wells from 2015 to 2019, as you stated, no improvement so far in average 2019 wells compared to 2018. The big thing will be when newer wells are less productive than older wells, so far this has not occurred in any of the major basins.
Note that the average 2019 well is a bit better than the average 2018 well through 3 months.
2018 average cumulative 47 kb at 3 months, and 2019 average cumulative 50kb at 3 months.
Ovi,
We might expect the Bakken (oldest tight oil play that was aggressively developed since 2008) to see well profile become less productive first. Image below shows Bakken well profiles (cumulative output) from 2015 to 2019. The 2019 well at 4 months is still slightly more productive than the 2018 well (but only by 1 kb of 70 kb, so about 1.4% higher cumulative output at 4 months).
https://shaleprofile.com/2019/07/22/north-dakota-update-through-may-2019/
Ovi,
For Eagle Ford the cumulative well profile for 2018 is lower than 2017, but in 2019 well profile is higher, this may be due to “high grading” where only the best areas are seeing wells being completed, GuyM might have more info.
https://shaleprofile.com/2019/08/05/eagle-ford-update-through-april-2019/
https://www.rigzone.com/news/sanchez_energy_files_for_ch_11_bankruptcy-12-aug-2019-159540-article/
Another shale Company file ch 11 .
When I click at the link and see 2Q 2019 result the report gives some interesting readings regarding profittability of US shale play when WTI range 50-60. This Company have billions of dollars in depth and as many others the investors banks want dividend, ballons , interest but because off all challanges with child wells , decline rate , less productive rock , increast cut of liquides or poorer quality / ultra light oil it simply need to admit more capital is needed or else it cant continue. The Stock value will continue to fall like a stone..
Big event today in Argentina. The opposition won such a strong primary win that the present government is very likely to lose in October.
The present government is considered center right and lets remember center right went ahead and declared a price of oil and got oil and gas to flow from the Vaca Muerta as a consequence. The folks who just won that election are substantially to the left of the present government, so if the present government sneered at the IMF, you can only imagine what left leaning folks will do. Oil price down there may see $80 soon, which will be essentially hilarious. One would think some people are going to have to get assassinated to stop this from becoming a global norm.
One would think some people are going to have to get assassinated to stop this from becoming a global norm.
Be careful what you wish for… What goes around might just come around!
https://www.rrc.state.tx.us/media/52518/may-2019.pdf
https://www.rrc.state.tx.us/media/53564/july-2019.pdf
For comparison, May completions Texas vs July completion Texas. Permian 7c, 8, and 8a is down as I expected, but I did not expect the EF 1 and 2 to just quit. In total, Texas is down almost 30% in completions from May to July. June production may be higher from the May bump in completions, but it’s going nowhere after that. Stays like this for awhile, and production will be down. Treadmill for shale is not operating fast enough.
GuyM,
It is not clear how accurate the completion summary is. Essentially it is a report on the completion reports that are files that month. The actual dates of the completions are anything from 1 to 6 months before the report is submitted. Best data is from shaleprofile that sorts this all out (using RRC data and adept programming skill). A problem with the shale profile data is the fact that many wells completion reports don’t get filed until many months after the date of completion, so you need to go back to about Feb or earlier to get full completion data.
The drop in completions that you think you are seeing is the drop that occurred last winter dur to the drop in oil prices last autumn, in my view.
Dream on. It matches production increases and decreases for the months following the reports, largely. But, you can believe what you want. My opinion, because it’s cheap, and worth what you pay for it, is the fit hit the Shan. It’s over for 2019 and 2020. With the possibility of some increase if WTI gets over $70.
You can pull completion reports for the current month reported, only. If you pull every completion reported, you can get garbage going back years. The RRC report only reports completions reported in the current month. They hang in for years reflecting changes, approvals, etc. RRC report eliminates all the garbage, and if you pull it right, you can come close to their totals. Don’t lay no boogie woogie on the king of rock and roll.
Instructions
Put the dates in
Click the box for submitted date only
Click the next box as none
Current status producing
District
Well type oil
Purpose initial potential
Type of completion oil
Wellbore horizontal
There is always a delay in reporting by roughly a half a month. So May has some completed in April, and so forth. But, if you keep going down for two months, your assured that completions are falling. Or, you can make up your own bullshit explanation to support your own theory.
I really don’t want to argue with this. It’s pointless, let’s just watch the 914 reports going forward, and whoever is right is right.
GuyM.
I did that following your instructions, if you click on the wells in the list it gives completion dates, those are anywhere from 1 to 6 months back from the month the report was submitted. Have you done that? Only takes a couple of minutes to see that the data is only useful of you go through all submitted wells to find the dates. At shaleprofile.com Enno Peters does this by pulling all the data and then compiling total completions in each month, I believe Mike Shellman helped Enno get a handle on how the RRC data system works. In any case, the completion data in the completion summaries it not very useful in my opinion. The data at shale profile is useful.
Quarterly horizontal oil completions in TX Permian based on shale profile data.
https://shaleprofile.com/2019/08/01/permian-update-through-april-2019/
Note that 2019Q1 is likely to be revised higher as more completion reports are filed with RRC.
I really have no idea what you are looking at. Like I said, we can jaw bone about this all we want. What counts is the monthly 914’s. And for May, it did not show such a glorious effort to finish out the first quarter, did it? We are putting a huge reliance on Drilling info data. Which I am not convinced is unbiased. Ignore what I say. Just keep track of the monthlies. It will prove either one of us right or wrong, or in between.
GuyM,
I used the Online RRC completion query, in the first column there is a link for the tracking No column, when I click on it, it gives the completion date. I checked may 1 to May 31 for district 8, 336 completions submitted. For the first 10 on the list (too much work to check 336) 8 were new wells and 2 were “other/recompletion”. The dates of completion were 2 wells in Jan 2018, one in March 2018, 2 in April 2018, one in Oct 2018, One in Dec 2018, and 3 in February 2019.
The data in my chart comes from shale profile, I just added up quarterly data so it would be easier to present the totals.
At shale profile one can choose TX under the Basin setting to get first flow well status numbers. That is what the data is below for 2017 to 2019, the data from Jan to April 2019 will likely be revised as more completions are submitted to the RRC in future months.
As far as I understand, May is in the 2nd quarter, shale profile has data only through April, but data for first flow well status probably only reliable through Dec 2018 due to future revisions.
I see what you mean – example Well No.: 4102H show up in the May search (Submitted: (05/02/2019)
with a Completion or Recompletion Date: 10/31/2018
Question is:
when started the real oil production of this well (10/31/2018 ? does somebody know how to verify ?)
– and what is counted in RRC monthly completion summary (only the “submitted” dates ?)
Packet Summary Data Submitted: Online
Tracking No.: 208461 Status: Approved (08/13/2019)
Operator Name: PARSLEY ENERGY OPERATIONS, LLC (642652) Type Of Completion: New Well
Field Name: PHANTOM (WOLFCAMP) Completion or Recompletion Date: 10/31/2018
Lease Name: CHERRY STATE UNIT 29-28 Purpose Of Filing: Initial Potential
RRC District No.: 08 Well Type: Producing
RRC Gas ID or Oil Lease No.: 50360 County: PECOS
Well No.: 4102H Wellbore Profile: HORIZONTAL
API No.: 42-371-39660 GIS Horiz WB Completion Type:
Drilling Permit No: 834060 SL Record (Parent) Well Drilling Permit No.:
Field No.: 71052900 Horizontal Depth Severance (feet):
Submitted: (05/02/2019)
http://webapps.rrc.texas.gov/CMPL/publicSearchAction.do?packetSummaryId=208461&formData.methodHndlr.inputValue=loadPacket&formData.hrefValue=%7C1003%3Dhome%7C1005%3Dhome%7C1007%3D0&searchArgs.paramValue=%257C0%253D05%252F01%252F2019%257C1%253D05%252F13%252F2019%257C4%253D1%257C6%253D999%257C8%253D2%257C14%253D1%257C15%253D1%257C17%253DN%257C18%253DN%257C19%253DN%257C21%253DY&pager.paramValue=%7C1%3D2%7C2%3D10%7C3%3D215%7C4%3D10%7C5%3D22%7C6%3D10&pager.offset=&publicUser=
I think the completion summary counts the completions submitted in that month, the completion dates are totally different.
I checked one well using the lease ID, it is tricky because there are multiple wells on a lease. In May 2018 output jumped to 114,603 b/d from 51,045 b/d in April 2018, so it looks like in this case production likely started shortly after completion on 4/23/2018 (submitted 5/1/2019).
Probably a fairly safe assumption that output starts shortly after completion, but Mike Shellman or Shallow sand would know better than me.
Well, the completion reports are definitely imperfect for RRC and the drilling community. I believe I had stated that previously. It’s the counts, if they trend down, then the logic is production will trend down. But, to avoid confusion in the future, I will stick with 914 reports, because they have less wriggle room.
GuyM,
Yes you have said the RRC completion summaries may not be accurate and on that point we agree.
Using the completion query it is clear the completion summary is simply completion reports submitted in that month. What is interesting is that the completion dates go from 1 to 18 months prior to the date the report is submitted making the completion summary relatively useless in my opinion.
At shale profile we can find the actual completions reported in any given month by looking at the “first flow” well status data. That is the only decent data we have unless we pull every completion report note the date and then tally it up in a spreadsheet.
Way too much work for me and Enno Peters does it for us each month. There is a huge lag in the data though so the counts are probably not accurate for Texas for 18 months or so, so basically Jan 2018 and earlier data will be fairly accurate.
Not sure why you think the drilling info data is biased, it matches pretty well with the EIA estimates except for the most recent couple of months where incomplete data from the RRC requires statistical sampling to get a decent estimate.
Link to report pulled
http://webapps.rrc.texas.gov/CMPL/publicSearchAction.do?formData.methodHndlr.inputValue=search&formData.hrefValue=%257C1003%253Dhome%257C1005%253Dhome%257C1007%253D0&searchArgs.paramValue=%257C0%253D05%252F01%252F2019%257C1%253D05%252F31%252F2019%257C2%253D08%257C4%253D1%257C6%253D999%257C8%253D2%257C14%253D1%257C15%253D1%257C17%253DN%257C18%253DN%257C19%253DN%257C21%253DY&pager.offset=0&pager.pageSize=10
click on tracking number in left column to find completion date.
Some of these wells were completed in Jan 2018.
Took a random sample of 50 wells of 336 horizontal oil wells completed in district 8 in May 2019. 15 were completed in February and 44% of the wells were completed in Feb, March or April. No wells completed in May (that had paperwork submitted in May). Fully 56% of the 50 wells were completed in Jan 2019 or earlier (earliest in Jan 2018).
http://webapps.rrc.texas.gov/CMPL/publicHomeAction.do
Follow GuyM’s instructions, it works great, but check the tracking numbers in left column and you will see the completions summary is not very useful.
Yeah, here is my presentation on latest RRC – completions trending further behind 2018.
June and July widened the gap, July came in at 499 – or only 66% of the July 2018 completions.
Texas is now year to date 16% below 2018, next EIA downward revisions on the way ?
Still, 2019 is ahead of 2017, could it be that 2018 was unusually high? You’d need to go further back to see. I would be cautious about predicting a trend from so little data. Also, don’t forget that if 2018 was higher than normal that might have pulled back 2019, ie some of 2019’s work was pulled back into 2018.
NAOM
Envision,
RRC well completion data is not very good, check shale profile for better data.
Shaleprofile is lagging to much behind, RRC completions are for me the fastest “real data” for US production trend, maybe some are counted in the wrong month but 2018 matched perfectly with production growth and 2019 is obviously loosing on 2018 numbers.
I’m with GuyM, for me RRC data – as early bird – does the job, later confirmation will follow in EIA 914 – as it could already be seen in 2018 growth.
Envision,
Ok, but just keep in mind the data is not what it seems, it is completions filed in a given month, not the completions that actually occurred in that month.
Shaleprofile data is accurate, especially for data through the end of 2018. Basically we can only guess what the completions were in 2019 because the completion reports lag by 3 to 12 months from when they occur.
Envision, thanks for the RRC completion graph. While it may not be entirely accurate, the trend is obvious. Appreciate you sharing this.
Seeking Alpha article has a release by the RRC also showing 2019 completions down 12 percent and permits down 14 percent.
https://seekingalpha.com/news/3492747-texas-well-completions-decline-12-percent-july
https://oilprice.com/Energy/Energy-General/Time-Is-Almost-Up-For-US-Shale.html
Very interesting article related to US shale play. As I read Pioneer Resourses and I think EOG where the Pioneer Mark Papa was CEO deserve respect for open and honest comunication even their words was not what investors, banks, Wallstreet wanted to hear. To me it seens clear US shale will in the future be a swing producer that will highly depend on oil price. With WTI below 75 usd / bbl the growth will be limited if any at all.
Yes, very interesting article.
Also interesting is that there is a monster Twitter thread going on about the RCP8.5 energy use scenario, see this for example https://twitter.com/Peters_Glen/status/1161200276885377024. The climate scientists seem to be threatened by people arguing that it is not a “business as usual” strategy now that it is clear that oil production — and fracking in general — can’t be sustained for the year 2100 time frame that RCP8.5 spans.
I would suggest to Dennis that he consider creating an RCP8.5 post to provide a discussion thread. One terrible property of Twitter is that people get completely lost in the threading. It’s good for piling on memes, but not good for a back-and-fort discussion.
To consider human induced combustion of fossil fuels as more than a trigger for long time global warming is to avoid much of the reality of embedded carbon/albedo change on the planet.
The best model we have for what is happening and will happen in the future is our knowledge of the PETM event. Still the current rate of fossil burn is at least 10 times faster than the first major pulse of carbon in the PETM which stretched out over 2000 years instead of 200. The carbon stream mass is similar in size. The next ten years of carbon burn is at least as much as 500 years in the first PETM stage, since the rate of burn/leakage has increased over time and is accelerating. Once oil starts to deplete, there is plenty of coal, natural gas and possibly methane hydrates to burn.
The big difference between the PETM and now is that 55 million years ago there was no persistent ice or snow on the planet. Nor was there a large stock of permafrost and shallow methane hydrate.
So even if fossil fuel burn fades out over the next couple of decades, there is a large amplification factor that did not exist during the PETM. Combined with the extreme rate of input which will kill many species and reduce carbon sequestration.
I won’t get into stage 2 and 3 of this warming event since this is the oil side of things.
I would suggest to Dennis that he consider creating an RCP8.5 post to provide a discussion thread. One terrible property of Twitter is that people get completely lost in the threading. It’s good for piling on memes, but not good for a back-and-fort discussion.
Thanks Paul, that twitter thread really underscores the breadth and depth of the ignorance on which denialist thinking is based! And also why twitter doesn’t work for any meaningful discussion.
I’ve chosen two comments from Michael Liebreich to illustrate my point:
Michael Liebreich
@MLiebreich
Aug 12
No, but here’s the difference: plausible physical scenarios exist for 1.5-2C, they are just politically/economically implausible. No plausible physical scenario has been described for RCP 8.5, just arm-waving, but modellers are prioritising it anyway and the activists demand it.
Bold Mine.
It’s pretty clear that Michael doesn’t understand basic statistics or how modeling and risk assessment actually work! He should read this article:
https://thebulwark.com/what-changed-my-mind-about-climate-change/
How are we supposed to figure out which side is right?
The answer is that we can’t be sure. And that’s okay. Because in life you rarely know for certain what’s going to happen next. You plan for a range of outcomes and try to mitigate your exposure to the worst possible risks. There’s an entire economic discipline on this subject. It’s called risk management.
Risk management is not about discerning the optimal response to the most likely outcome. It is about discerning the appropriate response to the most likely distribution of possible outcomes. That means incorporating the possibility that climate change, either by a bad roll of the geophysical dice or a large and unexpected societal vulnerability to warming, turns into a bigger problem than we expect.
Bold Mine.
Michael Liebreich
@MLiebreich
Aug 4
I’m afraid this is naive. Read any mainstream news story about long-term climate impacts (sea-level, coral survival, storms, droughts, food production by century’s end) and I’ll guarantee that they are based on RCP8.5. Which means they are not credible and do not convince anyone.
That is just plain false! I’ll just pick coral survival as an example. I have spent over 30 years diving on tropical coral reefs. The causes of coral reef demise are complex and multi level but anyone who takes the time to take even a cursory look at the actual scientific literature will quickly realize that even the relatively small amount of warming of the oceans that has already occurred, combined with all the other anthropogenic stressors, and admittedly there are many, are killing large swaths of coral reefs all over the globe right now. There is no need to get all the way to an RCP8.5 scenario to completely annihilate all corals and we are well on our way to achieving that.
Now to be clear, coral reef health around the globe, is but one of many canaries in the coal mine that are telling us that we are on path that is not survivable! So whether or not someone thinks an RCP8.5 scenario is highly unlikely, it is a pretty bad idea not to incorporate that possibility into our overall risk assessment plan.
So without getting in to the complexities of ecological science, a rapid demise of coral reef ecosystems is a death sentence for all of us and we are well on our way to reaching that point. And the reality may even be grimmer still for many other biological and environmental markers.
So it seems to me, that collectively, humanity has decided to go the route of the ostrich and stick it’s head in the sand where it can’t see the impending disaster heading our way!
BTW, ostriches burying their heads in the sand is a myth! Humans denying reality because they don’t understand it or it doesn’t fit their ideology or world view is not!
Cheers!
Right Fred,
They might be dealing with offsetting errors. The IPCC projections on future oil consumption appear to reach as much as 160 million barrels per day, but this might be offset by amplification factors due to induced CO2 outgassing from the warming.
So a high estimate for oil consumption may be balanced by low estimate for effective climate sensitivity. Their RCP8.5 scenario may be correct due to serendipity.
Yeah, and it might be useful, as someone else in that thread mentioned, to keep in mind what RCP actually stands for. It seems most people are still stuck on emissions scenarios
A Representative Concentration Pathway (RCP) is a greenhouse gas concentration (not emissions) trajectory adopted by the IPCC for its fifth Assessment Report (AR5) in 2014. It supersedes Special Report on Emissions Scenarios (SRES) projections published in 2000.
So there are potential pathways that could lead to an RCP 8.5 scenario even if we should end all anthropogenic emissions today. While we may not as yet have arrived at the actual tipping points leading to non anthropogenic GHG feedbacks, there is a real possibility that we may have already passed point of no return thresholds that will ultimately send our little canoe tipping over the edge of that waterfall!
We may be gently paddling down the river completely unaware that even if we tried to head for the shore right now, that is no longer possible…
Anyways, I realize that my words will fall mostly on deaf ears!
Cheers!
Fred, It may be more of an Aha! moment for the climate activists involved.
What this means now is that climate change and peak oil are equal partners in the mix, and that’s what has the climate activists somewhat depressed by the discussion. Even someone like Frank Luntz realizes that both AGW and PO should be considered in a No Regrets policy going forward. And getting beaten to the punch by Frank Luntz can only get them more depressed!
And getting beaten to the punch by Frank Luntz can only get them more depressed!
ROFL!
Yep, it’s like Republicans having to admit that Bernie Sanders is right about universal basic health care… 😉
Why do people consider that it is foolish to include a worst case climate scenario (let us hope it stays worst case or a worser case is not created) while, at the same time, accept fire departments planning for worst case fire scenarios, schools running active shooter drills, disaster planning for major earthquakes, hurricanes, floods etc?
NAOM
Worst case scenario is ok. The problem is that media, politicians and the man om the street think it is the most likely scenario. That is completely wrong.
No one ever mentions the worst case scenario. Ever.
Notanoilman,
One problem is that a lot of the analysis takes the worst case scenario and focuses on that scenario (in this case RCP8.5). The level of emissions necessary to each that concentration pathway requires more resources than are likely to be extracted (probably less than 1% chance that RCP8.5 is possible).
Makes more sense to focus on RCP4.5 for analysis as that is the most likely scenario. Keep in mind, the likely scenario is about 1500 Gt of carbon emissions, emissions scenarios that might lead to RCP8.5 have about 3 times this level of carbon emissions.
There is plenty of uncertainty on outcomes simply with RCP4.5 and RCP6 would probably be useful (but most analyses ignore that scenario choosing instead to focus on RCP8.5).
Bottom line, there is much less coal that can be economically exploited than many coal resource assessments suggest.
Paul,
You can create what you have in mind in a simple Word doc and email to me. I would be happy to post it.
Dennis, Will do. But I have some other emails that I sent you and you haven’t responded to them yet 🙂
Sorry Paul.
Got latest.
Freddy,
I would disagree on your $75/b price for WTI. My model with Brent at $70/b long term (WTI about $65/b) US shale output continues to grow, but slowly. The Cunningham article mentions $55/b, but says nothing about $75/b. At $75/b for WTI, US tight oil does ok.
There is fuel rationing in Portugal in place now. It seems that it is not the first time, too. Despite being a small country, Portugal looks like a troubled one.
It seems small importers will be the first victims of peak oil.
Nothing to do with peak oil. The tanker drivers are on strike over hours and pay.
There is unfortunately rather a lot in this particular week’s comment stream that’s not about peak oil. Most of this stuff belongs on the other thread.
well, yes, but the fact that they cannot get a rise may be a function of rising diesel prices, and therefore, lower margin for a driver.
It is not the first such a strike in Portugal. Maybe getting fuel there is expensive.
>> Maybe getting fuel there is expensive <<
Diesel:
$1.50 per litre (Portugal)
$1.65 per litre (W.Wales – where I live)
I wish my diesel was as expensive as in Portugal!
Again, situation in Portugal is *nothing* to do with peak oil.
Well, that ensures that drivers earn less than in Wales.
It is also a cost of bringing the fuel from a depot/refinery. It seems there are two in PT, Porto and Sines, together around 300 000 bd. Nothing unusual, actually.
But it looks like truckers are the weakest point of fuel distribution system. This is important in the sense that truckers can be looked at as a distributed system, a system which is dependent on the entire country to work. It kind of excludes a gradual decline, and ensures a sudden one, with the benchmark being the lowest common breaking point for all truckers in the country.
“According to the research organization BloombergNEF, the volume weighted average lithium-ion battery pack price (which includes the cell and the pack) fell 85% from 2010-18, reaching an average of $176/kWh. BloombergNEF further projects that prices will fall to $94/kWh by 2024 and $62/kWh by 2030.”
If this is true, and the price for the battery packs fall as predicted, it will be huge tailwind behind electrification of transport.
We shall see.
“According to an analysis by BloombergNEF, in early 2019 there were 316 gigawatt-hours (GWh) of global lithium cell manufacturing capacity. China is home to 73% of this capacity, followed by the U.S., far behind in second place with 12% of global capacity.”
China advantage is growing in this space, with only Tesla in the USA up to speed on this. The USA, along with Europe and the rest, will be paying China for batteries.
https://oilprice.com/Energy/Energy-General/The-Reason-China-Is-Winning-The-Battery-Race.html
Battery costs are unlikely to decline below $150/kWh according to delegates at the Advanced Automotive Battery Conference (not exactly a bias bunch):
The average cost in China of a lithium nickel-cobalt-manganese (NCM) battery fell to $174/kWh last year, and an average lithium iron phosphate (LFP) battery fell to $145/kWh, said Mark Lu, certified senior analyst at the Industrial Technology Research Institute (ITRI) of Taiwan. The Chinese government is targeting battery costs of $150/kWh as it defines policies to encourage large-scale uptake of EVs.
The total cost of a battery pack is likely to remain around $150/kWh, said Christophe Pillot, director at France’s Avicenne Energy. Technical developments are creating some performance efficiencies so that slightly less metal will be needed, but raw material costs alone are not expected to fall much below $75-80/kWh.
Prices for lithium, nickel and cobalt are subject to supply volatility, and taking the lowest and highest levels for the past 10 years indicates costs of $10-67/kWh, said Kurt Vandeputte, senior vice-president of the rechargeable battery materials business unit at Belgium’s Umicore.
https://www.argusmedia.com/en/news/1838533-raw-material-costs-to-limit-battery-price-decline-aabc
—-
Nonetheless, I am not surprised that Bloomberg New Energy Finance is predicting endless declines in battery costs, these guys are the ultimate cheerleaders for renewable energy. Unfortunately for them, battery hype alone wont transform fantasy into reality.
I wouldn’t be surprised to see it go up or down, in this world.
Same for oil.
We shall see.
Either way, those who have strong supply lines and manufacturing capacity will be in the drivers seat.
Nickel – new mines are planned/in progress so expect availability and price issues to be overcome.
Cobalt – big reductions in use with some of the latest battery technology eliminating it. Price spiked and availability dropped due to hoarding/stockpiling, people expected to make a profit but they were creating a false picture of demand in hoarding. Prices have dropped so far that some mining has been suspended to try and drive prices back up. A very manipulated market.
I wouldn’t be surprised if some of the BIG battery producers went into the production of raw materials to ensure supply and prices.
NAOM
From addiction to oil running into addiction to nickel, lithium, etc
Except Nickel, Lithium etc can be re-used, just try burning the same oil twice.
NAOM
Right, and it will be much better than I thought it would be possible; 50% is not so good.
“A new solution by Nordic clean energy company Fortum makes over 80% of electric vehicle (EV) batteries recyclable, returning scarce metals back into circulation and resolving the sustainability gap by reducing the need to mine cobalt, nickel and other scarce materials. The current recycling rate for lithium-ion batteries is approximately 50%.“
https://www.pv-magazine.com/2019/03/25/innovation-boosts-lithium-ion-battery-recycling-rate-to-over-80/
” Nordic clean energy company Fortum”
Well thats a bit of a modification of the truth, i know it says so on their webpage but their trains still run on diesel, probably not the only thing. Perhaps it only includes electricity produced and that you spend a lot of diesel to bring the “renewable” stuff to the furnace dont count.
erkon pituus oli 5 944 kilometriä, josta 3 256 kilometriä oli sähköistetty.[1] Vuonna 1982 rataverkon
Finnish railway network is 5944 km (about 3700 miles). 3256 km (about 2000 miles) is electrified. Mostly tracks that have little traffic are still operated with diesel engines.
Fortum does not operate trains and has nothing to do with what knd of engines haul the trains. State owned VR Group operates the trains and track maintenance is done by company named Väylä (word that means generally all roads, tracks, waterways etc…) that is also state owned.
Just to clarify…
Perhaps the new owner then didnt repaint the cars as they are still branded Fortum? Image is from Sweden so i dont know if same applies in Sweden as in Finland (VR Group).
Anyway i guess thats a nice solution to be able to slap the 100% renewable on the webpage, just put diesel use parts of an operation at a sub contractor or third party company. I guess fuel used by staff cars and machines simply doesn’t count.
Perhaps the tight oil should apply same solution, put a third party company in charge of the flaring, imagine how much nicer the environmental responsibility slide would look in the quarter presentation.
“ ….but their trains still run on diesel,”
Baggen, that’s another issue. My point was that they claim being able to return 80% of scarce metals in batteries back into circulation.
Tesla recycles too but I don’t know their efficiency.
@Baggen
Trains will have to switch to electric however the fuel efficiency per ton/mile is, probably, a lot higher. You would have to ask someone like NickG.
NAOM
I discussed this about trains somewhat with one of my best friends who now is a MD for a rail company and has been in key positions for other companies his entire career.
Told me lots of interesting stuff but some small parts from memory.
Electrification in sweden was actually done since electric trains were capable of heavier loads, related to our iron ore industry.
Its not because we just are stupid we haven’t switched from diesel to electric 100%, there is no economy in it but biggest reason it wont happen on all traffic (goods) is not economical its safety regulations.
Then there is other issues aswell if we move from one country to EU region. Lets just say all electric in EU is not happening before diesel runs out.
But this is another discussion, i just wanted to point out the in my eyes hypocrisy of stating you are a 100% renewable company when you clearly use diesel.
Diesel trains in EU are only left on side tracks where traffic is small.
And even there are tests with battery trains or hydrogen at the moment – battery needs less infrastructure since most of these sidetracks are short and the trains can reload at the electrified parts.
Hydrogen can run longer sidetracks.
The length of the track is no argument – the transsiberian is already electric. It was done for increasing goods traffic.
Eulenspiegel
“Diesel trains in EU are only left on side tracks where traffic is small.”
That is simply not true, spend 5 minutes in Copenhagen central or Norreport.
Yes as i said about Sweden our electrification started since electric trains were able to pull heavier loads and it was goods trains (ore).
The issue is not economical with electric trains or that people involved in the business is simply stupid and have not changed to electric in 50+ years because of that. Its safety regulations.
As you suggest trains with battery and hydrogen combo could probably solve the safety issue and then diesel might be replaced. But whats a realistic time frame for that minimum 30+ years?
@Baggen
There are too many excuse in not switching from diesel to electric. It needs the governments to get behind it and make it so. One example, from the UK, is the Severn tunnel. They have problems in electrifying the tunnel due to salty water infiltration, the answer – diesel! They just need electric either side with a small amount of battery on-board to make it through the tunnel.
NAOM
Aug 12 EIA DPR predicts Permian oil production to reach new record of 4.42 mbd in Sep 2019
https://www.eia.gov/petroleum/drilling/pdf/permian.pdf
Eagle Ford production may have peaked.
https://www.eia.gov/petroleum/drilling/#tabs-summary-2
Some other recent Permian links
https://seekingalpha.com/article/4285324-shale-oil-well-productivity-continues-stagnate
https://www.ajot.com/news/rystad-permian-frackers-break-old-records
What really is surprising is that the DPR is showing an increase of 84 bbls/d over one month. Is this an error or is it real. To be real, it implies that the rigs are being sped up by 12% to drill more wells per month. The August increase over July was just 12 bbls/d. Could this have something to do with new pipelines becoming available? I read the following yesterday.
“Reuters reports that global commodities trader Trafigura has started shipments of Permian basin crude to the Corpus Christi oil hub in Texas via the newly operational Cactus II pipeline system, the company said in a statement on Monday. Trafigura signed a long-term agreement with pipeline operator Plains All American Pipeline LP last year to transport a total of 300,000 barrels per day (bpd) of crude and condensate on the pipeline. The Cactus II Pipeline system will have the ability to transport 670,000 bpd.
It’s an statistic artifact. Rig count was going down fast – but all already drilled holes are in the fracking pipeline.
When they are processed and rig count stays flat, values will come down again.
Technical progress is somewhat slower – older rigs are often written off and so have low costs until they break too much. So they are used still.
At scrapping old rigs will be the first targets – so when the rig count rises again, it will be more efficient rigs than before.
The production per rig has increased very much recently, from 600 to almost 800 bbl / rig in less that a year. Is it because sweet spots have been found and drilled in or is it improved technology / methods?
Tom,
It is a model so it might not be accurate. Also as rig counts go down the least efficient rigs are stacked and the least efficient crews are laid off. So efficiency tends to rise. Possibly a bit of technique improvement as well.
Dennis, I see from the graph that exactly the same thing happened in 2016. Number of rigs decreased, followed by a large increase in production per rig. So, yes that is probably the main reason.
Dennis
Attached is a chart of Rig count and Production/Rig.
Note that there are no rig counts for Aug and Sept. As you mention, maybe the least efficient rigs are being stacked and the DPR is not quite sure how many. A rough guess, looking at the trend from January, of the stacking rate is about 6/mth.
So roughly a 10% decrease in rigs gives roughly 9% increase in production / rig. Is it because the least efficient rigs drill the shortest wells or is more related to the time it takes to drill a certain amount of wells?
Tom,
I am not an oil producer so this is a guess. I think the newest and best rigs continue to operate and the moste experienced and talented people continue to work operating those rigs while older rigs and less efficient rigs as well as less experienced and/or talented workers remain idle.
In sports terms, we have the first string in the game.
Hi all,
New post up by Paul Pukite, aka Webhubbletelescope back when he occasionally posted at the Oil Drum.
http://peakoilbarrel.com/arguments-over-rcp8-5/
No Peak Oil in 2018 or 2019 or 2020
https://oilprice.com/Energy/Crude-Oil/Will-We-See-An-Oil-Supply-Glut-In-2020.html#
https://oilprice.com/Energy/Crude-Oil/Shale-Pioneer-Hamm-Calls-For-Production-Slowdown.html
OPEC + will have to cut production again.
So this thread remains active while there’s a new non-oil wacko thread?
Isn’t there supposed to be a new oil thread when this happens?
It’s a topsy-turvy world sometimes.
Not just Facking for the Red Queen, add Government and FANGS. Multi Dimensional Looking Glass!
“It takes all the running you can do to stay in the same place.”
https://www.youtube.com/watch?v=RZV6DnuqY40&t=1180s
Exxon exits the Play that Nuked OPEC.
https://www.zerohedge.com/news/2019-08-14/exxonmobil-looks-exit-uk-north-sea-oil-gas
Yes, Exxon is selling everything to invest it in the profitable super-Permian. Cheapest production cost world wide – according to intermal Excels and Powerpoints.
It’s only possible to turn around for such a company if you fire the CEO before – otherwise it is like in Samurai Films – hold the castle at any price.
Article says Reuters found 3 sources to say Exxon is exiting the North Sea.
All of the rest, about why and where they will put the money, is speculation.
Maybe Vaca Muerta.
conventional oil production offshore Guyana.
Gibraltar decides to free seized Iranian tanker, paving way for ship swap
(somebody caved, and it wasn’t Iran)
https://www.reuters.com/article/us-mideast-iran-tanker-gibraltar/gibraltar-decides-to-free-seized-iranian-tanker-paving-way-for-ship-swap-idUSKCN1V50SP
(Despite to last minute request from US State Dep to seize Iranian oil tanker Grace 1)
“The one thing that is clear in the whole situation is that the Brits blinked and America failed. Should be a song.”
We shall see——– I don’t think it is that simple.
I think you should discuss the case of accounting fraud in General Electric. You can lead her to a possible bankruptcy. It has been discovered that a General Electric display company is responsible for all fracking investment in the US. The news is being commented all over the world. The company is a mastodon of the caliber of 50 Lehmans Brothers.
Late stage capitalism.
The loot and steal model.
Capitalism needs an expanding resource base.
That seems to be coming a problem.
Future? Who knows?
North Dakota June oil production out.
New daily record of 1.42 million bbld.
Pennsylvania published June natgas.
Over 18.1 Billion cubic feet/day … hovering near record.
Cactus II starting online.
~700,000 bbld starting to flow to da Guf from Permian.
Anyone still skeptical about the productive capacity of US shale might glean more accuracy by broadening their sources of information, combined with historical prognostication record of an army of observers.
This is STILL the early innings of this so called Shale Revolution.
So do you think negative interest rates would affect shale output?
Watcher
The economic picture, globally, has been sketchy since at least 2008/9 as you well know.
The shale boys have decimated investors for about a decade.
Pipeliners – with their FERC approved rate structures – have been attracting money for quite sometime.
Arrangements such as Encino in the Utica – being bankrolled by the Canadian pension fund – offer one example of how capital might be utilized.
Way too many moving parts.
But, in contrast to much of the common prognostications on this site, US liquid hydrocarbons have several decades of high output potential.
Much of the current operational unknowns favor to the upside regarding output.
The gaseous resource is SO huge that countries, industries, competing processes are STILL trying to wrap their (collective) heads around this new, highly disruptive state of affairs.
Go long uncertainty and disruption.
If there’s talk of a recession today (inverted yield curve) and there has been lots of press recently regarding shale oil financials, you have to remember that historically recessions are always linked to some sort of oil shock.
See James Hamilton https://www.jstor.org/stable/pdf/41322100.pdf
How many times must this be explained.
There is a $1Trillion deficit. This is 5% of GDP. IT IS FISCAL STIMULUS. It is pumped into the economy. Look up fiscal stimulus — it’s taxes not imposed plus spending performed.
The reason this is a fail for capitalism in general is this 5% is getting only 2% GDP growth. Capitalism is eating 3%.
A recession BY DEFINITION is 2 or more quarters of flat or negative real GDP growth. It’s not measured by any other parameter and the NBER makes the official call based STRICTLY on this definition.
There has never been a recession that started with this sort of stimulus present. Look at the numbers. It’s nearly impossible, and the Fed can take short term rates to zero (OR NEGATIVE) after just 3 months of some apparent problem. Or do some more QE. Almost certainly would do some more QE. Damn near impossible with this configuration to get 2 quarters negative. You can just print money, hand it to the economy and add to the 5% already going in.
All the talk about yield curve inversion is based on history. There is no history. There has never been a Fed that added 23% of GDP of cash over an 8 year or whatever period coupled with 5% of GDP fiscal input.
Add all this to a suspended debt ceiling and just how in hell can there be 2 quarters of negative GDP?
Of course it is possible, but would occur with yield curve meaning zero. It would require a war, on US soil.
Another statistic: amount of $ made by shale biz over last decade = -$280B
Bakken output 1368 kb/d, previous high was 1347 kb/d (Jan 2019). This is not a huge increase. 21 kb/d or 1.5%, for the past 18 months the trend in ND Bakken/TF output has been an annual rate of increase of 188 kb/d. For the past 7 months the rate of increase has been considerably slower with a trend of 40 kb/d for the annual rate of increase in output from Dec 2018 to June 2019. For the past 10 months the annual rate of increase in ND Bakken/TF tight oil output has been 43 kb/d or about 3% per year.
[mod: just settle down a little with respect to the hysterics, please?]
Hey, Denis and Shallow…… Petro here….
….long time, no see…..
………………………………………………………
4 years ago I told you that oil will be between $35- $65, or will go “kaboom”…..
………………………………………………………………………………………………………..
……………..and rates (….10 year billl…..) will go to ZERO….. hkhe, hkhe……. cough, cough…. 000000000000000000.
………………………………………………………………………..
…………………..you…. and SS …………… and Nick G …………and the Peninsula man/boy…………….and ….Fred…..and watcher …. and AAALLLL the other morons believing the Suply-Demand bull shit…. (ahhhh…. including you RON……sorry) didnt belive it…
Thas fair enough…. for thats ignorance….!
Whats not fair and whats not OK is your arrogance…….
………………………………………………………………………….
I’m sure you know more than I ….. and I am just another moronic commenter on your blog……
…… YEAH…….. U DA MANZZZZZZ…………….. alll of you….
Go ahead Denis, block me like you have done before…..
….”I’m sure” Baken and Permian will still produce by 2030…….
…..ha, ha, ha, ha…….
be well,
Petro
“Go ahead Denis, block me like you have done before”
I hope not. I’ve always enjoyed your comments and your knowledge.
It is true that this place bans people for having different views. That leads to an echo-chamber where everybody thinks the same and there is a high chance everybody is wrong.
“The sanctions added to a jump in demand for Russian crude in the wake of output cuts from the Organization of Petroleum Exporting Countries and their partners. As a result, Russia’s Urals blend of crude has started to regularly trade at a premium to Brent.
“There is a shortage of competing heavier, sourer crude right now as a result of sanctions on Iran and Venezuela, but also because of OPEC+’s current production cut agreement,” Konstantsa Rangelova, analyst at JBC Energy, said by email. “Urals in the Mediterranean is at an all-time high.”
Remember when the propaganda was that contaminated Russian oil would cause customers to buy it no longer?
Not a bad idea:
Denmark Offers to Buy U.S.
“We believe that by giving the U.S. an educational system and national health care, it could be transformed from a vast land mass into a great nation,” a spokesperson for Denmark said.
Hilarious
Opec Monthly report is now out..
https://oilprice.com/Energy/Crude-Oil/OPEC-Oil-Production-Continues-To-Slide-As-Saudis-Cut-Deeper.html
They predict Global demand 2019. will be 99.92 Mbpd and in 2020 101.05 Mbpd. 2019 increased demand 1.1 Mbpd.
They exspect increased demand non Opec Countries with 1.97 Mbpd and 1.87 Mbpd of this comes from US / shale play. At end of 2019 Opec sees US oil production reach 13 Mbpd where 7.8 Mbpd comes from shale. 3.44 Mbpd Permian , 1.48Mbpd Bakken, and 1.34 Mbpd Eagel Ford. In 2020 they exspect shale in us to increase by 1.3 Mbpd. Permian 4.36 , Bakken 1.59 and Eagel Ford 1.42. I dont know what oilprice they exspect in this period but with WTI in 50-60 usd range this seems very optimistic…tought both Eagel Ford and Bakken are at plateu or start decline
Those are consumption growth numbers of about 1.1% and 1.13%. Not too far from the 10 yr avg growth rate for ALL LIQUIDS (which monthly is not) of 1.2%. Because of the all liquids aspect, this actually looks like a consumption growth rate uptick vs this year’s 1.5% (BP all liquids).
Bottom line continues to be . . . for consumption, population growth matters more than GDP growth that can be created via QE or fiscal stimulus. Every new mouth that appears has to have food transported to it.
Thanks wide ball