The Bakken and North Dakota production data fir May is in.
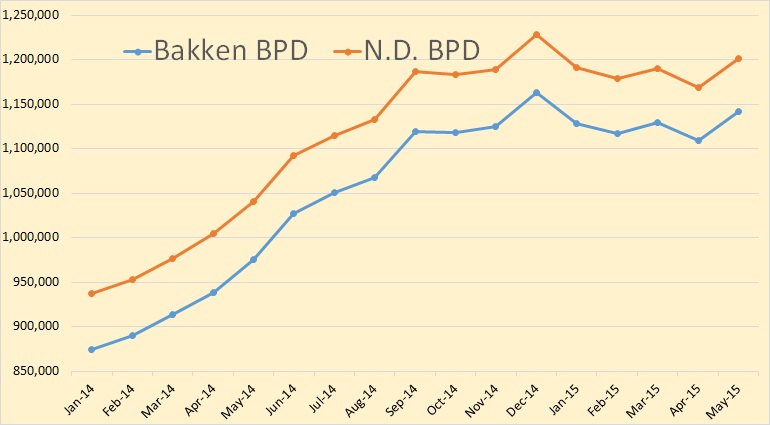
Bakken production was up 33,352 bpd and North Dakota production was up 32,114 bpd. This is quite a shocker. I had not expected production to be up this much. Bakken barrels per day, in May, stood at 1,142,034 and all North Dakota barrels per day was at 1,201,159.
| Wells Producing | |||
| Bakken | All N.D. | Non Bakken | |
| Apr-15 | 9,527 | 12,123 | 2,596 |
| May-15 | 9,704 | 12,264 | 2,560 |
| Change | 177 | 141 | -36 |
From the Director’s Cut:
Apr Sweet Crude Price = $38.33/barrel
May Sweet Crude Price = $44.70/barrel
Jun Sweet Crude Price = $47.73/barrel
Today’s Sweet Crude Price1 = $40.75/barrel (all-time high was $136.29 7/3/2008)
Apr rig count 91
May rig count 83
Jun rig count 78
Today’s rig count is 73 (lowest since November 2009 when it was 63)(all-time high was 218 on 5/29/2012)
The drilling rig count dropped 8 from April to May, 5 more from May to June, and has since fallen 5 more from June to today. Operators continue to experiment with running 1 to 2 fewer rigs than their planned 2015 minimum to see if drill times and efficiencies will continue to improve. This has resulted in a current active drilling rig count that remains 5 to 8 rigs below what was operators indicated would be their 2015 average if oil price remained below $65/barrel. The number of well completions rose slightly from 102(final) in April to 114(preliminary) in May but initial production rates are increasing 10-20% per month as drilling and completions focus more and more on the best portion of the core Bakken and Threeforks area.
Renewed oil price weakness anticipated to last into next year is by far the main reason for the continued slow-down. There was one significant precipitation event in the Williston and Dickinson areas and a separate one in the Minot area, 7 days with wind speeds in excess of 35 mph (too high for completion work), and no days with temperatures below -10F.
Over 98% of drilling now targets the Bakken and Three Forks formations.
At the end of May there were an estimated 925 wells waiting on completion services, the same as at the end of April. To maintain production near 1.2 million barrels per day, 110-120 completions must be made per month.
The EIA’s Short-Term Energy Outlook came out a few days ago. That is where they try to guess the future production and price for oil, for the USA as well as the world. As of late they seem to be getting a little timid with their predictions. They are saying not much growth is happening until the fourth quarter of 2016, and only a slight bump then.
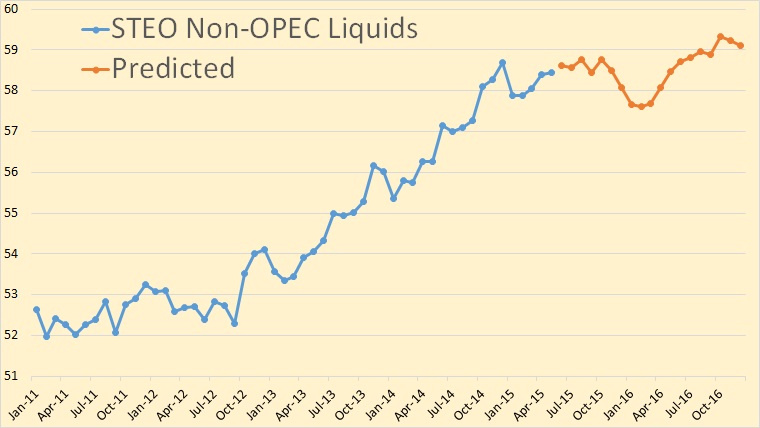
This chart is Non-OPEC Total Liquids in million barrels per day. Production of N.O Liquids surged upwards from September of 2012 until December 2014, gaining 6.38 million barrels per day in those 27 months. That’s an average increase of 236,000 barrels per day per month. But then in January 2015 there was a drop of 800,000 bpd.
Non-OPEC total liquids still have not reached that December high again but the EIA thinks they will by August. I have my doubts. I also think they have their April and May liquids production estimates a little too high here. I have their predictions here starting in June though the EIA starts their projection in July. But there is no way that June production is anything but a guess here, and a bad guess at that.
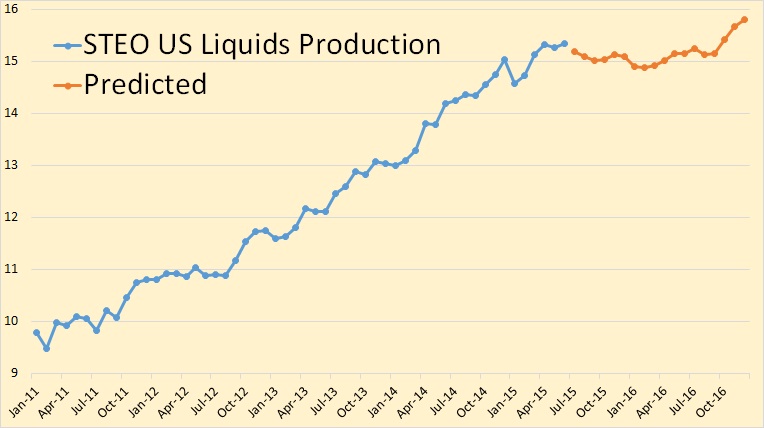
For four and one half years, US Total Liquids increased by an average of over 100,000 barrels per day per month. Now the EIA says US Liquids have reached a plateau where they will remain through September of 2016. Then for some unknown reason the US will resume it upward surge.
Notice the huge decline of 460,000 bpd in January 2015. But then there was an increase of 160,000 bpd in February, 390,000 bpd in March and 190,000 bpd in April. That’s an increase of 740,000 barrels per day over three months when the US rig count was falling dramatically. I look for those numbers to be revised in the next couple of months.
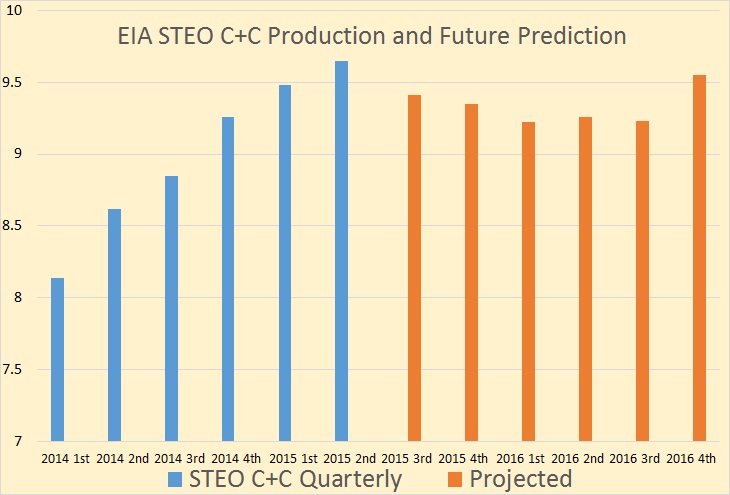
The EIA STEO has Quarterly US C+C production climbing steadily right through the second quarter of 2015. But then they have C+C production falling through the first quarter of 2016 before leveling out and then climbing again in the fourth quarter of 2016.
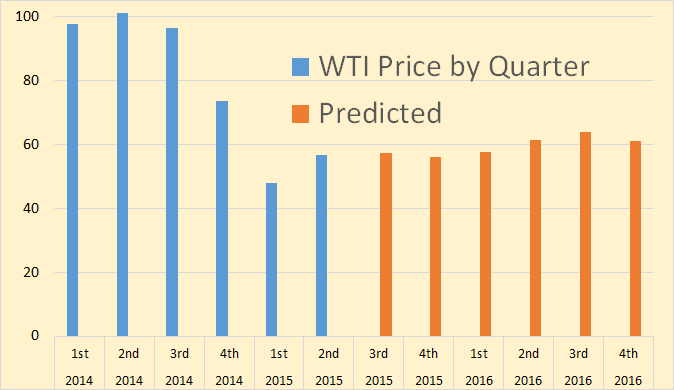
The EIA expects prices to stay low through 2016. In the fourth quarter of 2016 they have production increasing but prices falling. There seems to be a contradiction there somewhere.
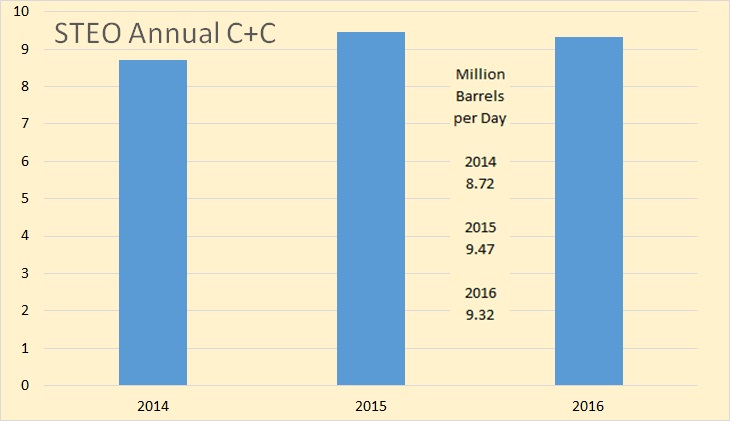
The EIA has US C+C peaking in 2015. Of course I am sure they expect the increase to continue in 2017 and possibly taking out the 1970 high either in 2017 or soon thereafter. I believe that all depends on the price of oil. If prices stay low I think shale production will continue to collapse.
China Peak Oil: 2015 Is the Year
Intense focus on the North American shale boom, Saudi Arabia, and ISIS obscures an important emerging energy trend: China’s oil production is peaking. This has profound implications for the world oil market, because China is not just a massive importer of crude; it is also among the world’s five largest oil producers, trailing only the U.S., Russia, and Saudi Arabia, and virtually neck-in-neck with Canada.
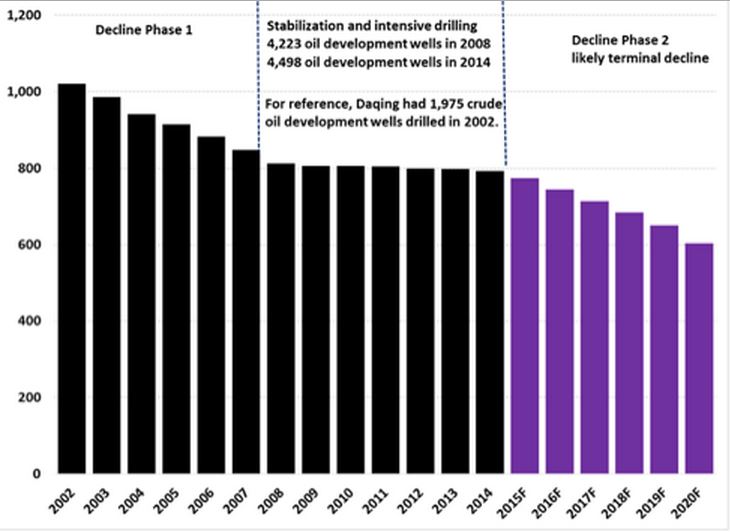
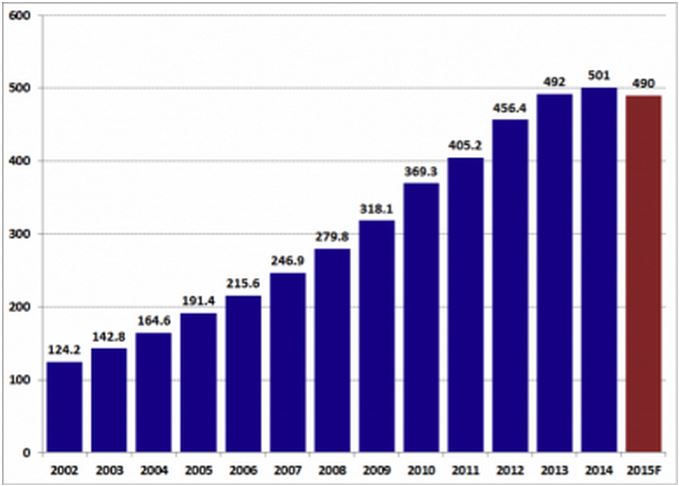
Daqing’s oil production has declined relentlessly, despite PetroChina’s significant increase in drilling activity in the field during recent years. This suggests a significant risk that production could fall faster than planned. For reference, PetroChina drilled 1,975 development wells in 2002 when oil production averaged 1.079 million barrels per day, but was forced to boost this to 4,498 development wells in 2014, when oil output at Daqing averaged 792,000 barrels per day. In short, the number of development wells drilled increased by nearly 250 percent while oil production fell by roughly 27 percent.
Daqing is the perfect example of what infill drilling can do, and what it can’t do. Infill drilling slowed the decline rate of Daqing but increased the depletion rate. I believe if the infill drilling drops off to what it was before the program began, then production will drop a lot faster than they show in this chart.
Changqing, China’s second largest oil field peaked in 2014.
Despite some recent announcements of additional tight oil discoveries, Changqing’s slowing production growth rate over the past three or four years contrasts sharply with the hyperbolic production growth seen during the booms in world-class tight oil plays like the Bakken and Eagle Ford shales in the U.S. This difference is critically important because to offset production declines and propel significant net growth in a mature oil province like China or the U.S. requires multiple massively robust unconventional fields.
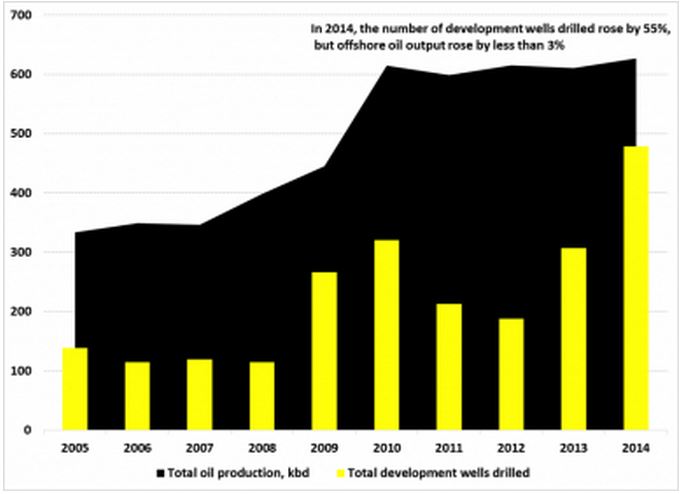
China offshore production will not save the day. A 55% increase in development wells resulted in a 3% increase in production.
China and Russia, two of the world’s five largest crude oil producers peaks in 2015. The US, the world’s third largest producer also peaks in 2015, at least temporarily. And it is very likely that Saudi is at maximum production also. 2015 will be the year of peak oil.
Shale drillers’ safety net is vanishing
The insurance protecting shale drillers against plummeting prices has become so crucial that for one company, SandRidge Energy Inc., payments from the hedges accounted for a stunning 64 percent of first-quarter revenue.
Now the safety net is going away.
The insurance that producers bought before the collapse in oil — much of which guaranteed minimum prices of $90 a barrel or more — is expiring. As they do, investors are left to wonder how these companies will make up the $3.7 billion the hedges earned them in the first quarter after crude sunk below $60 from a peak of $107 in mid-2014.
“A year ago, you could hedge at $85 to $90, and now it’s in the low $60s,” said Chris Lang, a senior vice president with Asset Risk Management, a hedging adviser for more than 100 exploration and production companies. “Next year it’s really going to come to a head.”
The hedges staved off an acute shortage of cash for shale companies and helped keep lenders from cutting credit lines, many of which are up for renewal in October. With drillers burdened by interest payments on $235 billion of debt, $89 billion of it high-yield, a U.S. regulator has warned banks to beware of the“emerging risk” of lending to energy companies.
__________________________________________________________
Note: If you would like to receive an email notice when I publish a new post, then email me at DarwinianOne at gmail.com .
old farmer mac – re “extra fuel to backup renewables”,
I answered that (again) at the end of the last article – just in time to see a new Ron-post.
http://peakoilbarrel.com/oil-shock-models-with-different-ultimately-recoverable-resources-of-crude-plus-condensate-3100-gb-to-3700-gb/comment-page-1/#comment-526014
Two key papers:
Greenhouse Gas Emissions from Operating Reserves Used to Backup Large-Scale Wind Power, Environmental Science and Technology
http://www2.hawaii.edu/~mfripp/papers/Fripp_2011_Wind_Reserves.pdf
Impacts of Wind and Solar on Fossil-Fueled Generators
http://www.nrel.gov/docs/fy12osti/53504.pdf
old farmer mac – re (something like) “nobody debates Fernando’s statement that RCP8.5 is fantasy”
Did you read the beginner’s guide?
http://www.skepticalscience.com/rcp.php
RCP 8.5 is a scenario whose premise is basically:
* no GHG emissions controls, e.g. “no policy, business as usual”
* minimal renewables
* maximum fossil fuels.
It’s just a scenario – not a prediction. Scenarios depend on politics, so they can’t be predicted.
That’s why they developed 4 of them: low, low medium, high medium, and high.
By saying RCP8.5 “didn’t even consider” resources, Fernando has placed himself in loony tunes land.
If you read the paper ezrydermike linked to:
RCP 8.5—A scenario of comparatively high greenhouse gas emissions
Keywan Riahi, et. al.
http://link.springer.com/article/10.1007/s10584-011-0149-y/fulltext.html
down in section 3.2.1.
“Secondly, availability of large amounts of unconventional fossil resources extends the use of fossil fuels beyond presently extractable reserves (BP 2010). The cumulative extraction of unconventional fossil resources lies, however, within the upper bounds of theoretically extractable occurrences from the literature (Rogner 1997; BGR 2009; WEC 2007).”
See – they considered it, and give you the references about the resource/reserve estimates they used.
QED Fernando is lying in his hysteria.
down in the footnotes:
“In RCP8.5 unconventional natural gas extraction amounts to 17 ZJ and unconventional oil extraction to about 21 ZJ over the course of the century.”
A zeta joule is 10^21 joules.
a Barrel of Oil Equivalent is roughly 6.1 GJ.
https://en.wikipedia.org/wiki/Barrel_of_oil_equivalent
21 x 10^21 joules / 6.1 x 10^9 joules/BOE = 3.4 x 10^12 BOE, or 3.4 trillion BOE
So, is that backed by any numbers?
“A 2008 estimate set the total world resources of oil shale at 689 gigatons — equivalent to yield of 4.8 trillion barrels (760 billion cubic metres) of shale oil, with the largest resource deposits in the United States, which is thought to have 3.7 trillion barrels (590 billion cubic metres), though only a part of it is recoverable.[5] According to the 2010 World Energy Outlook by the International Energy Agency, the world oil shale resources may be equivalent of more than 5 trillion barrels (790 billion cubic metres) of oil in place of which more than 1 trillion barrels (160 billion cubic metres) may be technically recoverable.[1] For comparison, the world’s proven conventional oil reserves are estimated to be 1.317 trillion barrels (209.4 billion cubic metres), as of 1 January 2007.”
https://en.wikipedia.org/wiki/Oil_shale_reserves
So a trillion + BOE from oil shale.
The World Energy Council 2013 says:
https://www.worldenergy.org/wp-content/uploads/2013/09/Complete_WER_2013_Survey.pdf
“if the unconventional oil resources, including oil shale, oil sands, extra heavy oil and natural bitumen are taken into account, the global oil reserves will be four times larger than the current conventional reserves.” They claim 223 Gtonne, or 1.6 trillion BOE conventional, (about what everybody else claims),
so 3x that is 4.8 trillion BOE of unconventional reserves.
So in fact the RCP8.5 is a bit more conservative than WEC.
Now, you can debate how likely something like oil shale would actually come to pass,
(I think basically zero, because I spent time in Western Colorado, and know the water situation there),
but plenty of people count oil shale resources and hypothetical reserves.
It is dishonest to claim the RCP8.5 was invented to cause hysteria.
The old scenarios needed updating, so people got together and settled on 4 new ones, with some actual meaningful names this time. (RCP8.5 is based on the old A2r scenario – now what does A2r mean? is it more or less warming than a B2 scenario?)
It would be dishonest to presume politics would never be so crazy as to cook the planet a la RCP8.5,
or people would never come to their senses sooner rather than later a la RCP2.6.
So if one is going to model “what if”, model a reasonable number, like 4, of reasonable possibilities of political inputs across a reasonable range.
thank you
The RCP8.5 scenario is used to make temperature forecasts to 2100. This scenario assumes oil production peaks at 160 million BOPD, coal production increases ten fold, blah blah, blah. Those who are reading the posts by Ron, Dennis, and others, realize that its going to be impossible to reach 100 million BOPD crude plus condensate by 2040, never mind reaching 160 million BOPD in the 2060’s to 2070’s time frame.
The fatal flaw in the IPCC work was to create an upper bound case which uses surreal (some would say rather stupid) data, and packaging it as a “business as usual” case. What follows is a tragedy: we have thousands of studies which pick up the climate model forecasts and use them for other studies. And that shit gets published as if it were gospel. Now we are supposed to listen to calls to react in a panic caused by a bullshit buildup of gigantic proportions.
My suggestion is that those of us who realize that fossil fuels are running out should point out the flaws in rcp8.5, steer them on a temporary basis to RCP6, and advocate a model revision which incorporates well documented reserve and producibility studies.
This theme can be used to push for more transparency and auditing of oil and gas reserves in OPEC and other major producers with dodgy numbers. Your cooperation will be appreciated.
Fernando, have you taken a look at Dennis Meadows Club of Rome update?
http://www.clubofrome.org/?p=326
It is also about scenarios and we seem to be right on track with the BAU trajectory.
I assume you don’t think those hold any validity either.
How about The Global Footprint Network do you just dismiss their methodology, data and conclusions out of hand?
http://www.footprintnetwork.org/en/index.php/GFN/page/footprint_science_introduction/
Just curious do you really think that we are going to stop emitting carbon tomorrow and that what we have already added to the atmosphere is having a negligible long term effect on long term global warming and ocean acidification?
I could provide a thousand links mostly to papers by biologists as to what is happening in ecosystems all over the world… such as this one.
http://www.sciencedaily.com/releases/2015/07/150709144848.htm
The big picture tells us that our ecosystems are FUBAR and it seems most of your counter arguments boil down to saying that you know more about everything than all these scientists and that our main problem is communists.
Really?!
Meanwhile,
GLOBAL TRENDS SHOW SEABIRD POPULATIONS DROPPED 70 PERCENT SINCE 1950S
http://www.sciencedaily.com/releases/2015/07/150709102850.htm
“The world’s monitored seabird populations have dropped 70 percent since the 1950s, a stark indication that marine ecosystems are not doing well, new research indicates.”
And,
CLIMATE ‘VICE’ CONSTRICTS BUMBLEBEES’ NATURAL RANGES – RESEARCHERS
http://www.bbc.com/news/science-environment-33442006
“Climate change is threatening the survival of bumblebees, significantly reducing the habitats in which they can survive……….”
And,
TUNDRA STUDY UNCOVERS IMPACT OF CLIMATE WARMING IN THE ARCTIC
http://www.sciencedaily.com/releases/2015/07/150706114229.htm
“Significant changes in one of Earth’s most important ecosystems are not only a symptom of climate change, but may fuel further warming……….”
The over-fishing has almost finished the albatross. So go many of the other birds.
There is no great way to control fishing because it is ocean based. The best we can do on land is protect the bays, marshes and nesting areas. I have seen some excellent work done in that area but there little we can do to stop the fishing problem.
Maybe an increase in the shark population is eating the other fish.
No,
http://news.fiu.edu/2013/03/100millionsharks/52935
The Old Farmer’s Almanac is much more reliable for their weather predictions (uncannily right at times) than any of the flawed models spit out by the global warmists. That’s because computer climate modeling and software is designed by computer programmers, not actual scientists, and has already been shown to be easily manipulated for political purposes in the past…so what is the point of continuing to beat a dead horse on this blog by talking about alleged climate change?
That’s because computer climate modeling and software is designed by computer programmers, not actual scientists,
By the same logic we could say no computer program about anything is worth a bucket of warm spit because all programs are written by programmers and not by those who practice that discipline. For instance the program that the auto mechanic uses to analyze your car is worthless because it was written by a programmer and not an auto mechanic. Or programs that a hospital uses to analyze blood are worthless because they were not written by doctors specializing in blood disorders but by programmers who know squat about blood. Stupid!
so what is the point of continuing to beat a dead horse on this blog by talking about alleged climate change?
Well I, for one, like to try to figure out what drives the human belief system. That is what caused them to build the world view they have and to what extent they can twist logic in order to hold on to it. Also I need a good laugh occasionally. The idea that “computer programs are no good because they were written by programmers” gave me the best laugh I have had in weeks.
What drives the human belief system is advertising and peer pressure.
Climate deniers are likely to be drivers/motorists. To halt climate change/global warming/boiling means getting rid of the cars. This is anathematic to motorists who have large sunk investments in auto infrastructure.
At the same time, the credit consequences of current oil shortages means larger areas of the world are being de-carred right under everyone’s nose. Greece, Syria, Japan, Portugal, Egypt, Yemen, etc. The issue is not whether the oil industry might-might not be able to extract 140 million barrels of oily slop per day 50 years from now … it is that there is absolutely no way the finance industry can support motorist borrowing in order to pay for those barrels.
First chance is the best: the current credit regime is falling down on our heads. Any replacement will be less capable, there will be less credit, less ‘confidence’ in any replacement system (Bagehot). When that 2d system fails the 3d gen replacement will be even less capable, the 4th gen replacement for that less so, etc.
Hi Steve,
It is likely that most people who believe the climate science are also motorists, but they drive a Prius or Volt 🙂
For many people, they would choose public transportation if it were better than it is currently in the US (most places outside of major cities) and biking or walking could work in some cases, though winter in Northern climates of the US would be tough for bicycles, and summer would not be much fun in the south.
I do not believe in IPCC conclusions from climate science and I bike or use public transportation. I do not own a car, and besides being an environmentally concerned biologist, I am trained in organic farming. My CO2 and energy footprint is probably lower than >90% of this blog’s readers.
Believing in stereotypes is like believing in catastrophic warming. Very likely to get you wrong.
We have an energy problem. We do not have a climate problem, nor are we going to have it in our lives time.
“What drives the human belief system is advertising and peer pressure. ”
Are Climate Deniers Racketeers? or just Good Fellas?
Senator Sheldon Whitehouse website:
Washington, DC – Today, in his 98th weekly “Time to Wake Up” speech on climate change, U.S. Senator Sheldon Whitehouse (D-RI) highlighted the similarities between the tobacco industry’s efforts to mislead the American public about the dangers of its product and the ongoing effort by fossil-fuel interests to cast doubt on climate science.
“Yet the fossil fuel industry continues its crafty, cynical campaign of denial and delay. Big coal, oil, and natural gas, and related industries like the Koch Brothers’ companies, profit by offloading the costs of their carbon pollution onto the rest of us. They traffic in products that put health and safety at risk, and they don’t tell the truth about their product.
Sound familiar? It should, because the fossil fuel industry is using a familiar playbook, one perfected by the tobacco industry. Big tobacco fought for more than four decades to bury the truth about the health effects of its product.
But the government has a playbook too. It’s called RICO, the Racketeer Influenced and Corrupt Organizations Act. The elements of a civil racketeering case are simple. The government must allege four things: defendants (1) conducted (2) an enterprise (3) through a pattern (4) of racketeering activity. ”Conducting” means everything from directing to aiding and abetting the activity. An “enterprise” can be any form of association or a common scheme. “Pattern” means continuity of the scheme, and for civil RICO particularly the prospect of ongoing conduct. “Racketeering activity” simply means the violation of designated federal laws, including the federal mail fraud and wire fraud statutes.”
http://climatecrocks.com/2015/07/10/are-climate-deniers-racketeers-or-just-good-fellas/#more-24320
If a domain expert cant write the programs themselves, they will provide the algorithms to the programmer who will then program them.
The software will be “User Acceptance Tested” (UAT testing) by the domain experts.
This is how software/applications are written in almost all domains.
In many cases you hire consultants/contractors who have experience in the relevant industries to lead the development effort so they are not completely ignorant of the field.
Programmers aren’t accountants, so I guess accounting software like Turbo Tax is all bunk…LOL!!!
The people that write the code for the climate models are often geophysicists, or if the physicists don’t write the code they are very familiar with the models that the code attempts to simulate. The idea that scientists don’t know how to write computer programs or that computer scientists know nothing about science is incorrect.
Dennis, “The people that write the code for the climate models are often geophysicists….” I wonder if that’s true. When I started (exploration geophysics) we did write ALL our code then began incorporating subroutines obtained from various sources then relying more and more on specialist programmers: More cost effective because oil companies always have fancy computers at their disposal and fancy programmers hanging around. You may be right though, specific problems often require their unique algorithms and no doubt a lot of scientists do write at least some of their own code. Maybe Sam Taylor has a comment?
You can take it to the bank from a real old farmer that if the Old Farmers Almanac ever gets the weather forecast right it is a matter of pure luck.
Even stopped clocks are right on the button twice a day.
I do think however that Dave knows this and his comment is all about the climate models and sarcasm.
Hi Fred,
Fernando’s main point is that the RCP 8.5 scenario requires more fossil fuels than are likely to be extracted. Roughly 3 times more energy burned per year in 2100 than is likely to be burned under a high URR scenario at peak (likely to be between 2020 and 2030 for all fossil fuels based on Mohr’s analysis).
In my view he is correct on that point.
His other point that most climate models have too high an equilibrium climate sensitivity (ECS) and that the correct ECS is around 2 C is not correct in my view. There are studies supporting both high ECS = 4C and others suggesting lower ECS of 2C. We do not know with certainty what the ECS is, but it is likely to be between 2 and 4C and experts think 3C is the best guess at present.
The precautionary principle suggests that we err on the side of caution, in my view, Fernando disagrees with me on that point.
Fernando’s main point is that the RCP 8.5 scenario requires more fossil fuels than are likely to be extracted.
I’m actually willing to grant him that point. My beef with it is that this is just one of many scenarios and he hangs everything on that one alone.
I posted a link and Doug did too about climate change, specifically warming, having severe impacts on Bumble Bees. This has nothing to do with scenarios about the future or politics for that matter. This is real world observation being made by ecologists today. It is happening now! Perhaps people don’t really understand how interconnected ecosystems are. You can’t keep pulling threads out of the tapestry forever without it having consequences.!
Climate Change is having serious impacts right now! We don’t have to wait till 2100 to see what will happen. And even if we stop burning all fossil fuels today the impacts are already baked in and we really have no idea as to what kinds of things we have already set in motion.
It is as if we are 10 meters from a brick wall doing 100 mph and we are discussing the fact that the break pads we installed earlier are actually better than we thought and they will bring our car to a halt in 150 meters. Guess what, we don’t have 150 meters… so the entire discussion is moot. It’s time to hit the eject button and hope the parachute works.
Hesitate to join in but looking a while back at scenarios projected by both Aleklett and Laherrere – and taking into account optimistically that the ocean etc continues to provide significant carbon sequestration services as now – I calculated that it was extremely unlikely that we can avoid a ‘Peak CO2’ any less than double the pre-industrial level i.e. 570ppm plus: probably around year 2100; or within a decade or so.
It would then take centuries to reduce CO2 assuming the carbon cycle is still in good enough condition to do so. Although the ppm should come off the peak fairly fast for a few decades the level then remains high by present standards for a good historical period. The results of that ongoing ‘heat pulse’ even as it moderates will continue for a very long time – centuries – before reaching full effect on the climate system – thermal inertia of the ocean for one reason: and plenty of ‘positive feedback’ still lurking in the system.
Judging by what we see now, I would agree Fred that any ‘surprises’ are most likely going to be on the nasty side, not the other way about.
best
Phil
Hi Phil and Fred.
I agree. Fernando thinks ECS is 2C and a doubling of CO2 wil not be a problem, perhaps he is right, perhaps not.
The smart thing to do faced with uncertainty is to play it safe. Most engineers realize this, Fernando is not one of them.
We were taught to look at the worst case. If it was bad, play it safe.
Worst case here is very, very bad. So– play it really, really safe.
Sad thing here is that playing it safe could be so easy, given our hugely wasteful BAU.
But we just keep the pedal to the metal. Idiotic!
”Sad thing here is that playing it safe could be so easy, given our hugely wasteful BAU.
But we just keep the pedal to the metal. Idiotic!”
DEAD ON BULLSEYE!!!!!!!!!!!!!!!!
All my right wing bau buddies are completely oblivious to the unquestionable fact that mandated fuel economy standards are saving them a thousand bucks or more a year driving their newer model trucks and cars DIRECTLY in gasoline purchases alone.
There is an additional savings involved which is substantial but hard to quantify.
This savings results from the fact that when less of a commodity is sold, the price of it tends to decline.
Mandated fuel economy standards have probably reduced our domestic oil consumption by anywhere from a million to two million barrels a day for a rough guess.
“But we just keep the pedal to the metal. Idiotic!” ~ wimbi
“While I am a pedal to the metal guy when it comes to building out renewables I also believe in the utter and absolute necessity of maintaining business as usual.” ~ old farmer mac
“I am an agriculturist by profession when I bother to work. I was a believer in the more or less business as usual model for the first half of my life although I never forgot the red faces and impassioned lectures I heard in the lecture halls over in the biology department where I took many many credits…
The biologists were a little early in their predictions of the clusterfxxks that are currently resulting from the excessive use of pesticides and fertilizers and irrigating with fossil water etc but they have been proven right in the end… I was wrong to disregard their warnings in lieu of believing the short term evidence presented by my own colleagues that everything was/is just hunky dory…” ~ old farmer mac
Let me expand on the “ongoing heat pulse” idea:
CO2 causes a continuos forcing (it reduces the planet’s ability to shed energy via outgoing long wave).
The forcing increases temperature. The higher temperature raises water vapor, the water vapor absorbs more outgoing long wave, and makes clouds.
As temperature increases the Earth radiates more energy, eventually the system stabilizes. If the CO2 hits a peak at say 600 ppm then it’s evident things won’t be nearly as bad than a stabilization at 800 ppm.
My training tells me it’s very critical to establish what’s the peak concentration based on simple market forces, and then see how this can be reduced by investing in key projects (items such as the Tesla S wouldn’t qualify for anything). It’s also important to understand how to reduce methane emissions, soot, and other minor gases.
And we really do need to get off medievalism and research geoengineering. Maybe all we need to do to get in a safe mode is to grind up rocks and expose them to rainfall.
How much rock, how much rain, how much time, how much energy?
These are, to first order, pretty simple numbers to get near to. So, anybody already done it?
Somebody tell us the answer, and then, we either do it or forget it as the case may be.
My guess, and guess only it is, that It don’t work near fast enough.
And think of the hellish noise of all those convicts in ball and chain pounding down the hills with all those sledge hammers.
Biomass pyrolysis works for certain sure, can be done anywhere with any biomass no matter what, and produces fuel gas and carbon from air to ground.
Carbon-negative fuel source. Do that.
http://www.ncbi.nlm.nih.gov/pmc/articles/PMC2996662/
“Costs for mining and grinding are estimated (22) to be €10 per tonne of sequestered CO2 (€37 per tonne of C). Taking into account costs for applications (36), total costs might be in the range of €20–40 per tonne of CO2 sequestered (or €70–150 per tonne of C). “
This comment is in response to the one made at seven eleven five fifty one by Caelan.
If anybody had asked me about peak oil back in the seventies I would have told him we would certainly run out of oil someday but the issue did not matter to me back then.
I was like most young technically well educated people – immortal because I was young(Weren’t we all when we were young ?) and confident in our collective ability to solve just about any problem.
I didn’t join the Peace Corp for basically one reason. One crusty and profane old ag professor asked me if I realized the consequences of what I would be doing -helping subsistence farmers double their production so there would twice as many people to starve when the next really bad year hit.
SO-I was not oblivious to environmental realities even back then but just not focused on the environment. I had a ” hot young blossom” of my own, the sort that Twain said enticed the Gods down from the heavens to consort with mere mortals, and other things on my mind.
Now as far as the absolute necessity for the continuation of business as usual -IN CONTEXT .
”Business as usual” for some time yet is NECESSARY and ESSENTIAL to solving our environmental problems. This may sound sort of strange at first glance but anybody who thinks about it a minute will get it.
IF we are (collectively ) successful in lowering the price of renewable energy, educating the world, inventing and deploying vastly more efficient transport, building houses that are extremely easy to heat and cool, breeding crops that need few or no pesticides, etc ,etc , etc then ALL these things must be accomplished WITHIN THE CONTEXT OF TODAYS ” BUSINESS AS USUAL”.
IF these problems are solved successfully then todays business as usual will morph into a NEW generation of business as usual based on renewables, conservation, efficiency, etc.
The flip side of the survival of business as usual is COLLAPSE.
Collapse is the LAST thing we actually want.
Collapse means everything from riots right up to a nuclear WWIII. We will NOT quit burning coal in a collapse situation – not until the grid goes down for good. We will not be deploying solar pv by the hundred of acres in a collapse, or manufacturing insulation and triple glazed windows by the trainload. There won’t be any trains running.
Of course as usual I am painting fast with a broad brush but my meaning should be clear. Collapse could come about very quickly for a number of reasons but it seems more likely to me that with luck the current version of business as usual will survive in most parts of the world for some time yet, possibly as long as half a century or more.
That seems like a long time to a monkey brain but in the context of history it is not very long at all.
Don’t get caught in Egypt.
If anybody had asked me about peak oil back in the seventies I would have told him we would certainly run out of oil someday but the issue did not matter to me back then.
I became concerned about oil depletion during the Carter administration. And I have been concerned about it ever since.
Therefore, for decades I have felt we need to plan for the end of cheap oil, and also do what we could to slow down its use.
The climate data hasn’t changed my thinking other than to perhaps add some urgency on the timetable. So all the discussions about the data and its political interpretation is of interest, but about as much interest as new space discoveries. I don’t feel it has much to do with my life personally.
And I continue to be surprised that anyone feels the need to point out the holes in the data and the theory as if that might change how people and countries will respond to energy production, distribution, and use.
Coal was likely going to be phased out by gas anyway. And China realizes it needs to move away from coal not because of climate but because of air pollution.
Nuclear would be a good solution to reducing CO2 generation, but the economics aren’t favorable.
As for moving toward solar, wind, EVs, and distributed generation, those were going to happen anyway no matter what the climate data. They are increasingly becoming more economic, they are less polluting, they provide more local control of energy, and they are growing industries that should make some folks money.
Fernando
I think I was painting an optimistic picture and at the same time assuming fossil fuel depletion would be as quick as Aleklett et al think.
If I am more pessimistic, the extreme rapidity of the forcing taking place now and I assume for the next 100 years, is outside relevant precedent in the geological record of a few million years, and this has its own uncertainties – call them dangers. For example, the resulting stratified ocean (slow turnover) flags up enormous risk.
Unless they decline early because the fossil fuel is in part replaced by more expensive alternatives, I can imagine that industrial networks will exhaust most of the Aleklett inventory in the next decades, and even use up in addition some presently economically stranded fossil fuel assets. Thus ‘industry’ might in extremis feed itself for longer than we think now, and we end up with a more prolonged heat pulse than I am guessing at. But whether industry sags early or late, I cannot see super-large non-profit projects to repair the biosphere becoming possible. There is very little chance of escape in my view.
Phil
I don’t know, Phil. Some of the renewables subsidies are so bizarre and expensive it may be worthwhile to pay Congolese to grind up volcanic rocks and spread the sand over the ground. At $50 per ton it’ll may just get them out of poverty.
And I’m always looking at the potential wildcard on the + side. We MAY be entering a Maunder Minimum. If that’s the case we are going to cool down for a while.
Some of the renewables subsidies are so bizarre and expensive it may be worthwhile to pay Congolese to grind up volcanic rocks and spread the sand over the ground. At $50 per ton it’ll may just get them out of poverty.
That could be true. But what is accomplished by encouraging people to consume more and more fossil fuels?
Does it make financial sense (other than to enrich certain groups) to use up resources that can’t be replenished?
Fernando
The recent work by Professor Valentina Zharkova seems to prompting a number of highly qualified fuzzy heads to take another look at some of the climate related data and … think about it.
Coffee, I already saw one climate model result for a Maunder type event. It shows severe cooling over the northern hemisphere.
And I also showed you another model that predicts only 0.1-0.3° C cooling from a grand solar minimum.
Plus the experience that the Sun is in grand minima 27% of the time (one every 250 years on average with a mean span of 70 years). It cannot be such a terrible thing if it is so frequent.
Hi Fernando,
The Tesla Model S is no different than the Mercedes S series or BMW 7 series and is meant to compete with those high end cars. EVs are probably not the best way to solve the eventual liquid fuels problem, just one solution amongst biofuels, CNG, rail, light rail, and buses.
Fossil fuels are likely to peak before 2030 oil first, then coal, and finally natural gas.
We should focus on both the climate change and peak fossil fuel problem and solve both problems by finding substitutes for fossil fuels and attempting to eliminate their use before depletion forces this change. When we have accomplished that we can focus on the best way to grind up rocks (and whether that is in fact a viable solution without unintended consequences).
Maybe a vast mobilization of planting and nurturing a whole lot of native vegetation– including food forest gardens/permaculture/etc.– around the world by many people around the world would help with carbon sequestration? And greening some deserts? If this is done and much of BAU is abandoned, cold turkey, this could be the appropriate smooth transition that many are concerned with.
Relying on leveraging the wreck that is BAU for this smooth transition seems just daft, like, maybe relying on someone who committed a murder to make autopsy and funeral arrangements for the victim’s family.
Actually, I think what you say is the ONLY way to do something that might work at the scale and speed we need.
This conclusion after at least 5 minutes of deep analysis.
Now, everybody hear that? So, get together and do it. Now. Chopchop.
Kuzu anyone?
Right,Right,Right Fred. So glad to see somebody around here with their eye on the ball. I was starting to despair.
Now I return to my parachute factory.
And maybe a glassa beer might help a little.
Make mine a cider. Beer tastes like hell and is way overrated. Maybe I should at least try a beer with some chocolate chip cookies or caramel and nuts popcorn.
Mind you, I have cooked with beer to good success and very much enjoyed Stubbes’ European beer and dark chocolate truffle. (third from right side at bottom). Probably my favorite actually.
So maybe that’s how I should
drinkeat my beer… And maybe explore some European and other unusual beers if I am thirsty and wish a flavor sensation.Hey Wimbi, I’ll join you for one of those cold beers!
Fred: ref “My beef with it is that this is just one of many scenarios and he hangs everything on that one alone.”
I emphasize RCP 8.5 because it’s the extreme outlier, it’s the weakest, and it is used by scientists for thousands of follow up studies. It’s also used in agency, NGO, activist and government propaganda as the “business as usual case”.
What this leads to is a ton of hard work by naive scientists who use the IPCC product without questioning it. On top of that we see lots of people having panic attacks over a non issue.
What I’m trying to emphasize is the need to perform a very high level study to establish fossil fuel resource boundaries, what can be produced and at what cost. A parallel study needs to research how deep renewables can penetrate worldwide and at what cost and what subsidy level.
With that in hand they can run models to project emissions scenarios with a better set of numbers. This in turn can be fed to climate models and we can see the spread of results.
The propaganda machine within the IPCC knows very well they have a serious weakness and are trying to create “peer reviewed literature” to back their outsize fossil fuel projections. This effort seems to have started around the time I started writing comments about RCP8.5 being flawed.
I’m not saying I triggered it but I rarely read others writing about this.
Blair, the Chemist in Langley wrote a post about it, and a few others mention it. But I’m the terrier hanging on to the bone. So let’s see what happens. I don’t have much hope this will ever be fixed, we got too many people whose careers are already set based on the rcp8.5, so it’s like a religious book, it can’t be challenged.
Mother Earth cares naught about any human laws, modeling or anything but the filth in the air- put there by us. And she is saying ever louder by the day that she already has more than enough to make us regret it, and the more we toss up there the more deeply we are going to regret it later.
“Turn back, O man, forswear thy foolish ways
Old is the earth, and none may count her days
But thou, her child, whose head is crowned with flames
still will not hear what her voice proclaims”
What this leads to is a ton of hard work by naive scientists who use the IPCC product without questioning it. On top of that we see lots of people having panic attacks over a non issue.
Fernando, you continue to discount the work of thousands of scientists who are NOT using IPCC projections for anything! These scientists are in the field making observations and collecting data today. They are reporting what they are seeing and expressing growing concern over what they are seeing.
They are telling us, that based on their current observations, the climate is changing faster than expected and that this is too fast for myriad organisms and as a consequence entire ecosystems are on the verge of being wiped out.
Granted biological evolution tends to continue even after mass extinction events but based on what we know from the fossil record, that may not be a very good thing for us.
F Magyar,
Very well put, Fred. Thank you.
Fred, I’m not discounting anything. The bulk of dire projections are based on IPCC projections. And these dire projections are being used to drive the public and politicians to make irrational moves.
The bulk of dire projections are based on IPCC projections.
No Fernando, they are not! An ecologist reporting from the field is not looking at IPCC projections! He or She is telling us what is happening on the ground today and what is happening is massive change. They are witnessing and reporting a massive extinction event and there is overwhelming evidence from myriad fields of very diverse scientific inquiry to back up those reports!
“First, let’s acknowledge the irony in all this: Life on Earth is the scramble for energy-rich carbon; lately humans have dominated that competition; and now that domination is undermining life on Earth. We’re #1 for now, and it turns out that being #1 in this fashion means that over the long haul we lose big. And, increasingly, the long haul looks like it’s going to be a short trip. Our grandest failure is the product of our greatest success.
So, our task is to face a simple question that has serious consequences: Is the human with the big brain an evolutionary dead end? If so, what are we going to do with our species’ time remaining?
“Homo sapiens’ domination of Earth is coming to an end, not in some imagined science-fiction future but as the result of today’s processes of resource extraction and waste generation. The trajectory of the multiple, cascading ecological crises that define our world cannot be predicted with precision, but the trend lines are clear enough. Our task is not to figure out how to maintain the illusion of human control of the ecosphere—and it always was an illusion, even when we seemed to be more successful—but instead, borrowing from my friend Jim Koplin, “to learn to leave the planet gracefully.”
-Jensen
Thanks for the links. I am not very skilled at finding this stuff myself.
I am bookmarking them this time.
I have not said ” nobody ” questions the questionable assumptions.
What I have said ( or INTENDED to say at least!) is that I do not know of a single case of a prominent spokes person or ANY spokesperson for the climate science community publicly saying that the business as usual scenario used to create the RCP 8.5 scenario is complete and total bullshit .
This scenario runs ENTIRELY at odds to just about every thing I have ever read written by professionals involved in environmental work in other fields- professionals who are not directly invested in the climate issue.
And when it comes right down to it I have a certain amount of expertise in these matters myself when it comes to what is physically possible given ecological and resource limits.
The RCP8.5 IS BULLSHIT.
Constantly promoting the predicted consequences of this scenario is a lie by omission if I have EVER heard one, and the same sort of propaganda technique used by the anti science crowd on so many occasions.
But this does NOT mean forced climate change is bullshit. It simply means that there IS POLITICAL MANIPULATION INVOLVED in discussing the actual data in public. . There are good reasons to believe that we have ALREADY passed some critical tipping points and the non linear nature of the problem means things MIGHT get a lot worse than three or four degrees even if we quit burning coal today.
Pardon my french folks but anybody who believes in LIMITS TO GROWTH in general and peak oil and peak soil etc etc etc and who also credits this scenario as being realistic is has his head totally out of sight up his backside.
Fernando is fucking A one hundred percent RIGHT about this. (He is also quite a bit closer to the mark about there still being commies around than most of us suspect. It is true that the exact flavor of despots is not especially important but commies have a sort of religious dynamic that enables them to hang in there in academic and political circles in a way that ordinary scumbags cannot match. )
This sort of behavior is one hundred percent par for the course when it comes to just about ANY ISSUE and any particular group of people, professional or amateur.
When I was teaching and it was already PERFECTLY OBVIOUS that tobacco is a KILLER drug I was hauled into a state level supervisors offices to get my ass chewed out for refusing to teach a basic unit on tobacco and substituting one on the health risks involved. The best I could do was either get fired or give it up. So the next time I turned in my calendar it included the unit on tobacco production. But I didn’t teach it.I just let the other units take an extra day here and there until there was no time left for it.
The following year I just gave it up and went to work at the nuke. They paid about five times as well anyway.
How many of us have heard a doctor moaning about the high cost of health care point out that the average doc is making upwards of half a million bucks a year these days ?
Everybody goes along to get along once they are enmeshed in a large program involving dozens of layers of bureaucracy. You either conform or you find a new line of work.
In medicine for instance there was at least ONE brilliant woman who as a med school professor was teaching that you can cure ulcers with antibiotics FORTY FUCKING YEARS before the profession as a whole recognized this now perfectly obvious truth.
But nobody would support her or even consider her evidence. The urge to conform was too strong.
Given all the evidence presented in forum such as this one hardly anybody in the msm takes peak oil seriously.
For sky daddys sake we are all just one damned big bunch of tailless monkeys. Why anybody would expect better escapes me.
Of course I DO understand the necessity of maintaining a united front in opposition to the united front of the entrenched fossil fuel industry when it comes to this particular issue, and so I go along myself in all other forums where I post under different handles at times.
But this need for unity does not necessarily extend to discussing this matter among the regulars in this forum. Only an extremely minute percentage of the public will ever read a site such as this one until AFTER the shit hits the fan hard and fast.
My own PERSONAL agenda is to go wherever the facts lead me. If I am wrong then there are people here in this forum who are smart enough to point out my errors and I will change course as necessary.
You got it Old Farmer. The system resists new knowledge and heavily persecutes those who stray from the line of acceptability. I know many examples of this but here is one. The medical system refused to acknowledge the Lymes epidemic and the work of a researcher proving that the effects could be relieved quickly by using cholestryamine (an old cholesterol lowering drug which is basically a highly branched polystyrene with trimethyl ammonium end groups). The researcher had discovered the mechanism of how the lymes spirochete causes nerve damage and found a way to quickly remove the low molecular weight neurotoxins. It took a decade for this method to be accepted and legalized. Meanwhile people suffered greatly.
Another was the research into frog mutations found downstream of farms. The research team found that the frog mutations were caused by a pesticide at very low levels. Apparently at higher levels the frog’s antibody systems eliminate the toxin but at very low levels it sneaks “under the radar” and acts as a mutagen since the antibodies were not activated.
The old school “the dose makes the poison” bureaucracy shot down the research and I don’t think it has been accepted yet.
Hi Old Farmer Mac,
The average physician does not make $500,000 per year.
See
http://www.medscape.com/features/slideshow/compensation/2014/public/overview#2
On slide 2 the income depends on the doctor’s specialty, the range is 174k to 413k.
For the primary care physician (non-specialist) the median salary is $156k according to
http://www.payscale.com/research/US/Job=Family_or_General_Practitioner/Salary
Yes my mistake, I intended to say specialist physician. To the best of my knowledge quite a few make a good bit more than actual ” salary”.
Hi Old Farmer Mac,
Just because a few make a lot does not mean they all do. Warren Buffett is a multi-billionaire, that does not make it so for all investors.
Oh, and not even the highest paid specialty has an average salary of $500,000 per year, so if you had sais specialist physician you would still be wrong unless you were very specific about the specialty.
Physicians certainly do well, but most physicians are not as wealthy as even intelligent people such as you, think they are.
I am using the same technique as the political portion of the climate establishment is using , lol. To wit, misrepresenting the facts by painting extremes as norms and exaggerating.
😉
Forced climate change scares the hell out of me but it does not scare me half as bad as the MORE LIKELY consequences of overshoot which we will have to deal with much sooner.
Times are going to get to be very tough and rough indeed , barring miracles, within the next half century. I am not knocking any miracles that might happen to come to pass but good sense dictates not basing our hopes on them.
Please everybody note that all the links aimed at Fernando are NOT actual proper responses to his arguments. The decline in sea birds for instance is almost for dead sure a consequence of overfishing – part of overshoot in general- rather than a consequence of changing climate.
Of course in the last analysis forced climate change can be attributed to overshoot too.
But the climate has not YET changed enough to explain such issues as the depletion of fish stocks etc which are very easily and convincingly explained by overfishing, loss of critical nursery habitat, pollution etc.
It’s all fossil fuel driven technology guided by a completely false sense of good.
Too many mouths, too few fish.
Hi MarbleZepplin,
Old Farmer Mac’s point stands. Many of the environmental problems are unrelated to climate change. More related to human overpopulation destroying the natural world. Ironically, a higher standard of living seems to help with the overpopulation problem as the explosion of both population and wealth since 1965 resulted in half the number of births per woman wordwide from 1965 to 2005 (from 5 to 2.5). If we get to 1.25 births per woman by 2050 and then remain at that level for 200 years, then human population falls to under 1 billion and might be a sustainable level for the planet or we could go to 500 million in 250 years. In my view less is more to give the planet a chance to heal.
Dennis
I didn’t mention climate change.
OFM
I think your comments, while having a reasonable basis, are aimed at a feature rather than a bug, and really miss the issue.
If you look at figure 5 in the primer it shows how IPCC changed their methods. On the left is how they previously did things, which is to try and develop a socio-economic model, giving GHG values and a radiative forcing curve. If they still did this then your criticism would be valid. However as the primer states this process was very slow – the model is highly nonlinear and there are (to some extent subjective) feedbacks so that a warming climate will change how the world works and what GHGs are emitted. Therefore this was a highly iterative process.
They have therefore switched to the method on the right, which is that they generate four, “reasonable,” forcing curves. This is more an interpolative method, and as such must span the expected solution points (or where the IPCC thought those points were about 10 years ago when this was being put together). The low case should be a bit better than the expected minimum scenario and the high case should be slightly higher than the worst imaginable. Also as the system is highly non-linear the more internal curves the better, but this has to be weighed against the time to generate the models and analyze them, so they have two.
These four scenarios are then handed over to the second row in the diagram for analysis – part of which is to come up with a narrative that explains the GHG emissions as they have been shown. The models have one set of narratives but really any team that uses them can come up with and critique any narrative they think fits. As is said about the RCPs: “They are representative in that they are one of several different scenarios that have similar radiative forcing and emissions characteristics.” I
If there are no reasonable scenarios that can match the high case all the better, but that doesn’t mean that any work done is wasted,; and it would be far worse if a less severe high case was chosen resulting in some issues being missed. Ideally there would be a set of probabilities for achieving each scenario (i.e. the sum of all narratives that produce that trajectory) but that’s probably too much work at this (or really any) stage.
By having a common set of scenarios it means the research teams have common starting points as a basis for debate, and I’m sure a lot of that debate concerns the sort of issues you are raising. Since the scenarios were developed there have been changes in the expected URRs for fossil fuels. However just looking at coal, by WEC 2013, there are 891 Gt of reserves which is about 300 ppm of CO2 (assuming 70% goes to the atmosphere), but WEC indicate there may be 4 to 5 times as many resources – which is enough to give the forcing in the RCP8.5 case alone (of course the probability for full use of everything would be very low). Equally feed back mechanisms that may increase GHGs are being identified, and are still very poorly understood. These are not just hydrate releases although that is probably the biggest store, but include for example: rotting vegetation from melting permafrost, release from the shallow seas as they warm, release from the deeper Arctic seas as sea ice is lost and wave action can work down to the sea bed, fee methane trapped beneath permafrost, peat bog decay, tundra forest fires, tundra peat fires, tropical forest burning etc. I would be happy to find that every one of these is completely insignificant going forward, but nothing I’ve seen leads me to think this is likely; to ignore these issues without proper consideration would be extreme hubris.
I only know some of the people working directly on this at second and third hand but they are as aware and knowledgeable, and probably more concerned and intelligent than the average poster here, and to describe their work as bullshit is belittling to you and them.
Sorry that went on so long – and if it was a repeat of something already given elsewhere here of from the previous post.
See: https://www.worldenergy.org/wpcontent/uploads/2013/10/WER_2013_1_Coal.pdf
The follow up work is wasted if the rcp8.5 model results are used and presented as “business as usual”. I think the IPCC and other responsible parties are guilty of scientific fraud when they misrepresent how rcp8.5 came to be, and what it really means. It’s fraud, buddy.
I think the IPCC and other responsible parties are guilty of scientific fraud when they misrepresent how rcp8.5 came to be, and what it really means. It’s fraud, buddy.
What is the motivation to commit fraud?
And if you say they do it to maintain their sources of funding, then why would their sources of funding want to commit fraud?
What does fraudulent climate data accomplish that the economics of energy is going to accomplish anyway?
It seems to me we have found evidence of VERY LARGE SCALE scientific fraud and your defense is the presumed lack of motivation? Hell, what drives unethical behavior and scientific fraud? Why don’t you look it up?
It seems to me we have found evidence of VERY LARGE SCALE scientific fraud and your defense is the presumed lack of motivation?
I don’t think we have seen evidence of very large scale scientific fraud.
You start with a scenario that you say won’t ever happen because we’ll never burn up that much fossil fuel.
Fine. I haven’t checked your figures, but I’ll accept that at face value.
But here’s where you lose me.
1. You are saying that the extreme scenario is evidence of fraud. But I’d need more info for me to believe that. Perhaps it’s just a matter of tossing out a scenario that could happen if we proceeded at our current rate. That’s not fraud in my mind.
2. You say fraud is committed in order to panic the public so that communists/leftists can take over. That definitely doesn’t make sense to me. There are better ways to panic the public.
So if you had just stopped with “extreme scenario can’t happen” I wouldn’t think anything of it.
However, when you say it is fraud committed by leftists/communists to take over the world, I don’t buy that.
“I think the IPCC and other responsible parties are guilty of scientific fraud ”
Only deniers use that meme, but, of course, you deny being a denier.
Hi Sunnyv,
I think conventional oil reserves (subtracting Orinoco belt and Canadian oil sands) are about 1300 Gb, based on BP data, so 3 times that is 3900 Gb of unconventional oil reserves.
The question that I would ask is, does this WEC estimate seem reasonable?
My answer would be a definitive, no!
The most reasonable estimate is found in Steve Mohr’s PhD Thesis from 2010
a summary is at link below:
http://www.theoildrum.com/node/6782
see table 8.2 and 1 Gboe=5.73 EJ
full thesis at
http://ogma.newcastle.edu.au:8080/vital/access/manager/Repository/uon:6530
His case 2 is his best guess and for conventional oil resources his guess as a little too low in my opinion (if conventional is defined as all oil that is not extra heavy with API <10 or kerogen) at 2300 Gb for C+C+NGL which I would put at 3200 Gb (with 400 Gb of NGL), but his estimate for extra heavy oil (extra heavy plus natural bitumen in his table) is about 800 Gb which is reasonable.
His case 2 estimate for shale oil (kerogen) is about 1000 Gb, which I think should be at most 750 Gb, but realistically will be zero due to water constraints.
Note that we have already produced about 1300 Gb of C+C+NGL, so using even optimistic projections of future URR of 3500 Gb of C+C+NGL-XH plus 1800 Gb of XH (including 1000 Gb of kerogen) we get a total C+C URR of 5300 Gb.
When we subtract cumulative output we get 4000 Gb total reserves (existing plus future potential reserves). Then we need to deduct current conventional reserves of 1300 Gb and 900 Gb of future conventional discoveries and reserve growth and we are left with 1800 Gb of unconventional future reserves (including 1000 Gb of kerogen which is unlikely to ever be produced).
So the 3900 Gb of unconventional technically recoverable resources estimate is at least a factor of 2 too high and it is more likely to be too high by a factor of about 4 or more.
The RCP8.5 scenario should only be considered realistic, if one accepts the cornucopian position, I do not, and agree with Fernando that the scenario is not realistic.
If you are arguing that it is consistent with many of the projections by the IEA and EIA, I would agree, but those forecasts are also not very realistic imo.
According to Figure 14 the total oil and natural gas used in RCP8.5 is less than RCP6 and about the same as RCP4.5; and the statement is given: “The use of oil stays fairly constant in most scenarios, but declines in the RCP2.6 (as a result of depletion and climate policy).” The big differences for RCP8 is the huge increase in coal use and a large switch from vegetation (which I think means forest) to grassland. No one can deny that there is a lot of coal left and the trend in land use at the moment seems to be in line with that scenario. This site has a lot of knowledgable persons posting but I’m not sure there are experts in those two aspects here. I think also that the IPCC models specifically excluded a lot of positive feedback loops so the coal use could be looked at as a proxy source of greenhouse gases from. for example, permafrost melt leading to vegetation decay or hydrate release.
Hi A Yeats,
The key concern is how much coal gets extracted and burned. There is much less coal that will be extracted than many realize. Rutledge estimates about 700 Gt and Steve Mohr’s best estimate is about 1000 Gt, so again the RCP 8.5 falls down there as well. With a well thought out supply and demand model, even Steve Mohr’s very optimistic(or pessimistic if one cares about the planet) case 3 does not come close to the RCP 8.5 scenario (case 3 coal estimate is 1400 Gt or about 2 times the David Rutledge estimate and case 2 is about 1000 Gt coal).
See fig 8.11 on page 155 of the thesis chart A showing 12 of 40 IPCC scenarios from AR4 compared with 9 scenarios from Mohr’s thesis, note that Mohr only chose the IPPC scenarios with less than 105 Gboe/y output in 2100 (the lower scenarios) for comparison.
From the paper on the RCP 8.5 at the link below (page 12 fig 4) the output of primary energy in 2100 is 1700 EJ/y (296 Gboe/y).
http://link.springer.com/article/10.1007%2Fs10584-011-0149-y#page-1
Nearly all of this is fossil fuels in this scenario. In Steve Mohr’s more reasonable case 3 (which is still very high), the peak of fossil fuel output is less than 600 EJ/y (105 Gboe/y), Gboe is a billion barrels of oil equivalent.
Mohr excluded scenarios like RCP8.5 because they are so far fetched. Chart below.
Yes, I think this forum is onto something big. The IPCC is clearly a communist conspiracy. The cited link for the energy scenario we are discussing is —-
WEC (2007) 2007 Survey of Energy Resources, World Energy Council, London W1B 5LT, United Kingdom, ISBN: 0 946121 26 5
I have traced this to the World Energy Council at http://www.worldenergy.org/ which is clearly a communist group.
it gets worse. The WEC was apparently started by a Scotsman!
That link you show has no data. Furthermore the World Energy Council, even in their most drug addled dreams , wouldn’t back up the IPCC figures. So far all I get is bullshit.
WEC (2007) 2007 Survey of Energy Resources, World Energy Council, London W1B 5LT, United Kingdom, ISBN: 0 946121 26 5
http://ny.whlib.ac.cn/pdf/Survey_of_Energy_Resources_2007.pdf
Ok. That’s a 600 page report. Now show us where it supports the IPCC rcp8.5 numbers? As far as I can see it doesn’t.
re “WEC 2007 doesn’t support RCP8.5…”
see, for instance, chapter 4 “Natural Bitumen …” pg 135 (per page numbering, not pdf sheet number).
resources 2.5 Trillion bbls OOIP….
recover 1/3 of that, things start to add up.
(would be an economic and environmental debacle, but is technically possible).
It is terribly annoying they don’t have a summary section.
And this WEC 2007 was only 1 of several references.
Plenty of projections of total liquid fossil fuels in the 3 to 4 trillion boe range.
Technically possible, economically insane.
But that wouldn’t stop the likes of Stephen Harper, Jeb Bush or Tony Abbott from trying.
You don’t show me the link between the WEC report and a quality estimate of extra heavy oil potential. When Dennis discusses the total ultimate oil resources he includes a sound, well reasoned amount of extra heavy (what you call “bitumen”).
Look, there’s no way anybody in their right mind can support the rcp8.5 estimate. I see a lot of rearguard action trying to protect an indefensible figure.
I’m not trying to defend RCP8.5, I don’t know enough to be able to, but the objections given to it above are incorrect. The reason for generating the scenarios is given by IPCC as being to engender debate amongst modellers and those looking at the consequences and I think they have succeeded in that (although some deniers’ non-evidential rants might be stretching the term ‘debate’ a bit). However I don’t see much real action of any kind at government levels being taken as a result of these models, so the debate is just an academic exercise. There is action being taken that will mitigate some climate change but really it’s more from private companies and often based on weather events over very recent history, and for renewables is difficult to know whether the drive is from knowledge of global warming or because of fears due to fossil fuel shortages.
I also think if the feed back mechanisms that can generate non fossil fuel greenhouse gases in great volumes do kick in then RCP8.5 might be seen as an underestimate.
On coal use – do you think it will all stay in the ground if it come to the point of people knifing each other in gas lines in Baltimore, or perpetual rolling black outs through southern and eastern Europe, or China fighting USA, probably by Proxy, for some oil in Venezuela or Africa?
If IPCC is planning to update these maybe the next set we will be more representative of current knowledge (or at least that from five years previously as that seems to be the cycle time required).
Good comment, thanks.
Evidently you don’t know anything about RCP8.5, nor do you understand how it is used and mislabeled? Sounds like you got a case of ignorance coupled to an urgency to defend something you don’t know anything about. What is driving you? Religious faith?
Hi A Yeats,
If you were referring to my comment, it would be clearer if you said hi dennis. What objection is incorrect?
You should take a look at Steve Mohr’s PhD Thesis or the summary presented at the Oil Drum. Do you think his thesis was incorrect?
If you do not think fossil fuels will ever peak and the musings of Michael Lynch and Daniel Yergin on the unlimited nature of fossil fuel resources are correct, then the RCP8.5 makes perfect sense.
The simple point is if you think that fossil fuel resources are limited, you cannot also believe that the RCP8.5 scenario is reasonable.
Also note that the melting methane hydrates scenario is not a mainstream climate science view, that might happen in a worst case scenario in 2400, but it should not really be a part of serious discussions. Read Real Climate for the mainstream view.
Also note that the melting methane hydrates scenario is not a mainstream climate science view,…
Where in God’s name did you ever get that idea?
Scholarly articles for arctic methane hydrate emissions
And this is just one of the dozens of scholarly articles, but it is a very important one:
Seven facts you need to know about the Arctic methane timebomb
And this one: PRESS CONFERENCE ANNOUNCEMENT
Arctic Methane Emergency Group
I could post literally dozes of such articles. Methane release is starting to get the attention of just about everyone in climatology these days.
The melting of methane hydrates is a very mainstream view. You are behind on your climate science Dennis. You should try to catch up.
Ron,
I very much share your concerns and I very much have been tracking some of the science on methane hydrates. However, as a report on mainstream climate science concerns Dennis is right. The IPCC reports have a passing nod to the issue but indicate that there is no evidence at this time to suggest this is major concern. I consider this quite astonishing. Frankly, I don’t see how we can expect the mass of carbon in the Arctic to stay in the permafrost or in the shallower areas of the Arctic Ocean. I have been telling my friends that the IPCC review process seems to be broken.
The comments made by Dennis , Ron, and Don just above are perfect examples of the problems associated with the ” go along to get along” meme in any large bureaucratically controlled organization.
The modeling which is most commonly(actually almost exclusively ) cited in the msm assumes fossil fuel use which is unrealistic. The lack of inclusion of huge methane releases in the Arctic is equally unrealistic although the reasons for this lack are more justifiable. Adding a lot of methane into the climate cake in the oven is PERHAPS NOT YET justified by an adequate amount of data.
It is not the SCIENCE ITSELF that is at fault but rather the way it is being reported and manipulated by both the environmental camp AND the fossil fuel camp.
Of course you must sometimes fight fire with fire.This means oversimplifying cherry picking data to get the message out in a sound bite world inhabited by tailless monkeys.
Here is a link to a WSJ piece by a guy who works at IHS.
There is a lot of very good commentary in it regarding the international political situation as it relates to oil supplies but he manages to very skillfully avoid mentioning the frack log back up of wells drilled but not yet completed which according to the opinion of the folks in this forum has a hell of a lot to do with tight oil production holding up so well in the face of the low price.
It seems totally unrealistic to me to think that the tight oil industry can reduce costs as fast as this fellow predicts.
http://www.wsj.com/articles/whats-giving-the-world-oil-market-the-jitters-1436569628
Whereas the things he does say are apparently or obviously true, the things he does not mention are elephants in the living room- things such as hedged prices, the back log of wells awaiting production etc.
In order to read this article you may have to access it thru google news or some other trick to penetrate the paywall.
I found many articles on the web about methane hydrate release. Some regarded it as serious but not catastrophic. Others had a different position.
Emerging Methane Sources: A Bang or Whimper?
Will continued warming of Arctic regions destabilize permafrost and methane hydrates rapidly increasing global atmospheric methane that results in a catastrophic climate change emergency? These risks are currently described in two different guises, with unconventional gas as persistent and gradually unfolding threat and Arctic rapid warming and release of methane as a low-probability event that could in an instant change everything. Current research is far from answering the question of whether these emerging methane sources will lead to a climate change bang or whimper.
The jury is still out but mainstream science is seriously looking at the problem.
I can post dozens of articles about aliens landing at Roswell
I am reply to Ron’s comment “The jury is still out but mainstream science is seriously looking at the problem.” Frankly the science effort seems so profoundly lame that I would suggest that it cannot be considered to be serious. I see little effort even to discern if the atmospheric methane is coming from the permafrost or ocean hydrates. There is a hypothetical mechanism suggested that bacteria could eat the methane from the permafrost and thus significantly mitigate the risk. Well if we are betting the future of humanity on this possibility wouldn’t it be good to actually test this hypothesis? I don’t see this effort. I don’t know if the lack of science comes from lack of funding or the lack of scientists who are willing to work in the far north. However, if we are going to be serious about the science we need to do the required work.
It’s not a “hypothesis”. Methane is edible. If we look at shallow land cores (I have), we can see a layer full of frozen organic material which will gradually thaw out. Our estimates range down to an additional 2.5 meters beyond the current thaw layer, but this thawing effect takes place over decades to centuries.
As the layer thaws there’s bacterial activity, similar to a rice paddy or a garbage dump. These bacteria generate methane and the methane in turn has to work its way through the soil. The process allows some bacterial feeding on the methane, and methane which does escape turns into co2 within years.
I think the key is to remember that as the thawing penetrates deeper the overlying layer gets thicker. The deeper permafrost can be several hundred meters thick, but that’s just too deep to be impacted very fast. And this is why this is considered something to watch but not a critical issue. The methane hydrates below 200 meters water depth are a bigger problem.
However I don’t see much real action of any kind at government levels being taken as a result of these models, so the debate is just an academic exercise.
That one reason I have not been persuaded that a certain set of numbers have been published for political reasons.
Claiming climate scientists have a political agenda strikes me as relevant as saying scientists who investigate the origins of the universe are doing so BECAUSE they want to undermine the Bible.
Also, if we won’t reach the RCP 8.5 scenario because we either willingly reduce CO2 production or because we are forced to do so as supplies run low. what’s the difference?
So I don’t see the point in protesting the RCP 8.5 scenario as a political concoction.
If it isn’t going to happen because of reduced CO2 (however it might be achieved), that’s a good thing right?
Oh, so I identify a weakness used to justify irrational actions and I’m supposed to drop it because the weak case is so far fetched the whole thing doesn’t matter?
I happen to think the flawed case continues to be used as a political weapon, and given the nature of such politics I’ll keep bringing it up.
And you know what makes my task so difficult? Republicans are cornucopians, neocons and racists, whose political edifice requires ignoring global warming and defending that stupid drill baby drill slogan. No wonder the USA is going down the tubes, both sides got idiots running things.
I happen to think the flawed case continues to be used as a political weapon, and given the nature of such politics I’ll keep bringing it up.
I still don’t see how global warming data has changed or will change what is happening for economic reasons. I still don’t see a political motivation.
Yeah well, all the IPCC work needs to be reviewed and improved better documented cases generated so the public and politicians can see honest projections and not the fuzzy crap they have been generating. I’m going to sleep, don’t bother to answer.
The bolivar hit 617. Miguel Octavio rán a regression and found the bolivars per dollar increases at 177 % exponential rate. But he says they aren’t printing that much money. He thinks it’s a full panic, everybody is racing to get their money out of Venezuela.
All these climate models might be worthless if something bigger comes into play: http://www.sciencedaily.com/releases/2015/07/150709092955.htm
That’s not a big deal. The key is to understand it’s not solar flux being reduced. The overall effect could be similar to the Maunder Minimum, or about half of the current energy imbalance. This means global warming will take place at half the rate (more or less).
The only thing that will stop the RCP 8.5 scenario from occurring (or something similar) is a severe change in politics and business worldwide. Otherwise as one fossil fuel, say oil, becomes less abundant other fossil fuels will be increased. I see no large scale changes at this point. Small changes yes, but not nearly enough.
Politics and business must actively switch away from fossil fuels long before they are depleted in order to prevent a doubling of CO2 equivalent in the near future (25 years). We are not far away now from the first doubling now.
Hi Marble Zepplin,
There are not enough easily recoverable fossil fuels to make RCP8.5 happen. Please read the following link it is not very long.
http://www.theoildrum.com/node/6782
Steve Mohr’s case 1 is similar to the forecasts of Jean Laherrere and the most pessimistic views (less fossil fuel) of peak fossil fuels think those forecasts are too optimistic, case 3 agrees with the more optimistic views of fossil fuel resources.
The case 2 of Steve Mohr is quite reasonable in my opinion and would lead to carbon emissions between RCP4.5 and RCP6.0, even case 3 would not come close to RCP8.5.
For Michael Lynch RCP 8.5 might seem somewhat reasonable, for those that think peak fossil fuels will become a reality within 15 years or less, it is logically inconsistent to think that RCP8.5 to be a “business as usual” scenario. It would only be business as usual if fossil fuels were essentially unlimited.
In the chart that follows 1 EJ=10^18 Joules=5.73 billion barrels of oil equivalent.
WHOA UP THERE DUDE,
I have never said the RCP8.5 was invented to create hysteria. You are totally misrepresenting what I have actually said- which is that the RCP 8.5 is based on totally unrealistic fossil fuel production predictions.
I KNOW it is only a fossil fuel consumption high side scenario – I have intended to convey that impression, although reading back over my comments I now see clearly that I painted too fast with too broad a brush .
What I have been trying to get across is that the political element among the climate science professionals, the environmental establishment, and the leftish or liberal portion of the main stream media TREAT IT LIKE GOSPEL. You can read hundreds of articles in the popular science and mainstream press without hearing this scenario being properly described as what it is – a high side scenario.
So I do need to clarify my position a bit- I should not have said the RCP9.5 is total bullshit but rather that it IS a high side fossil fuel modeling tool. What I SHOULD have said is that the USE BEING MADE of it is BULLSHIT because it IS being treated like gospel. I have not heard of any climate scientist clearly pointing this out in the MSM. No doubt some have and will again but the fact that I am not aware of it happening given the amount of time I spend reading the news is ample to make my point.
(I am mostly confined to sitting in the house these days looking after my extremely old Daddy.This is why I have so much time to comment. )
And if you read closely , you will also understand that I have said I go along with treating this scenario as gospel in other forums and under other handles because Joe Sixpack is a simpleton and the only way to get thru to him is through constantly repeating a very simple message- one designed to disturb him. The other side – the entrenched fossil fuel and bau crowd- uses the same basic technique with the goal of keeping Joe ignorant and happy.
Forced climate change IS an issue as important as a hot major war- even more important. It is a well worn but nevertheless totally true cliche that in war the first casualty is the truth.
I have repeatedly said that I believe the SCIENCE ITSELF is sound. I am qualified to have an opinion first of all because back in the dark ages I took the basic physics and chemistry courses along with the guys majoring in these fields and second because I am well acquainted with the way science works.
Anybody who believes scientists of any sort are frauds out to live on grant money is woefully ill informed – ignorant, to put it bluntly. This does not mean however that you can work in the field and not go along with the consensus unless you are already tenured or otherwise insulated from political pressures . Nobody is going to hire you if you appear to be a nut case or a risk to their own career.
Now I may be wrong but I DON’T think so..
I still don’t see any evidence of climate scientists playing a political game.
When scientists were looking at health issues with tobacco, lead in gasoline, and asbestos, it took a long time between when they suggested these were problems until action was taken to deal with them. And in each case, affected industries fought the results.
I don’t believe the scientists were out to “get” the tobacco, gasoline, and asbestos industries. They were just saying that based on their findings, these were not safe products.
Now we have scientists saying they see indications of global warming, and this appears to be related to man-made sources of CO2, and if we don’t do something to curb the CO2, we are likely to face serious problems down the road.
And just as in the past, we have affected industries disputing the findings and/or the causes.
The guys who sat in a committee and picked the 8.5 watts per m2 as an answer they wanted to have, and allowed this to become the most quoted “business as usual” case, were into heavy duty politics, or they were kinda stupid. Take your pick.
The guys who sat in a committee and picked the 8.5 watts per m2 as an answer they wanted to have, and allowed this to become the most quoted “business as usual” case, were into heavy duty politics, or they were kinda stupid. Take your pick.
I still don’t see a connection. Using extreme climate scenarios is not the best way to force people into economic and lifestyle changes. There are far more immediate and compelling reasons to scare or force people into action. So if that is what they are trying to do, why this?
What political reason is there for using this climate scenario?
There we go around that theme again. The scenario is bullshit. Everybody who knows the score realizes it’s bullshit. And your only defense is ask what’s the purpose? Why don’t you go research what prompts people to lie, commit fraud, seek power using dishonest means?
Why don’t you go research what prompts people to lie, commit fraud, seek power using dishonest means?
I’m not that interested in the subject. What I have been saying is that I don’t believe the GW argument is a very strong reason for getting people to change behavior. And therefore, I also don’t believe it was cooked up to get people to change behavior.
I don’t see a reason for it to be treated any differently than any other scientific research, and I don’t usually investigate scientific discussions on a lot of topics.
There are a number of subjects which you are passionate about that are beyond my realm of interest. And all I have been pointing out to you is that you haven’t convinced me the GW data is an organized massive fraud.
Government funding provides the necessary money to expand the research attempting to prove the theory. Public education also paid for by government funding is used to make our kids believe in it. And we as parents then go around believing everything the news media prints and reports without questioning any of it! But who controls the news media? You guessed it, the liberal government as a babysitter base in our country. If you want people to believe in a something, anything, you pay off the news media, the educational system and scientists to pump out lies and misrepresentations over and over again so that within a couple of years, you create a new norm!
But who controls the news media? You guessed it, the liberal government as a babysitter base in our country.
But of course. The liberal government tells Fox News and Rupert Murdoch exactly what to say on TV and print in Murdoch’s papers.
People who believe the government controls the press are just too fucking dumb to pay attention to.
So you think whenever scientists find some industrial dangers, we should ignore them? You’re saying we can’t trust scientists because they receive government money?
You’re saying that scientists around the world have been bought off by US liberals?
Sorry, I’m not convinced.
My seven eleven twenty fifteen comment was intended to reply to Sunnv way up thread. I don’t know why it is so far down thread.
Sometimes I forget that we are not engaged in a face to face conversation and say things like the rcp8.5 is bullshit – which it is NOT , being an honest modeling tool but unrealistic. The USE being made of it is where the bullshit comes in. This would have been obvious in a face to face but not at all obvious in written communication.
Now as far as Boomer Two ‘s comment just below; it is not the scientist playing political games so much as everybody else.
The majority of scientists are merely keeping their mouths shut about the politics to the extent they can except for the ones who have put their careers on the line by forcibly advocating changing our ways. I salute that portion of them. Political advocacy is honorable so long as it is based on honorable motives. It is also NECESSARY for society to move ahead.
As has been said often , in war the first casualty is the truth- particularly if it is the nuanced truth. Just about any scientist concerned about environmental matters realizes that if he says anything in public that CAN BE twisted into anti environmental propaganda by the BAU establishment , it WILL be. So they sensibly do not say much if any thing at all in public about the RCP8.5 being based on unrealistic assumptions.
Re: China offshore graph
The article below describes how offshore production started to peak because there was an oil spill in Bohai Bay revealing faults through which oil seeped after pressurizing an oil field
10/6/2015
China’s offshore CNOOC started to peak in 2010
http://crudeoilpeak.info/chinas-offshore-cnooc-started-to-peak-in-2010
The graph in my article starts in 1997 because that is the year in which the first CNOOC annual report is available
back in
http://peakoilbarrel.com/the-eias-questionable-numbers/
there was a discussion of dust in the desert affecting solar.
I replied too late with this:
http://peakoilbarrel.com/the-eias-questionable-numbers/comment-page-1/#comment-525337
Anyway, just today an update on GlassPoint Solar
http://www.greentechmedia.com/articles/read/GlassPoint-is-Building-the-Worlds-Largest-Solar-Project-in-an-Omani-Oilfie
” Concentrated solar power is alive and well, but instead of producing electricity, it’s being used for the production of steam at gigawatt scale to raise heavy oil from depleted wells.
Petroleum Development Oman (PDO), the largest producer of oil and gas in Oman, and VC-funded GlassPoint just announced a $600 million deal for the largest solar plant on the planet. The 1,021-megawatt “Miraah” project is a turnkey system that will be owned and operated by PDO, generating 6,000 tons of steam per day to coax viscous oil from Oman’s Amal oil field.”
http://www.glasspoint.com
Their presentation on the challenges of deserts, lots of nice pictures, recommended to all:
http://www.glasspoint.com/download/6236/
More details on building their pilot plant in Oman:
http://www.glasspoint.com/download/3375/
They say that 14% of all natural gas used in California is for steam injection EOR.
http://www.glasspoint.com/markets/california/
20% of gas in Oman is used for EOR, and Kuwait has to import LNG for EOR !!!
For heavy oil, they say 18-35% of a produced barrel’s energy is required for thermal EOR.
Yikes, EROEI of 5:1 to 3:1.
If you check the glass point presentation you will see statistics for dust collection versus wind speed, and a map showing the “desert dust belt”. The Iberian peninsula is shown outside their desert dust belt boundary but we do get a very fine dust nearly all the time. To us it’s fairly easy to figure out by the amount of dust we sweep off our terrace. And as I mentioned, the local papers mention the dust problem is causing headaches in Murcia and Andalucia.
That Oman system works better because they invested in a greenhouse type protection and they don’t use photovoltaics. I suspect the better solution is to have water recycle, using the water off the solar power system gathered and reused to water nearby crops.
??? “If you check the glass point presentation you will see statistics for dust collection versus wind speed, …”
did you mean page 7 of http://www.glasspoint.com/download/6236/
“MENASOL-2015-Glasspoint.pdf”
That’s DNI (Direct Normal Insolation – light coming directly from the sun) Collected at given wind Speeds.
(although they goofed the label on that axis: units in Kwh/m^2/hr, but numbered in percent).
Shows when the sun is shining in Amal Oman, it is likely to be windy, 2/3 of daylight hours have wind greater than 14 mph (6 m/s).
So best to keep your solar collector high off the ground and easily cleanable.
Also need to either make it very strong so it can keep pointing to the sun, or put it inside a glass house for protection from the wind.
re: “reuse water for crops”
What’s wrong with reusing for the next washing?
Here? Why bother to filter water to take out solids if it can be used to water vegetables? Have you ever tried to run an industrial filter system taking out silt sized particles?
Folks, this is the kind of development problem my team used to love. Standard procedure almost always productive.
Define the payoff function to optimize
Crank out a lot of possible solutions-eyelids, flex covers, solar re-desalination, etc etc
Do a quick and dirty analysis of each
Rank all according to merit in sum
Take one or two of most promising
Make a good prototype
Ship it out to the howling desert and test the hell out of it
Report back, correct what can be
Repeat until done to satisfaction
Decide. go or no go, either is ok.
Next?
BTW. Wind you say? Didn’t I hear somewhere that wind can be used somehow?
“20% of gas in Oman is used for EOR, and Kuwait has to import LNG for EOR !!!
For heavy oil, they say 18-35% of a produced barrel’s energy is required for thermal EOR.
Yikes, EROEI of 5:1 to 3:1.”
— Isn’t this similar for Suncor and the Canadian Tar Sands? —
8-900,000 btu of gas/ barrel last time i worked it out. This is for one of the more efficient sagd facilities. So we are pushing 7-1 btu wise. Keep in mind too, that the steam plant runs cogens which produce all the electricity for the facility, camps etc. Supposedly we are set up to sell back to the grid, but I dont know if that is happening.
Dollar wise though, its less than 3 bucks of NG to produce a barrel of oil.
Funny when they talk about exporting LNG itmis touted as clean burning… but when used as oil sands fuel… but I do concede that the volumes of natural gas used for the oil sands overall is enormous.
The hedges staved off an acute shortage of cash for shale companies and helped keep lenders from cutting credit lines, many of which are up for renewal in October. With drillers burdened by interest payments on $235 billion of debt, $89 billion of it high-yield, a U.S. regulator has warned banks to beware of the“emerging risk” of lending to energy companies.
That’s a frown. Or not. You can define high yield any way you want to, one supposes.
Prevailing rates were higher 4 years ago when debt started accumulating. So HY debt’s rates today may be not a lot higher than non HY debt 4 yrs ago.
This guy’s quotes smell of agenda.
You can define high yield any way you want to, one supposes.
No you cannot. The term “high yield” simply means “Junk Bonds”.
Definition of Junk Bonds
A colloquial term for a high-yield or non-investment grade bond. Junk bonds are fixed-income instruments that carry a rating of ‘BB’ or lower by Standard & Poor’s, or ‘Ba’ or below by Moody’s. Junk bonds are so called because of their higher default risk in relation to investment-grade bonds.
This guy’s quotes smell of agenda.
What the hell does that mean? He is quoting facts. Do facts have an agenda? When I quote facts about oil production or barrels per day from North Dakota, do I have an agenda? Perhaps I do but that does not change the fact that I am simply quoting facts. Facts are facts, agenda or no agenda.
I don’t think you understand rates being higher 4 years ago.
The overall point being — 62%% of cumulative lending is investment grade? Sound right to you?
(FYI CLR’s interest expense/debt is 5%. The US prime rate is 3.25%)
I very well understand what high yield rates were 4 years ago. On July 8, 2011 they were 7.23%. On July 8, 2015 they were 6.8%.
BofA Merrill Lynch US High Yield Master II Effective Yield
You said: You can define high yield any way you want to, one supposes.
My point is that statement is just flat out wrong. High yield has a definite and precise definition. You are not free to define it any way you want to.
If 38% of shale industry bonds are high yield junk bonds, I would be very worried if I even held stock in one of those companies. Even if 68% of their bonds were investment grade the interest on their junk bonds would still be as high or higher then the interest on their other bonds. But the point is they are going in debt further every day, borrowing more money at every opportunity.
How in hell are they going to keep borrowing, keep paying those high junk bond rates, and lose money on every well they drill. To quote the article:
“a U.S. regulator has warned banks to beware of the“emerging risk” of lending to energy companies.”
I would say that if I were CEO of a bank I would damn well heed that warning. Now I ask you, what kind of an agenda would a journalist have to write such a warning? How about just wanting to write a few facts. Or my favorite agenda: To later be able to say “I told you so!”
I didn’t say high yield rates 4 yrs ago. I said rates.
Which have gone from about 3.25 to 2.4.
You can’t go off on a diatribe and analysis based on something I didn’t type
Now I’ll leave you to go find the 3.25 to 2.4. It will be educational for you.
High yield btw doesn’t have to apply to junk bonds. High yield subordinated convertible debentures are out there, too, and sometimes sought — though I have not heard of the shale guys floating that paper . . . yet. I can call one debenture high yield vs another and have the former be from a Moody’s investment grade rated company in general.
Copied and pasted from your original post:
You can define high yield any way you want to, one supposes.
I said: No you cannot! Then you stated:
This guy’s quotes smell of agenda.
Really now? It’s just a damn article. What possible agenda could the guy have? He just stated facts and you go off the fucking deep end. Well I don’t really give a shit. Your post made no sense whatsoever.
Watcher, the whole point of the article was that shale drillers have been keeping afloat because of they had their output hedged at a much higher price. Now those hedges are expiring. That was their safety net and now it is disappearing.
And… they have a mountain of debt, much of it high yield junk bond debt. Their safety net is disappearing and their junk bonds are coming due. They are in a world of shit.
Watcher, we have been discussing this very subject for months. Now we have an article that agrees with us, or most of us, on this subject. And you question it. Saying, in effect, that the quotes are bogus and that he has an agenda. Well fuck off. I agree with every word he wrote and don’t really give a shit what rates were 4 years ago. Okay?
Guys – Thanks for adding more entertainment value to this blog!
I think there have been several shale companies that have issued convertible debt. Whiting recently issued $1.25 billion of Senior Convertible Notes due in 2020.
US Shale Oil and Gas Industry is a Ponzi Scheme Facing Collapse …
Dan Dicker on Why Shale Oil Is a Ponzi Scheme – TheStreet
Interesting comment. It has merit:
“To big to fail shale companies (TBTFS) will be getting their bailout,soon..In the meantime,the more money they lose,the more secure their future is,because losing 100 billion dollars in Amerika today guarantees your future success,whereas losing only 100 thousand dollars,will only guarantee that you’re an idiot..”
Shale companies are not banks even if they were to get a bailout it doesn’t change the fact they can’t turn a profit with oil price where it is. More likely scenario is banks lending the money get bailout in some way shape or form. While shale companies are allowed to fail.
Are any of these shale companies really TBTF. Thought most of them were relatively small compared to major oil companies.
The mechanism for bailout won’t be the companies. It will be the paper behind them. That is what moves it outside politics and inside Fed uber authority. Saving the banking system would not require Congressional approval.
It really is surprising swaps are still allowed. Those would be the instrument of destruction.
That’s the amusing merit behind that guy’s comment. He understands the depths of absurdity in play now and how a smart businessman strives to have so much risk that the entire civilization is at risk, so that if he loses he gets backstopped. Those shale guys should be floating 100:1 leverage swaps.
The dumb businessman tries to limit his own losses. If he fails and the losses happen, he’ll go under and no outside agency will come help him.
Thing about swaps is how often are they allowed to payout. Take radio shack for instance. They stayed open for a couple of years until the swaps expired when they should of and would have closed down if not for the swaps.
Those that are underwriting all these swaps never allow them to be paid out. Whats crazy is they get sold to third parties. That never get to collect on them in the event of a default. But yet untold amounts of these things exist and are bought sold and traded everyday. Credit protection is big business.
Watcher – A swap is like exchanging dollars for euros. In the future, one person will be better off and one person will be worse off, depending upon what exchange rates do in the future after the exchange occurs. So, are you “surprised” that people in the world are still “allowed” to exchange currencies??
He is talking CDS. not currency swaps between countries.
Hi Watcher.
Ha ha. You make it sound like we have nothing to worry about because the banking system is controlled by the all powerful FED.
So, let me get this straight, the bad news is that the banking system is in danger, but the good news is that the FED will perpetually bail it out? If this were actually true, then the banking system is not in any real danger in the first place. And never could be. What the hell are you talking about?
I guess Dennis Meadows and the Limits to Growth team forgot to factor in the fact that the FED is all powerful. According to you, the FED has the ability to run the economy as a perpetual motion machine that no longer needs growth in energy supplies in order to function.
If the entire banking system were on the verge of collapse (it is, by the way), what purpose would it serve to have an indirect bailout of tight oil companies, by bailing out their junk bonds? It wouldn’t fix anything. It would, at best, just temporarily spread the risk. Very temporarily.
The tight oil companies would still be losing money every day. If they were bailed out, that would reduce their debt, but they would still be in a losing business. A bailout would maintain the oil supply, but that would mean that the oil price would be even less likely to ever rise in the future. How does that help anything? How soon before the next bailout? Reductio ad absurdum.
The FED can print money, but money is not equal to energy. The economy runs on the physics of energy, not money.
Your concept is just an elaborate form of collapse denial, Watcher. You have created an impossible economic perpetual motion mental model that can never fail. It is just silly. The bottom line is that the FED is just another bank. If the banking system is really in danger of failing (and, of course, it is), then it will fail.
I think Watcher knows the Fed will ultimately fail. But it will be awhile so until full faith in the dollar an the credibility of Fed itself is lost. It will be bailout city whenever anything threatens to bring down whats become a centrally planned economy and markets.
The economy runs on debt which is money. Energy doesn’t get produced, things don’t get bought and sold unless debt is issued in order to do it. Energy is what is used to gain capital in order to pay the debt back. In some cases you need perpetual use of energy in order to service debt as in government debt that principle balances are never paid upon.
Government debt don’t matter that much as they can print whatever is needed if there is not enough available energy to be used to produce enough tax money to service it. Private debts all require the use of energy to be serviced solely and fed can’t print money to buy all the private debt that exist.
Private debt is where collapse will begin due to lack of energy or fuel.
Current monetary system requires two things. One being an ever increasing amount of debt being issued. and Two an ever increasing amount of energy to be used in order to service the debt. Without both of these BAU gets discontinued.
Collapse might only seem sudden to those who are not paying attention. It’s already started but will be drawn out over a long period of time.
Hi SAWDUST.
Bailout city sounds about right. I guess I would just disagree about the notion that it will take a long time before the system starts collapsing. I think we are already in the early stages of collapse. That is why bailouts are becoming necessary and why they will also ultimately fail.
It is not necessary to lose full faith in the dollar and the credibility of the Fed itself for collapse to occur. All we need is a market crash and credit freeze. We got a preview in 2008.
The US stock market is not looking so good these days, the Chinese stock market is already crashing, and the Grexit situation could still unleash the dreaded credit default swap nightmare, etc., etc.
If the bailouts don’t work and the credit markets seize up for more than about three weeks or so, the entire economy will collapse.
There is really nothing that the Fed can do.
Greek and China situations have apparently been fixed or are at least under control now. Go look at USD/JPY an it will tell you all you need to know. It just printing a Bullish three inside an up reversal pattern. If SHTF was happening that pair would be headed south instead of making a bullish reversal pattern.
Highly bullish and highly reliable pattern. CB’s are still very much in control here. But that wont always be the case.
“Collapse might only seem sudden to those who are not paying attention. It’s already started but will be drawn out over a long period of time.”
Like I said, I agree collapse has already started. But what makes you think it will be drawn out over a long period of time? How long?
“Greek and China situations have apparently been fixed or are at least under control now.”
I seriously doubt that.
“Go look at USD/JPY an it will tell you all you need to know.”
Huh?
“Highly bullish and highly reliable pattern.”
Really? Do you have any other evidence?
“CB’s are still very much in control here.”
Central Banks are not in control of anything. This is not the new normal.
I don’t need any other evidence. Currency markets can tell you a lot about what’s really going on. Those in the know wouldn’t be buying USD/JPY right now if everything was going to hell. These markets are very controlled and the truth is there are a handful of people who benefit from a Chinese market meltdown or a Greece meltdown. These kind of things don’t just happen they are planned.
Might look like total chaos but it’s not. I’ve been trading professional for over 15 years.
These markets make turns right in the middle of what appears to be total chaos. Only way thats possible is there are a few that already know the outcome.
I’m not a conspiracy theorist either. I’ve watched markets day in an day out everyday for the last 15 years. I’ve seen it too many damn times.
Your going to get the collapse that you’ve been looking for. But it’s not really going to be apparent to everyone until we have actual fuel shortages and private debt implodes.
“Those in the know wouldn’t be buying USD/JPY right now if everything was going to hell.”
Those in the know? Who are those in the know? What do they know that regular folks don’t know? How do they know it? How do you happen to know any of this?
“These kind of things don’t just happen they are planned.”
So, the collapse of industrial civilization is being planned and managed by someone? That sounds impossible. How could anyone actually do that? Those “in the know” don’t know as much as you think they do.
“These markets make turns right in the middle of what appears to be total chaos. Only way thats possible is there are a few that already know the outcome.”
That sounds like a conspiracy theory.
“I’m not a conspiracy theorist either.”
You sure sound like one.
Do you have any specific examples of markets making “turns right in the middle of what appears to be total chaos”, in such a way that it could only be due to the fact that a chosen “few” had prior knowledge and/or control of the outcome?
Slow Down
Slow Down, take it easy! Oil prices slid after a Greek deal hope rally, only to be slowed by a report by the International Energy Agency (IEA). The report warned that demand for oil will slow in 2016 and Greece, China and the potential return of Iranian oil is not going to improve that outlook.
Yet, the IEA has been wrong underestimating demand before. They blamed their miss mainly on the weather and doubled down on their gloomy outlook by saying that global oil demand growth will slow next year to 1.2 million barrels a day — reaching 95.2 million a day — down from an expansion of 1.4 million a day this year, according to the report. They also are saying that U.S. production growth will slow to 300,000 barrels day next year, down from 900,000 a day in 2015.
The International Energy Agency said Friday global demand for oil would slow because of low prices and capital spending cutbacks. The IEA says that the bottom of the market may still be ahead because of return of Iranian oil and if Greece were to exit from the euro could put further pressure on oil price. They also said that if Iranian sanctions are lifted they could dump 40 million barrels of oil that is stored in tankers.
Continued – http://www.321energy.com/reports/flynn/current.html
The IEA seems to be emphasizing comments meant to talk down prices. I think this may be intended to put pressure on Russia and Iran. However, the key will be to see what happens to oil prices/demand/production over the next 12 months. I think this is too complex for anybody to figure out.
wait, what?
WASHINGTON — Shell’s drive to resume Arctic drilling this summer has hit another speed bump, with the discovery of a hole in the hull of an ice management vessel meant to safeguard the company’s operations in the Chukchi Sea.
The MSV Fennica was on its way from Dutch Harbor, Alaska to the Chukchi Sea on Friday when a ballast tank leak was discovered by crew members and a certified Alaska marine harbor pilot on board the vessel. It was traced back to a gash about 39 inches long and 2 inches wide.
The 22-year-old icebreaker has since returned to the port in Dutch Harbor and is being examined by marine experts, but it is uncertain how quickly the breach in its hull can be repaired and whether this will delay Shell’s hopes to begin drilling an oil well in the Chukchi Sea later this month.
The Fennica is just one of the 29 vessels in Shell’s Arctic fleet, which includes another icebreaker, the MSV Nordica, and at least two other anchor handlers tasked with helping to keep ice away from the company’s drilling site. But Shell’s contracted Fennica is unique in that it is carrying a critical piece of the company’s Arctic containment system: a capping stack designed to fit on top of a damaged well in case of a blowout or other emergency.
http://fuelfix.com/blog/2015/07/07/shells-arctic-icebreaker-damaged-in-alaska/#33766101=0
12 more well completions equated to 30K bpd? Seriously?
Over 100 more producing? The ones brought back have to be old and low flow and why bring them back at $52?
Hi. Just a few comments about the Bakken May data. Number of new wells put on production was 139 in May in all ND compared to 155 in April. I looked at the production the same month as production started and one month later and they are quite low in April and May. More like what they were before 2013. So the increase in total production does not seem to come from new wells. Confidential wells are not included though. What is higher though is total number of production days for all wells. So to me it looks like the increase in May is because they put wells temporarily shut in on production again. The oil price was higher in May than in April, so that could explain it.
So wait, are you saying a well can start producing in say, March, get shut in during March before March 31, and not report its output at end of March, but if it resumes in May, and is flowing last day of May, then its total output not yet reported gets put in May?
No that was not what I was saying. The total number of production days for all wells ever drilled was up quite a bit in May even though there were much fewer new wells put on production.
FreddyW. Thank you for the information you provide!
Are you able to provide the following ND Bakken data on a monthly basis?
Days of production per well. I assume that could then be multiplied by the number of wells producing in the ND Bakken PDF to get to total production days. The number I look at is bopd per well. However, the number of barrels divided by the total number of production days is probably a better metric.
Also, have you ever looked at Elm Coulee? It was the “original” unconventional Bakken field. If so, how does it correlate with ND Bakken? I think there are no rigs running now in Elm Coulee?
If you know, why is there no current activity in Elm Coulee?
shallow sand,
there is currently just one active rig in Montana, after several weeks of zero drilling activity
Oil production has actually increased in the past 3 years as a result of the development of Elm Coulee North East
Combined oil production at Elm Coulee and Elm Coulee North East fields (kb/d)
Monthly output has slightly declined in March and April
AlexS, thanks for the information!
Do you know how many active wells there are in each field?
Also, do you know if the wells in Elm Coulee NE were completed with more stages, etc?
It seems like I read the first wells drilled by Continental in Elm Coulee in 2003 cost a total of $2-2.5 million.
I, like others here, wonder if the it would have been more economical to complete the ND Bakken wells with less stages. Surely the experts doing it know better than an observer like me.
In any event, it looks like these guys are going to insure low oil and natural gas prices for as long as they possibly can.
As of April, there were 910 active wells in Elm Coulee and
273 wells in Elm Coulee North East
Number of active wells
Thanks again!!
Growth in the number of active wells was much slower in Montana’s portion of the Bakken
Production per well (b/d)
Shallow sand. You are welcome. I follow the Bakken and peak oil because of personal interest. Then why not share my findings :).
Elm Coulee is in Montana right? I only created a program to parse and process the ND reports. So the Bakken ND is the only data I follow in detail (for now at least).
Maybe I can put together something with “the number of barrels divided by the total number of production days”.
Thanks!
It appears to me that Elm Coulee (not the NE part) has hit the point where decline is well under 10% annually. I am wondering if the ND Bakken will show the same long term production profile.
The Elm Coulee wells produce very low volumes of water 5+ years after completion. Assuming the North Dakota wells are similar, given the vast area involved, there could be a fairly large, long term stable supply of oil coming from that region.
I have read there could be 30-60 total ND Bakken production wells drilled. That could be a long term, low decline supply of around 1 million bopd.
Here is the graph. Monthly production / days was about the same as April, but number of days increased.
Regarding Elm Coulee. It´s interesting that the decline rates there are well under 10% after 5 years. In Bakken they are a bit above 10% after around 5 years. But what is the well density in Elm Coulee compared to Bakken? Higher decline rates should be expected if there is well interference.
Elm Coulee field contains 231,907 acres per a paper written by Richard Findlay, who is credited with discovering the field.
AlexS above stated there are presently 910 active wells, so it looks like about one well every 254 acres. I think laterals are one mile, so it looks like either 2 or 3 wells per 640 acre tract. Again, I have no personal knowledge.
Given the US will place great reliance on these fields over a considerable time, it will be interesting to see whether they are being developed in the manner that will recover the most over the long term.
Just about everything I have read focuses on IP and first 30, 90 and one year production. Not many stories about older wells, I guess that is pretty boring stuff.
I did read that fractures in the Bakken can reach out over 1,500 feet. If that is the case, why is there a push this early to drill on 660′ spacing or less?
Ok quite many wells then. But it´s a bit hard to say that the decline rate is less than 10% only based on AlexS graphs. There has been drilling until recently. It would have been interesting to follow the production curve for wells drilled in 2005 or 2006.
I have looked at 2004-2007 wells and it seems to me the majority are producing about 20 bopd with low decline and produced water in the 30-100 barrels per month range.
The Bakken wells will probably produce more than that at that time. A bit more than 50 bopd for wells drilled in 2008 after 6 years, but the water production is much higher as you probably know. For 2008 the water cut is 26% and increasing slowly after 6 years. For newer wells its more than 40% already the first year. What the production will be for new wells after 6 years we can only guess.
Shallow,
In regard to the wells completed in 2004 to 2007, presumably a lot of wells completed in this time period have already been plugged and abandoned.
No. For a variety of reasons, a well could be shut down for a whole month, and produce 0 barrels for the month. Or, a well could be shut down for 15 days in the month and only produce half of what it otherwise would have for that month.
There could be a lag time you describe regarding sales figures. For example, we have one well leases that produce every day of the year, but it may take 2-4 months to fill a tank and sell oil.
ND reports both production and sales, so I do not think what you describe is the issue.
It is possible some wells were shut down due to low prices. For example, this winter we had a few wells go off with down hole failures, and we did not get in a hurry to repair those, because at $40 oil in the field, we could not even break even on those wells anyway. When prices in the field topped $50, we repaired the ones we thought made sense to place back into production.
The ND increase surprised me too. So does the fact that rig count has increased the last two weeks.
I do know the second quarter will be better than the first for US shale. However, the first quarter was very bad. The third quarter is starting out worse than the second with the roughly $8-10 per barrel oil price drop.
I really can’t figure out the company strategy of drilling wells in the core. Unless to hold lease acreage, why drill your best wells and sell that oil for low prices? We have went over many reasons, and I guess I understand them, sort of.
This looks like it will be a long, tough slog with low oil prices.
I have heard rumors of smaller companies continuing to drill and pay for that work, but falling in arrears on bills to service companies on repairs and supplies, etc on older wells. That makes absolutely no sense to me.
One company has private equity financing. The PE firm is advancing money to drill more wells, but will not advance money on the older wells, some of which have now been liened by the service companies. That is all word of mouth, but if true, is the bizzaro world. I cannot understand why any operator would keep drilling with borrowed money when they cannot pay OPEX on existing company wells. However, I have seen in the past one company who let interests be sold at tax sale, even though the wells should have been profitable, and yes, the company was drilling wells in nearby counties. Sometimes things just do not make sense.
I do agree with Watcher to an extent. It seems that trying to be prudent financially has been thrown out the window. If companies burned a lot more cash again in the second quarter, that will further confirm this view.
Heck, US may hit 10 million bopd. It makes no sense to me, but much of this shale stuff never has.
I have something interesting to show you. The production profiles, now in a readable png format :). You can see that the first 3 month of 2014 continue to drop faster than earlier years. It´s now noticeably bellow the other curves. 2013 also continue to drop faster than earlier years although not as fast as 2014. It´s now bellow 2008-2009 and getting closer to 2010-2012. The data is complete for all curves. So they will not change as more data comes in.
It’s a little bit mind boggling, and I don’t mean Greece’s surrender 4 days after winning the vote.
I mean 30 stages vs fewer in 2009, and look at the curve. All it bought was a short term 100 bpd. And that is gone by month 8 or 9? I make that 8 X 30 X 100 bpd X $100/barrel and it was getting an extra $2.4 million to frack 30 stages instead of whatever fewer? At $40 it’s $960K for those extra stages.
Hard to see the windfall there. The extra proppant and water etc.
But who cares. “We could be losing our money instead of yours.”
Yes, Watcher, I wonder how many US shale company executives have taken a pay cut in the last 6 months or so. LOL.
The number of frac stages over increased lateral length has not proven to be economical and only the shale industry said it would. When are people going to quit believing everything they read on the internet?
Imagine running down a flat highway for a mile and half. Along the way, if you were paying attention, you would notice that the highway is not homogenous; it has cracks in it, it is broken, its slicked off like glass, its porous and rough. So is shale. Cramming more sand in the stuff will sometime equate to higher IP’s, and sexy quarterly operational reports, but steeper declines and seldom, if ever, higher URR. It does, as Watcher suggests, equate to more proppant, more water, more steel and more money to borrow.
What folks are starting to notice with the data is the effects of poor reservoir management, ie., drainage (well interference), gutting wells during and subsequent to flowback, pressure depletion, increasing GOR and higher water saturations. All this is to be expected as the Red Queen exercises her evil ways on production that declines at the rate of 40% per annum.
Absolutely none of this is surprising to me, nor should it be to anyone else.
Mike
Ya to all of that, but come on. The graph is almost not possible.
We are talking about 30 stages recently, call it the past 2 yrs. It was less before.
Freddy is saying that extra length, extra volume, at 12 months, doesn’t flow any more than the shorter length and lesser volume of a sub 30 stage frack.
This would seem almost physically impossible, but there it is.
It’s what, another half mile of fracked length that is supposed to be gathering oil from an increased volume of rock along that extra length, and these graphs say come 12 months . . . it’s not happening. You get the same bpd as the shorter length wells.
How?
Yes it´s a bit puzzling how little effect more frac stages and proppant have on EUR. It could be that it´s a downpacing effect. So if they would not have used the extra frac stages and proppant, then the higher decline rates would still have been there and EUR would have been lower. I suspect that the main reason for the companies has been to show progress to shareholders and hide the fact that well productivity is declining.
The quality of the rock (shale) is not entirely homogenous; increasing lateral length does not automatically add X more acre feet of shale to drain. Fac’ing stages in the toe of a longer lateral is more difficult and requires more horsepower, better carrying fluids to keep the sand in suspension, etc. Often those stages are not stimulated as effectively as intervals closer to the heel, or in better rock, and there are problems with pressure differential between different stages (for instance some stages won’t even contribute as they are being overcome by other stages).
Longer laterals and increased frac staging was (is) part of the learning curve for development of this resource play. There is an “optimal” lateral length/stage number for wells in a sweet spot that is based on well performance, and, as Freddy suggests, economics.
If there is a slight increase in Bakken well performance over the past two years, one the reasons may be greater frac efficiency thru better sand placement (more of it!) in fewer stages and thru another shaleism called “zipper” fac’ing where parallel laterals are frac’ed at the same time. On multiple well, single pad schemes zipper frac’ing actually implies well interference, but that’s a debate for another day.
I personally have not observed, nor does my research (DI) suggest that an improvement in initial well performance, even over a 2 year period, will increase UR in that well nor result in better economics and better IRR.
Mike
Hi Mike,
Would it be possible for you to share DI data for TX. I have read that there is a “pending” file with data waiting for reports to be finalized that is reported to DI but not available on the “free” PDQ at the RRC so the DI data would be much better. Most of us don’t have access to DI.
It would be interesting to see what DI reports for total TX C+C fro Sept 2014 to April 2015.
My address is my first initial and last name followed by 78(no spaces all lowercase) at gee male dot com. (trying to avoid email bots), if you want to contact me or you could just post the data here, I think it would be closer to complete data.
And here is the one month after first production graph. There is no sign of “completions focus more and more on the best portion of the core Bakken and Threeforks area”. The trend is declining initial production, not increasing initial production. However confidential wells are not included. So we don´t have the whole picture.
Pretty hard to make sense of that. We do know stage count was much lower several years ago. It’s just not visible. My eyeball sees some gas ramp, but that’s probably improved takeaway.
Here is a similar graph including both horizontal and vertical wells and also confidential wells. The percentage of horizontal wells have increased over time I think, which could explain why its leaning at bit more upwards than above graph up untill end of 2014. In 2015 it´s dropping in this graph too though. One explanation could be that they use less frac stages and proppant to save money.
Hint: You can right-click on a graph and select open in a new window or tab to see a larger picture.
Gives rise to another point.
What was it, 12 more wells completed? The typical well will be 450 bpd over the month. This is 5400 bpd added from new wells.
Still gotta find 30K+ bpd for last month from shut in wells now turned on.
Hi FreddyW,
If we assume all confidential wells were in the Bakken/Three Forks, I get 136 new wells in May for the Bakken/Three Forks
Before I forget, I think I tracked down the source for the IPCC line about xx% of fossil fuels can’t be burned:
https://iris.ucl.ac.uk/iris/browse/profile?upi=CMCGL94
There’s a series of papers coming out of this shop, some published in very high profile publications, and passing peer review. Here’s an example I dug up
http://www.bio.utexas.edu/courses/THOC/UnburnableOil.pdf
Enjoy.
Texas Oil Production Increases 16%
Well, not really. They are talking about production increase from May 2014 to May 2015. And in view of the shale boom, that is simply what would be expected. But what we would really like to know is how did May’s production compare to April’s production? They say:
In Texas, however, crude oil production increased 16 percent in May to 107 million barrels (3.6 million bpd) from 92 million barrels (3.1 million bpd) in May 2014, according the Texas Petro Index.
Okay, 92 million barrels in May 2014 comes to 2.97 million barrels per day. Simple math, just divide 92 by 31. And 107 million barrels in May 2015 equals 3.451 million barrels per day. Not bad until we realize that the EIA says that Texas produced 3.775 million barrels per day in March and 3.711 million barrels per day in April. So 3.451 mbd in May represents a 259,387 barrels per day decline from April production and a 323,387 barrels per day decline from Texas March production.
So if the Texas Petro Index is correct then Texas is experiencing a steep decline in crude oil production. However it is far more likely that the EIA’s March and April numbers are way too high and there is a decline in May, but not nearly as great as these numbers indicate.
“The EIA expects prices to stay low through 2016. In the fourth quarter of 2016 they have production increasing but prices falling. There seems to be a contradiction there somewhere.”
Ron, maybe production increasing because of rising prices in the second and third quarter. Although prices between $60 and $65 are still too low according to most experts.
The EIA prediction is rather unlikely to come out, if the safety net for shale drillers will disappear.
Your Permaea Manifesto is up (minus the pics, temporarily).
I decided to post it on my own Permaculture Global page before it gets published elsewhere and given that The Permaculture Research Institute of Australia’s site seems to be suffering from loss of some funding and/or an editor.
Critiques, suggestions and recommendations, such as for edits (grammar, links, additions or subtractions, etc.) welcomed, since it is yours too, if you subscribe to a permaculture ethic or better.
Pics are up.
For those following the Antarctic:
The European Space Agency reported gravitational anomalies in Antarctica caused by accelerating ice loss
GOCE reveals gravity dip from ice loss
http://www.esa.int/Our_Activities/Observing_the_Earth/GOCE/GOCE_reveals_gravity_dip_from_ice_loss
Maybe they’ll be drilling for oil there before long.
Yes, failure is a good thing. It teaches.
For all
Some of my observations from the May 15 data from NDIC for Bakken/Three Forks developments.
For the period Jan – May 15 an average of about 155 new wells (take or give a few depending on what data are applied) were started monthly.
The model still suggests it requires about 140 wells/month (based upon the average of 2014 wells) to sustain extraction levels at about 1.15 Mb/d.
The model estimates that with the higher number of wells added monthly LTO extraction should as of May 15 have been around 1.19Mb/d.
It was 1.14 Mb/d.
Digging deeper into the data it has been found that a few companies likely have curtailed LTO extraction as a response to the oil price collapse. This may have been done in a bet on higher future oil prices.
To understand the future developments for Bakken it is imperative to look at the 20 or so biggest companies and their financial capabilities.
FINANCIALS
For the period Jan-May 15 it was estimated that total CAPEX for well manufacturing totaled $6.5 – $7.0 B. Around $3.5 B was estimated to have come from operations (inclusive hedges).
This suggests that about $1 for every $2 used for well manufacturing (CAPEX) was from some external funding sources, like assets/equity sales and/or credit.
If the oil price remains at present levels and as hedges expires it should be expected that CAPEX will come down significantly, and some highly leveraged companies will start deleveraging (chances are that leverage is headed higher with the recent drop in the oil price).
This puts up some hard to negotiate financial dynamics, the Bakken developments has been driven by financial leverage/dynamics. This works fine as long as there is growth in financial income (controlling leverage), but sets up a vicious dynamic if this growth fails (significantly increasing leverage) driving companies on a path towards deleveraging.
As described above the companies in Bakken had a total average CAPEX of about $1.3 – 1.4 B/month for well manufacturing so far in 2015.
As deleveraging commences the CAPEX may drop to $0.4 – 0.5 B/month which substantially reduces the well manufacturing capacities. This is the financial version of the Red Queen, which is far more unforgiveable than the physical version as finance is virtual.
$0.4 – 0.5 B/month would finance anywhere of 50 – 70 wells/month, which will not be sufficient to sustain present extraction levels which subsequently declines.
A good indicator of the workings of the financial Red Queen is to monitor the developments in the rig count. At present prices the smallest companies will find it hard to finance manufacturing of more wells, and looking at the bigger companies there is a mitchmatch between how many rigs operational income theoretically allows to operate versus actual operating.
Several of the bigger companies has (as of writing) no rigs in operation and has not added producing wells since February/March. They may have wells in the fracklog awaiting higher oil prices.
Mr. Likvern, I wish to compliment you again. It is strikingly clear to me after reading all of your posts that the future of LTO production is severely constrained by debt, profitability, and financing. I agree with you 110%, sir. Thank you.
Mike
Mike, do you have an opinion on the article I posted?
Shale drillers’ safety net is vanishing
Since we have been discussing this subject for months, I was quite shocked that only watcher saw fit to comment on the article. And he thought the numbers quoted by the author was suspect and that he had an agenda.
I was hoping to get a few more opinions on the article.
Ron, I had read that article before you posted it and read it again here. I think it is a good article.
I will be very interested to see the second quarter 10Q, which will be released next month. Some of the companies have stated goals to become cash flow neutral, and it will be interesting to see the progress they make, if any.
Take Whiting Petroleum, for example. They were cash flow negative over $800 million in Q1. I estimate the PV10 all categories for Whiting to be in the 6 billion dollar range. I don’t see how that can go on forever. They are still very actively drilling, however.
I thought the goal of an investment was to generate positive cash flow. I realize that there are times were cash flow will necessarily be negative. When we buy a lease, we are very cash flow negative for the month of purchase. However, we intend on being cash flow positive thereafter and that the cash flows over the life of the lease will far exceed the purchase price plus interest. This is why I think long term debt to PV10 ratio is very relevant. No value is being created if the present value of future cash flows is less than the amount of CAPEX plus interest. We can quibble about the discount rate, but the long term debt is generally at 5% or more interest. Oil and gas is still a risky, cyclical business, last time I checked. Persistently low oil and gas prices will do many of these companies in IMO.
That does not seem to be the goal of the shale industry.
Ron, I missed the conversation. I think this is a well written, balanced article on yet another serious issue facing the LTO industry. I tried to go back and find the conversation to understand why this article would be suspect, but alas, I don’t understand too much of what Watcher say’s anyway.
An insurance company will pay out billions of dollars of flood damage only so many times before ensuing premiums skyrocket. Another flood along the same river and that’s the end of flood insurance, at any cost. Over the coming 18 months I think it is equally probable that oil prices will go down, as they might go back up. This price volatility will make hedging premiums more expensive, and perhaps ultimately not obtainable at all. Without a price floor propping the shale industry up I think we might find already very nervous “lending support” running for the hills. Besides, how is a 65 dollar floor going to get the shale oil industry out of trouble anyway? A 25% reduction in costs is going to help them only so long as they can keep drilling their A+ locations in the sweetest of sweet spots; how much longer can that go on?
I am reminded of the analogy the shale industry was using as late as 2013 about it being only in the 2nd inning of growth potential. I got up to go get a hotdog and a cold beer and came back to sit down and all of a sudden the shale industry is batting in the bottom of the 9th with two outs, down 4 runs.
I missed the 7th inning stretch!
Mike
From the Director’s Cut: Today’s Sweet Crude Price1 = $40.75/barrel
It just don’t make much sense to hedge below $40 a barrel. So they are just going to have to go with the price they can get. So when the current hedges expire they will just be left with what they can get. Ant it is unlikely they can get what it is costing them. This just cannot go on much longer.
To add insult to the Oil pricing. US gasoline sales look pretty poor for 2015:
https://ycharts.com/indicators/us_gasoline_station_sales
its recovered from Q1, but still considerable low over the past 5 years.
US Retail sales decline after a pick up in May:
https://www.marketnews.com/content/us-retail-same-store-sales-01june-vs-06-may-text
The US economy is either in a recession or stagnation (as there is no economcy growth). The only growth news is in Auto sales, but its attributed to sub-prime auto loans and extending auto loans to 7 years and the amount financed has also increased substantially. The growth in Auto sales (or should I say “auto loans”) isn’t going to last. Its likely subprime loans will be shutdown again as loan delinquencies and defaults rise again, probably during the fall.
http://www.autoblog.com/2015/06/09/car-loans-longer-than-ever/
“To add insult to the Oil pricing. US gasoline sales look pretty poor for 2015”.
TechGuy, The EIA has a different opinion:
“The EIA also raised its forecasts for US oil consumption. “US gasoline demand will likely top 9 million bpd this year for the first time since 2007, which reflects record highway travel,” Sieminski said.”
Based on the May data from NDIC, the following graph shows the contribution from wells starting in different years, in the whole of ND.
After removing service wells, and wells that were only partially reported (before they were grouped together with other wells, and reported as a group), we can see that actually the average well performance has just slightly improved in the last couple of years in ND.
In the public data, there is no information about the status during the drilling stage. However, we can monitor the number of oil wells spudded in a month, and the ones starting first flow. I excluded dry/service wells, and wells reported in a well group (together <10%). This gives in my mind a quite reliable way to estimate the "spudded but uncompleted well inventory", as I can't accurately match the completion/uncompleted numbers as reported in the Directors' cut with the data.
The graph below shows that since November this uncompleted well inventory has been dropping steadily, as more wells started to flow than were spudded. This explains why production in ND has been steady, and could still be steady for several more months, in the face of the rig count drop. This inventory will never be close to 0, as on average there are 3-5 months between spudding and first flow. This has several causes, one of them being that some wells are first spudded by a smaller rig, before being finished by a more powerful rig (thanks go to Coffeeguy for this information). The uncompleted well inventory is now on the same level as early 2014. I estimate that with the current low rig count this inventory could drop to normal working level of around 400-500 or so, once companies like EOG start to complete wells again.
On another note, I saw that the number of wells temporarily shut in was reduced in May, probably due to the higher oil price in that month.
Your monthly chart of value, Enno.
And as of May it says about 55% of production is coming from wells < 17 months old. Might be a small downtick.
Article from Reuters:
North Dakota oil output jumps in May despite low prices
Jul 10, 2015
http://www.reuters.com/article/2015/07/11/us-north-dakota-oil-production-idUSKCN0PL01C20150711
North Dakota’s daily oil production rose 3 percent in May, state regulators said on Friday, hinting that the state’s Bakken shale formation may be more resilient to sliding crude prices than expected.
The state’s well count hit a record high in the month with producers deciding to hydraulically fracture more freshly drilled wells, bucking a trend to mothball them. Drilling permit applications also spiked.
“I was surprised by the increase in output for May,” said Lynn Helms, head of the state’s Department of Mineral Resources (DMR). “It’s pretty astounding at how good (oil producers) have gotten at what they do.”
The data signaled that Whiting Petroleum Corp, Continental Resources Inc and other producers in the state have been able to weather a more than 50 percent drop in U.S. crude prices since last summer.
North Dakota, the No. 2 U.S. crude producer, had output of 1,201,159 barrels of oil per day (bpd) in May, up from 1,169,045 bpd in April, according to the DMR, which reports on a two-month lag.
Output had dropped in April.
The number of drilling rigs has plunged in the past year, to 73 from 189, and the state’s rig count has not been this low since 2009. Each rig, however, now pumps more than twice as many barrels as rigs did six years ago.
Initial production rates – measuring a well’s ability to produce as soon as it starts pumping – jumped as much as 20 percent in May from April levels, showing that oil producers’ focus on technology over rig count is paying off.
Drilling permit applications rose 28 percent from May to June, hinting that producers believe they’ll soon have to drill more wells to maintain long-term output targets.
Helms said June data could show an increase in production as well, although Francisco Blanch, an analyst at Bank of America Merrill Lynch, said the outlook remains for output to fall off after June,
“I would expect the data, on a forward basis, to start looking weaker from a production standpoint,” he said. “It won’t be a huge drop, it may not matter a lot to the market.”
Natural gas output for May rose 6 percent, and the number of producing wells in the state hit a record high of 12,659.
Was there really an increase in IP rates of 20% in May compared with April?
How it can be explained?
Looking at the monthly production for wells starting production in May (0 months after first production) I see a 15% increase in production compared to April. However production in April was relatively low. May is about the same as January. The data is quite noisy, so comparing month by month doesn´t say much.
Thanks
See below a graph where the output is shown for wells flowing for the first time. We don’t have accurate information regarding producing days, therefore I divided the output by the total number of days in the month. Numbers are shown for the 1st month of flow, and for the cumulative output for the 2nd and 3rd month as well. All individually reported oil wells in ND are included.
So to answer your question : yes, initial production in May seems to be about 20% higher than in April, but April seems to have been a particularly bad month for first flow. 2015 Wells so far are not showing markedly better performance than 2014 wells.
Thanks Enno.
“The number of drilling rigs has plunged in the past year, to 73 from 189, and the state’s rig count has not been this low since 2009. Each rig, however, now pumps more than twice as many barrels as rigs did six years ago.”
Jeeze,,, Reuters reporters really think Drill rigs pump “oil” ??
Will someone please fire these dudes. They can get a job in the Patch. Oh wait..
Maybe it’s a tax issue. Didn’t the state cut taxes? Or did they miss the window?
Fernando,
If you’re referring to the tax break that would kick in in June if oil prices stayed below a certain level for a certain number of months: North Dakota did away with that in April. The oil extraction tax rate was lowered by 1.5%.
Re: Elm Coulee field
The EIA estimates the field’s technically recoverable reserves at 261 million barrels.
Total number of potential wells is 1771, average EUR – 147 thousand barrels.
Accumulated production between January 2000 and April 2015 is 154 million barrels, or 59% of estimated TRR.
The number of active wells in Elm Coulee and Elm Coulee Northeast is now 1183, and there were obviously many wells that were shut-in. So, by any measure, the field should be in a declining phase. Yet, production volumes have been increasing in 2012-14 and remain roughly flat in the past few months, despite almost no drilling activity.
Interestingly, the EIA estimates Bakken reserves in other parts of Montana at 580 million barrels, however average EURs are quite low.
The table below was prepared using data from the EIA Assumptions to the Annual Energy Outlook 2014
Note that all numbers are for Bakken only and exclude Three Forks (there are only few Three Forks wells in Montana)
FWIIW
From IEA’s Oil Market Report (July 2015)
”Oil prices tumbled again in the last month, with front-month WTI futures down about 14% and Brent roughly 10% lower at the time of writing. That is a testament to the continued headwinds facing the oil industry, a recurrent theme of this Report. The rebalancing that began when oil markets set off on an initial 60% price drop a year ago has yet to run its course. Recent developments suggest that the process will extend well into 2016, as shown in our quarterly supply/demand balances for that year, unveiled here for the first time.”
https://www.iea.org/oilmarketreport/omrpublic/
Ouch.
does anyone understand the CA retail gasoline system?
???
Gasoline prices could reach an average of $4 a gallon in the Southland as early as this weekend because of a shortage in oil and other components used in refining California’s blend of gas, according to the Automobile Club of Southern California.
http://www.latimes.com/business/la-fi-gas-price-spikes-20150711-story.html
Low inventory across the West Coast, a lack of imported gas for California and rising wholesale prices all have contributed to sporadic price hikes around the county.
http://www.ocregister.com/articles/prices-671107-gas-gallon.html
Around 2017, we will have electric cars with 200 mile range at an affordable price. Peak oil is real, but irrelevant.
http://www.franchiseherald.com/articles/31582/20150709/nissan-leaf-range.htm
Where will we all be going with our electric cars, and when ‘the next stairstep down the long emergency’ hits?
I think it would make more sense to save our money, invest in and focus more on things long-term and resilient, and keep the old car.
Electric cars seem like the cart before the horse when it comes to priorities in an era of uncertainty.
Famous last words (…in a system that practically insists on driving the cart before the horse.)
There are no stair steps down, everything will be smoothly transistioned and no one will even feel the least discomfort. It’s all going to be fantastic and amazing.
I will take my latest girlfriend on a ride to Paradise.
Here is the music that will be playing in my electric car.
https://www.youtube.com/watch?v=m8yC_nCsx7c
I will be howling at the moon and they will hear me cause the EV is so quiet.
Here is what I used to do for fun.
https://www.youtube.com/watch?v=4j6Y2mb90YY
and this
https://www.youtube.com/watch?v=0KS3yIHZ9tc
So all those EV’s, solar panels, and wind turbines are going to save so much fossil fuel that there will be plenty of materials to make more sailplanes and more kayaks.
We will all be riding to Paradise on a wave of new technology that will solve all of the problems and let us get back to just having fun.
The researchers are now working on ways to double or triple the healthy lifespan. Just think how much more we can romp all over the planet. What a blast is will be.
Hey good choice! I would love to do those two things, and ages ago, started to take my private pilot’s license, but like a lot of things, time, affordability and/or opportunity got in the way… But we’re sure the researchers and the good folks like the politicians all have our best interests in mind and are working on stuff like those right this very minute!
And food never tastes better than after hours of fighting and playing in whitewater. But having to land again after soaring up to 7000 feet and following a cloud street for miles is a real let down.
Amidst all these problems and chaos, finding a little paradise is very important for the psyche and the spirit.
“I think it would make more sense to save our money, invest in and focus more on things long-term and resilient, and keep the old car.”
+1 🙂 yes, Investing in other things make much more sense. Rail would help as well as improving critical systems (food, energy, water, etc) to be better suited for a long term economic crisis. The US also need remove dependence on Asia Manufacturing so that it source durable goods and replacement parts. Doing these things would also help support US jobs.
That said, I think its too late to to even begin a crash program. The World is now very close to a major economic crisis again. It going to be much harder to prevent a severe long term crisis this time. I think that the US will face riots like in the EU when the next crisis unfolds. The US will probably lose another 10 to 20 million jobs when the next crisis unfolds.
The best advice I have is to distance yourself from population centers and avoid being mono-skilled and specialized. Those that can perform multiple skills will less likely to become long term unemployed or severely under-employed. Those that are the most specialized are likely to become the first on the unemployment line (generally specialist have higher salaries and are limited to the tasks they can perform). Companies will be forced to downsize and will leverage digital systems to replace workers and also shift tasks to workers that cope with multiple job functions.
I have been reading theoildrum.com since around 2003 or 2004. I am very familiar with all the “collapse” predictions and scenarios (olduvai gorge, permanent blackouts, etc. etc.). By now BAU was supposed to be dead and Saudi Arabia was supposed to be in terminal decline (remember Stuart Staniford’s “Nosedive in the desert”?). The fact remains that no one on theoildrum.com predicted the shale NG and shale oil revolutions that delayed peak oil and gave us an additional decade to prepare. Saudi Arabia is still producing around 10 mbpd. No one predicted how rapidly the battery technology would evolve and give us practical electric cars. In a couple of years you will be able to buy electric cars for the same price as gasoline cars with a range of around 200 miles. Electric cars have a low total cost of ownership and are a superior technology to IC engines. Who is afraid of peak oil? I am not.
By 2018 we will have figured out how to overcome the gravity thing and we will no longer need roads, airports, electricity grids, or rockets. Energy will be cheap almost free again.
There is that pesky net export thing. As I have frequently pointed out, as the Six Country Case History* production increased by 2% from 1995 to 1999, they had already shipped 54% of their post-1995 Cumulative Net Exports (CNE).
I estimate that Saudi Arabia has already shipped close to half of post-2005 CNE, as Saudi net exports declined from 9.5 MMBPD in 2005 to 8.4 MMBPD in 2014 (EIA + BP data, total petroleum liquids + other liquids). In any case, it’s not whether, but to what degree, that Saudi Arabia has shown an accelerating rate of depletion in their remaining supply of post-2005 CNE.
Globally, I estimate that the (2005) top 33 net exporters have already shipped about 30% of their post-2005 CNE, with a similar accelerating rate of depletion in their remaining post-2005 CNE.
And from 2005 to 2013, the volume of Global Net Exports of oil available to importers other than China & India fell from 41 MMBPD to 34 MMBPD.
Meanwhile, global vehicle sales were projected to hit an all time record high in 2015 (which may or may not happen, depending on what happens in second half of the year), but in any case, reportedly EV and plug-in hybrids were estimated to account for one half of one percent of global vehicle sales in 2015.
*Major net exporters, excluding China, that hit or approached zero net exports from 1980 to 2010
Mr. Brown, if you have not seen this article regarding pesky net exports, and the work you have done for years previous, please…
http://www.brookings.edu/blogs/markaz/posts/2015/07/02-saudi-energy-subsidies-hino
Respectfully,
Mike
Thanks for the link.
I think that the two most misunderstood and under-appreciated aspects of “Net Export Math” are: (1) The assumption that only rising domestic consumption in net oil exporting countries causes problems for net exporters and (2) A lack of understanding of depletion.
Given an ongoing decline in oil production in a net oil exporting country, unless they cut their domestic oil consumption at the same rate as the rate of decline in production, or at a faster rate, it’s a mathematical certainty that the resulting rate of decline in net exports will exceed the rate of decline in production and that the rate of decline in net exports will accelerate with time.
And given an accelerating rate of decline in net exports, net export declines are front-end loaded, i.e., the bulk of post-net export peak CNE (Cumulative Net Exports) are shipped early in the decline phase. In other words, in my opinion globally we will have consumed a larger volume of Global Net Exports of oil (GNE) in the 10 year period from 2006 to 2015 inclusive than we will consume in any subsequent 10 year period.
In regard to the Six Country Case History*, they hit zero net exports 12 years after their net exports peaked, in 1995. They shipped 54% of post-1995 CNE in the first four years, 38% of post-1995 CNE in the subsequent four years, with 8% being shipped in the final four years.
*Major net oil exporters, excluding China, that hit or approached zero net exports from 1980 to 2010
I just saw a report about Saudi Arabia borrowing money to close the income gap caused by low oil prices:
https://twitter.com/fernandoleanme/status/620540915837456384
The fact remains that no one on theoildrum.com predicted the shale NG and shale oil revolutions…
No one in the world predicted the shale revolution. Do you actually believe that people on the Oil Drum should have been better prognosticators than anyone else in the world?
People every day, in every profession or trade, make predictions that are incorrect or premature. So what does that prove? When people make a prediction about something that is inevitable, like peak oil, and that prediction is premature, then it becomes even more likely that the next prediction will be true, not less likely. If if must happen then every day brings that point one day closer.
As for battery technology, it just hasn’t happened yet. There are about 260 million motor vehicles in the US. About 1 million of them are electric. All of them are passenger cars, none of them are large trucks. Battery technology still has a long, long way to go.
You should worry a lot about peak oil.
“You should worry a lot about peak oil.” And the other stuff, like the Peak Planetary Species matter.
No one in the world predicted the shale revolution
Ron Patterson comments on Laherrère’s rebuttal to Magueri, September, 2012:
“I am picking peak. Peak oil is already in the rear view mirror and the decline has already started. Of course that is Crude + Condensate. I have no idea when bottled gas might peak.” Yawn.
I don’t recall ever writing that. But if I did I was simply mistaken.
Hi Ron,
The full comment is at the link below:
http://www.theoildrum.com/node/9495#comment-920822
It was in response to a comment by Rockman about the Peak Oil Dynamic (POD) at link below:
http://www.theoildrum.com/node/9495#comment-920803
Still lithium ion early 90’s Japanese tech.
It has been a while campers.
“we will have electric cars with 200 mile range at an affordable price”
Electric cars make sense only for a group of drivers who fit the following parameters
1. Drive within that range in a day
2. Do not drive on highways
3. Drive enough km’s so that running cost trumps battery replacement cost. (If you don’t drive enough the battery costs are big enough to make it as expensive as an FF car)
I guess this still fits the bill for a huge number of people in the west.
Oh come on, with the new fast swap systems already developed the battery can be changed in 7 minutes so range is not a problem. Fast charges can be done in an hour, just eat lunch while it charges.
Electric cars can run at highway speeds and have low coefficients of drag.
If you don’t use a car much, use the battery as backup for the house. Of course if you don’t use a car much, the type of car is not that important and a cheap FF ICE may do as well, even if gas is $8 a gallon.
Average distance traveled in the US per day is 34 miles.
I really don’t think most people buy an EV or hybrid to save money at this point in time, though they probably will. I think at this point the market is tapping those who have a higher level of consciousness of the situation. EV drivers are the brave frontiersmen of future travel (heroic music plays and fades as EV drives off into the sunset).
The technology of swapping was never an issue. The problem is implementation.
I think Better Place went bankrupt trying to do the same.
“Of course if you don’t use a car much, the type of car is not that important and a cheap FF ICE may do as well, even if gas is $8 a gallon”
Yes. That’s what I was trying to emphasize in previous posts, Electric EV’s will be a non-starter here. They make perfect sense in US.
I am not predicting that car sized batteries and electric motors will someday be cheaper than transmissions and petroleum fueled IC engines but I would not be surprised at all to learn- if I live so long – that battery electric vehicles are substantially cheaper to OWN and RUN than equivalent I C engine powered cars a decade or two down the road.
A large and sophisticated country such as India faced with paying for imported oil might decide the best way to go would be to go electric and renewable on the grand scale.
The country has the technological capacity to do this and doing it would keep the oil import bill down while building up the domestic renewables industries – which can BRING IN foreign exchange instead of sending it OUT of the country the way IC powered cars do now and will continue to do.
The truth is that no body knows with any degree of certainty how far the price of batteries can fall or how high the price of oil can go.
But one thing seems certain, and that is that coal can propel battery electric vehicles cheaper than oil burned in them directly at some future time because the world is much better supplied with coal than it is with oil. Oil will gradually get to be more and more expensive compared to coal.
We hear all the peeing and moaning about the difficulties of integrating wind and solar power into the grid – and I do realize the problems are real – but in many places coal fired generation has traditionally been used to balance the load on the grid.
Coal plants CAN follow the load. In some places they actually shut them down and turn off the juice part of the time to conserve the coal. This is no doubt hard on the boilers and turbines but ya gotta do what ya gotta do when ya have to.
India in the future can run on wind and solar power to the extent possible and top off battery powered vehicles with coal as necessary – and probably do it much more economically than she can run her autos and light trucks on imported oil- maybe not now but later.
OFM discusses battery cost and overall cost of electric vehicles.
A few years back a British startup solved several efficiency problems with electrics that seem to be ignored in the mainstream at this time. They put the motors at the hubs of the wheels with computer control. This makes the system more lightweight and more efficient as well as having the advantage of individual wheel control. They also added flash capacitors along with the batteries. The flash capacitor can take up the regen braking cycle much faster than batteries can, thus storing much more of the braking energy.
So there is still room to improve the electric vehicles beyond battery improvements. We should be able to have full sized cars running at 0.2 kwh/mile to 0.25 kwh/mile instead of the 0.3 to 0.35 we have now. That is a huge improvement in energy use.
As far as coal fired and natural gas fired electric power, we need to get rid of both ASAP.
Zep,
Out of interest, what is the limiting factor for re-gen braking? The battery, the generator, or the control of the braking effort.
I was surprised when i saw re-gen only did about 20% of the braking.
BTW, didn’t Dr Porsche first put electric motors in the wheels, around the turn of the century. The turn of the 19th century that is!
wiseindian says:
“Electric cars make sense only for a group of drivers who fit the following parameters”
4. Those that can afford them!
Electric vehicle sales and hybrid sales are down. Those that can afford them will likely choose gasoline vehicles since gasoline prices are lower and they choose to buy larger vehicles (SUVs, Trucks, etc) instead of smaller electric\hybrids.
The next time gasoline prices jump or the next financial crisis, there will be a lot of job losses and thus preventing any significant increase in hybrid or electric vehicle sales because people won’t have the money to buy them. I suspect that over the next 5 to 7 years manufactures won’t be selling electric or perhaps even hybrids anymore. They will likely be selling subcompact 50+ mpg gasoline cars instead.
The US electric grid infrastructure is in terrible shape. For starters the US is decommissioning about 95 power plants this year ~20GW of baseload power. For this year electricity prices, are a bargain because all of the plant operators are keeping these plants operating (avoid standard periodic maintenance, low demand – low prices) in order to extract as much revenue to help pay for decommissioning costs. There is no point to perform maintenance on a plant that is going to be decommissioned. By 2016, electricity prices will start to rise substantially as these plant closures reduces baseload supply. In additional to Coal plant shutdowns, the US is losing about 2 nuclear plants ever year. I believe only one new nuclear power plant is under construction, but has suffered numerous delays and cost overruns.
Since the US economy is weak, especially for industrial consumption, Power companies are not getting sufficient revenue to fund upgrades and long term maintenance. As prices rise (due to coal plant shutdowns) consumers will cut consumption and further impact long term infrastructure investment, and probably create a minor feedback loop (as consumption demand fails, utilities will need to cut generation, and raise prices further to maintain existing systems).
Businesses with high electricity demand will continue to move operations overseas (mostly China and India) which will further erode employment in the US.
US Power plant operators and engineers are retiring. Few Gen-X or millenniums had interest in utility jobs and there is a severe lack of manpower available. I suppose the US can import foreigner workers, but foreign workers probably are not familiar with US equipment and US regulations.
“I guess this still fits the bill for a huge number of people in the west.”
Commutes are getting longer as workers are pressed to to find jobs in a weak job market. Many people are still underwater (home mortgage) and cannot sell. They are being forced to driver longer distances for work, instead of moving (unable to sell exiting home without a loss).
CA and NV present huge problems for the Western US, if the drought doesn’t break soon. I would imagine if CA does run out of water it will create enormous economic problems from the US as people migrate out of CA (causing higher employment in neighboring states), CA business shutdowns, and perhaps trade disruptions with Asia)
“Those that can afford them!”
Haha. Yes I forgot that.
I think financial crisis will be a nightmarish scenario for EV’s. People will drive less and will want more bang for buck in their vehicles so even if collectively an EV made sense, people will stick to old FF cars and drive less because it makes sense individually.
They sell around 17 million cars per year in the US for an average price of around $35,000. If you can buy an electric car with a 200 mile range for the same price why should affordability be an issue?
I agree that we will have a financial crisis. However that is not the same thing as end of civilization. Financial crises, recessions and depressions come and go.
They sell around 17 million cars per year in the US for an average price of around $35,000. If you can buy an electric car with a 200 mile range for the same price why should affordability be an issue?
I always consult with Consumers Reports before buying a car. The magazine has given great ratings to both the Prius and the Tesla.
According to Consumer Reports, the Prius has turned out to be a very reliable used car, so if one is looking for a used car to buy, the Prius is a better purchase than many non-hybrids.
I think that is the point. As more hybrids and EVs are purchased and then rolled over into the used car market, people who have little money to spend can still be able to buy one — an older used one (which may prove to be a better car for the money than a used FF vehicle).
Suyog says:
“They sell around 17 million cars per year in the US for an average price of around $35,000. If you can buy an electric car with a 200 mile range for the same price why should affordability be an issue?”
In the US they “loan” about 10 million vehicles per year since consumers can’t really afford them. The Majority of new vehicles are financed and the more than half are subprime loans.
No nobody is buying EVs or Hybrids anymore:
Hybrid, EV sales tumble in 2015
http://www.detroitnews.com/story/business/autos/2015/07/01/hybrid-ev-sales-tumble/29565265/
“Sales of hybrid and electric vehicles fell sharply in the first half of 2015, hurt by low gas prices, fewer incentives and a broader market shift away from cars.”
“Nissan said sales of its all-electric Leaf fell 12 percent in June and are down 23 percent this year to 9,816. At the current pace, the Leaf is on target to have its worst sales year in the U.S. since 2012.”
“Honda Motor Co. said sales of hybrid and plug-in hybrid vehicles fell 15 percent in June and are down 21 percent this year. The company said last month it ended production of the Civic hybrid and Accord plug-in hybrid.”
“Toyota Motor Corp. said sales of its plug-in hybrid Prius are down 72 percent in June and 69 percent for the year. ”
[This pretty much says EV’s and hybrids will be disappearing from production in a few years. No body is buying them anymore]
Suyog says:
“I agree that we will have a financial crisis…. Financial crises, recessions and depressions come and go.”
Not this time. We are in a long term economic collapse. The US has lost more than 20 Million jobs since 2000 and continues to loose jobs every month. the same is true in the EU and is now spreading to Asia. There is too much debt, and the people, businesses, and gov’t can’t pay the debt owed. There is no money to pay for mitigation transition from Fossil fuels. The global economy will continue to weaken, and there will be a rise in civil disobedience. There will be civil wars and regional wars, that transition into a global war. There is only one “bright” spot in the global economy: military spending.
Note there is one huge issue that is never discussed by the media and by gov’t: declining resources (especially energy & water). Its blatantly being ignored because its the problem that can’t be fixed. The gov’t and media would rather focus on Global warming, healthcare, immigration, etc. none are as critical as resource depletion. The US doesn’t even have a plan to address the Western US drought!
[This pretty much says EV’s and hybrids will be disappearing from production in a few years. No body is buying them anymore]
As oil prices rise again, there will be a continuing need for highly fuel efficient vehicles. If auto companies stop producing EVS and hybrids, they will likely need to be producing something else.
One way or another, we need vehicles that don’t use much oil, or we need transportation systems that don’t require personal vehicles.
I can foresee a time when many people minimize going anywhere, but as long as there are vehicle manufacturing companies, I think at least one of them will serve the highly fuel efficient market.
“They sell around 17 million cars per year in the US for an average price of around $35,000”
And how much does a 10 year old Toyota Corolla cost ? As we go forward you will find out that EV’s are competing with them.
Hi Wiseindian,
When buying a 10 year old car, the purchase price of the car is a very small part of total cost of ownership, the EV or Prius will beat the Corolla on total cost of ownership (with fuel cost and repairs being a part of the total cost).
I don’t have an opinion on the future of EVs.
However, I do believe life will get tougher for the middle class. I think that in order to save money, they will drive less. So I think oil consumption will go down, one way or another.
1. In a couple of years affordable electric cars will have a range in excess of 100 miles. That is good enough for most people. Range will continue to improve with time as the battery technology improves.
2. Who says you cannot drive electric cars on highways? They have a top speed of around 90 mph.
3. Batteries come with a 8 year/100,000 mile warranty. If you don’t drive much then it doesn’t matter what you drive since cost of gasoline should not be an issue.
As a metaphor for the dream of a high tech electric future versus the reality of our crumbling infrastructure, it would be ironic if some poor soul were driving his brand new Tesla home across a decrepit bridge that collapses just as he is driving across it.
Commentary: Will we be able to maintain & replace our energy & transportation infrastructure in a post-peak oil world?
http://www.resilience.org/stories/2011-04-04/commentary-will-we-be-able-maintain-replace-our-energy-transportation-infrastruct
HI JB,
I personally expect the most likely scenario will involve ” the system” seizing up like an overheated ice engine run without cooling water in many parts of the world. If things work out this way then history tells us that at first long term problems will be ignored in favor of medium and short term problems and then medium term problems will be ignored in favor of ever shorter term problems.
Some places may go from ” she’s running hot” to permanently seized up in a matter of weeks or months. Society could still function without spending a dime on roads and bridges for a year but cut off maintenance at the water treatment plant and there could be millions of people walking out of a city without water in a matter of days if the wrong pieces of equipment failed.
My thinking is that in most reasonably well governed countries the government will exercise emergency powers once the fecal matter is obviously into the fan and institute war time type economic controls so that bridges get at least emergency repairs -if they are NECESSARY bridges- and that water treatment plants continue to operate.
There is still plenty of fat and waste at least in a country such as the USA, Canada, and a few others.Such countries should be able to keep truly critical infrastructure up and running for a good long time- hopefully long enough to come up with workable solutions to resource shortage problems.
A good many problems are going to be solved the ” hard ” way – by doing without stuff taken for granted these days.
Personally I expect that with luck things will mostly go downhill rather slowly ( in historical terms ) in rich western countries… Meaning there is a substantial window of opportunity for well off westerners to adapt.
My corollary to your advice to get hence to the non discretionary economy is to stay out of places such as Egypt.
So Jeff, do you really think that the crumbling infrastructure in this country is due to some nebulous collapse of society and those trying to solve problems should die? The infrastructure problems in this country is due entirely to mismanagement of funds at all government levels and the penchant to fuel wars of ideology and oil across the globe with the monies. It is also due to the constant excessive subsidizing of the fossil fuel industry and business in general. All poor and wrong decisions.
The richest country in the world had plenty of money to keep up with highway and other infrastructure but frittered it away to keep the status quo of foreign oil while it short-shrifted it’s own citizens. There is no grand collapse of society, there is a greedy incompetent misdirection of funds being wasted and sent abroad.
Don’t look to natural resources for the cause, look at greed, mis-direction, short-sightedness and incompetence. We keep playing in the sandbox using up our money and resources so other people can make the money and get the resources. Meanwhile a new Tesla (representative of all new helpful technology) crashes through a crumbling bridge (representative of the money that was burned elsewhere for “political” reasons.
Rumor is there will be a deal with Iran. If true, look for WTI in the 40s.
What a reversal from 2010-2014 re oil prices.
All US oil producers look to be under stress to varying degrees if WTI goes back below $50 and stays there through year end.
I am really worried about us, to be frank. No debt but high LOE. Low 40s WTI puts us at high 30s in the field, and that puts us under stress. Could breathe at $55 in the field. Cannot below $40 in the field.
If this does happen to prices, small conventional US producers are in jeopardy. Unfortunately, that is a group of small business owners.
The one thing helping the small guys is much of the previous 10 years were very good. Many have low debt levels and accumulated some cash. Once the price drops below the cost of production, it does not take long for that security to disappear, however.
On the other hand, high prices also lulled many small producers into borrowing money to expand. There is no one to bail them out, I really don’t know how small producers with debt can make it absent the banks allowing them to pay interest only. Unlike shale, small producers typically are on a 5 year amortization schedule.
I will admit as I saw US production growing by leaps and bounds, I did worry prices would drop. However, I thought 70 would be a floor, which was not a big deal to us, at least. The bears a year ago, like Ed Morse, said $70-75.
Therefore, no US producers were really prepared for this. Look at all the three way collars employed by the shale guys, which were set at $70-75. They thought the same thing.
I hope I am wrong, but this is looking to get ugly. US could actually hit 10 million before the year is out. I didn’t think this was possible, but I did not foresee the level of denial that the US financial system would provide to the Saudi Americans with drilling fever.
Before this is over, I think a few big names could fall. They cannot burn several hundred million per month through 2016.
I see crescent point energy bought out two oil companies in last month or so. I guess they are betting on oil rebound.
Andy hall still bullish oil, and expecting demand will be much higher than predicted.
My thoughts are prices will stay low for couple of years until the marginal producers get shaken out.
Best bet would be to buy oil futures 3 years out.
Regarding the outlook for increased oil production from Iran, the obvious analogy that occurs to me is Iraq. A few years ago, Stuart Staniford did a “What if” scenario for Iraq, assuming that the Iraqi Oil Minister’s projections for future oil production were more or less correct:
http://www.theoildrum.com/node/6101
As you can see, reality fell somewhat short of the oil minister’s projection.
And of course, what counts is oil delivered to the export market. In the 2002 to 2014 time period, the highest production rate Iran has shown is 4.2 MMBPD (total petroleum liquids + other liquids), in 2005, when they consumed 1.6 MMBPD, resulting in 2005 net exports of 2.6 MMBPD.
The EIA shows Iranian production of 3.4 MMBPD in 2014, and BP shows consumption of 2.0 MMBPD, for 2014 net exports of 1.4 MMBPD.
Because of natural declines and because of sanctions, I would think that it’s going to take a while for Iran to show a meaningful increase in production, and in any case I would assume that it’s entirely possible that some “unofficial” Iranian oil has been making into the global export market.
Following is an excerpt from an analysis by Mark Lewis, a very sharp and well regarded energy analyst:
I hope mr Lewis is right, but I am getting pessimistic, due in part to dollar strength. Iran issues will drive down price in near term on perception, more than reality.
Don’t get me wrong, I think the price will head back up, but it could take awhile. There are many big egos all trying to show how much they can produce.
Two things could arise out of recent events.
1. We could find out KSA’s maximum capacity.
2. Totally unrelated from 1., Israel could do a preemptive strike on Iran.
I may be wrong, but I foresee Iran playing the same inspection games Iraq did. I was a kid during the hostage crisis. Still, I followed that closely, though just in middle school. I have never trusted the higher ups over there since. I do realize USA asked for it, by meddling in their affairs prior thereto. But the hostage matter was inexcusable. 35+ years later it is still celebrated. No remorse, no apology. The Mullah’s still say, “death to America.”. Iran still sponsors terrorism.
It wouldn’t surprise me if, in a few months after this deal is signed, Iran announces they have a nuke.
On the other hand, Israel likely has good intelligence. Rightly or wrongly, they feel by doing this deal, USA has stabbed them in the back. Therefore, they will not hold off on military action at USA request.l, as they did with Iraq.
Would like to hear what others think about the Iran situation.
Jeffrey,
The success of shale oil has definitely changed the economic landscape through reducing the US current account deficit, which strengthened the US dollar, which in turn weakened the World economy and World oil demand. However shale is now also victim of its own success. It is only when US oil production falls substantially (at least two million barrels per day) which would increase the US current account deficit, when oil prices can come up again through a lower US dollar. So it may take at least two years until oil is up again to 75 USD per barrel. Just now oil fell to 51 USD per barrel and looks technically very weak. In the fall and by year end it looks like oil could fall into the forties again. I have warned people again and again, yet they did not believe me and lost fortunes. This has nothing to do with the big picture of peak oil. The short term trend of oil (three years) is more determined by the strength of the USD which creates worldwide tight liquidity condtions and thus low oil demand. The scenario of a strong dollar and high oil price does not exist. It is just unrealistic to predict such a scenario. It could happen only when oil is in extreme short supply, which is currently not the case.
Whenever anyone talks about the politics of climate change, I keep asking, “Why?”
If a group of people wanted to get changes made now, why promote information about something that everyone says won’t reach full impact for decades?
If there is an ulterior motive in exaggerating climate data, I fail to see why anyone would do it. There are so much more effective ways to scare various populations.
So I am more skeptical about those who protest climate data than I am about those who believe it is true.
I can assign a motive to those who might want to debunk climate data: money. If your lifestyle and your industries are based on “business as usual” you are likely going to fight anything that changes BAU.
In terms of who might make money from climate data projections, it seems to me the nuclear industry would be at the top of the list. Is anyone trying to claim the nuke industry supporters are the ones “exaggerating” GW risks?
Nicely put – cui bono? Another aspect may be the different influence of the amygdala versus the pre-frontal cortex – those dominated by the amygdala have a problem with change of any kind, which may sound as a negative, but actually appears to provide some evolutionary advantage, there’s a good book by Chris Mooney called The Republican Brain: The Science of Why They Deny Science- and Reality on the subject.
I think it’s the watermelon factor. Lots of lefties are into changing the way the economy runs, using global warming as an excuse. On the other hand, it could be a genetic factor.
I think it’s the watermelon factor. Lots of lefties are into changing the way the economy runs, using global warming as an excuse.
That doesn’t make sense to me.
Why would lefties use global warming as a reason when there are better reasons to offer?
And there are multiple reasons to move away from fossil fuels that have nothing to do with global warming.
I see you saying “Lefties support global warming science. I don’t trust lefties. Therefore the science and conclusions must be wrong, too.”
You haven’t given me a reason why they are using global warming data to take over the world. The world is going the way it is going anyway.
Your thinking seems to be more about a knee jerk reaction than an explanation why anyone would bother with global warming to get world economics to change.
I also think you aren’t factoring in Silicon Valley mentality. Those folks like to make money. Lots of money.
They are going to support reinventing the energy industries because there is lots of money to be made. Now you can fault them for having an ulterior motive for pushing renewables, but they are operating like capitalists, not leftists.
Renewables are coming because 1. economics and 2. financial opportunities for a new generation of rich people.
Technology is not energy.
I live in the Bay– and most silly con people I know are high cognitive programmers, but have little understanding of most science.
They have lived in a world where tech has always come through—
The private space guys are waking up to reality—-
It is much more difficult than they realized, and their fall back is the Russians, who are really good a large projects.
They have lived in a world where tech has always come through—
Fernando’s big argument is that the folks pushing climate change on the unsuspecting world are “watermelons” looking to take over the world.
The Silicon Valley folks aren’t watermelons. They support various new energy technologies, not because they are leftists, but because they think they can reinvent the various energy production, distribution, and usage technologies.
Are they arrogant to think that? Sure. But the politics of energy will change as the fossil fuel money loses influence and the Silicon Valley money gains influence.
Fernando is giving us his view as a former Cuban living in Europe. I’m suggesting there are other dynamics which he is leaving out, perhaps because they conflict with his worldview or because he isn’t familiar with them.
I’m just saying the Sill Con people have been playing in only one part of the pool, and it happens to be mostly in the shallow end (I’m a former Apple employee).
Most of these people are my peer group.
They are techno narcissus, and, while very high cognitive, have little real experience in the world.
As we have seen from Space and Solar, they are not doing that well.
The early computer game was low hanging fruit.
In the 80’s, Intel, and the other chip makers sure saved American business, and helped US dominance in a strategic area.
We are now social media driven, and into data mining.
Yes, I get what you are saying.
But what I am talking about is the politics of climate data. Fernando’s point of view is that it is fraudulent information being intentionally put out so that leftists can take over the world.
I’m saying that doesn’t make sense to me. For one, no one needs to manipulate scientific data since much of what is happening in the world is due to economics that are running their own course.
And for another, Silicon Valley has been interested in energy technology. They aren’t these 1960s leftists plotting to take over the world. They don’t fit Fernando’s stereotype, but they do support renewable energy, new technologies to use energy more efficiently, and so on.
Whether or not Silicon Valley can accomplish its goal is one discussion. But I am focusing on a different discussion: the politics of renewable energy. In Silicon Valley: libertarian, yes; communist, no.
Fernando seems to think universities and research institutes are overrun with communists planning to take down the world. That doesn’t fit the Silicon Valley venture capital mentality. These are folks hoping to get very rich. They aren’t Che Guevara types.
Totally agree with your point on Sill Con not being leftist.
Originally, some communal aspects coming out of the culture of he 60’s, and resisting money and profit, but that is in the rear view mirror.
Most were stoned libertarians.
Now kinda bland techies, often from parts of the country with values much more conservative than the past.
Fernando, The way the economy runs is changing because of peak resources, especially oil! Lefties have squat to do with it. Global warming is a reality, not an excuse for anything. The world is full, growth is dead, the old paradigm doesn’t work anymore, and you are living in the distant past!
Seem we need to jettison the pre Bay of Pigs world, and adjust to this hot, crowded planet we live on.
We are in massive overshoot, in a mass extinction, resources are diminishing, and solutions scarce.
But, being a Earthling, I still enjoy my planet, and will do what I can to save what’s left.
But, being a Earthling, I still enjoy my planet, and will do what I can to save what’s left.
Yeah! I must concur. My girl friend just texted me that she is looking out at the bay from her Miami apartment and counted six dolphins frolicking there this morning.
As for me I’m leaving for Sao Paulo Brazil this Friday and I will have ample opportunity to go out into the Brazilian wilderness and also go diving along the Rio de Janeiro and Sao Paulo state coasts. It is still a very beautiful place!
EIA’s estimates for state crude oil production account for incomplete, lagged data
July 10, 2015
http://www.eia.gov/todayinenergy/detail.cfm?id=22012
Market analysts have a keen interest in understanding how crude oil production in key states has been affected by recent changes in crude oil prices and drilling activity. EIA develops state-level production estimates for selected states that are based in part on state-level data. However, data published by state agencies are often incomplete when first published because of a combination of late reporting and processing delays, mainly due to the filing of production reports that do not contain all required information. Because EIA’s methodology for state-level production estimates aims to anticipate and account for expected revisions to data collected by the states, state-level production data published by EIA and state agencies can differ.
Production data for Texas, the largest crude-oil producing state, published by EIA in the Petroleum Supply Monthly (PSM) and by the Texas Railroad Commission (TRRC) in its monthly reports, reflect differences in the treatment of incomplete and lagged data. As shown in the left-hand panel of Figure 1, Texas production data in the PSM and TRRC reports published in June 2015 are virtually identical through 2013, but there is a gap between the reported data for more recent months that grows larger for months closer to the present. The middle panel of the graphic shows how data reported by the TRRC have evolved over time as processing and filing proceeds, with significant upward revisions in the data for recent months covered in each report as later reports are issued. The right-hand panel shows EIA’s PSM estimates, which, given EIA’s effort to account for expected revisions to state agency data in its initial estimates, generally do not show large revisions as later reports are issued.
There are several reasons why the TRRC’s initial reports tend to be low. For one, some reports are placed in a pending file while waiting for other state reporting requirements to be satisfied. In addition, there are always delinquent reports from oil and natural gas operators and reports with discrepancies that take time to resolve. Each month, Texas posts its own calculation of how low its initial estimated production values are. In addition, EIA has for several years measured the change in reported volume from month 1 to month 24, showing an average increase of 30%. These issues are eventually resolved, and the production data are incorporated into TRRC’s published reports, generally over the course of about two years.
continued
It is also important to note that EIA’s published estimates include lease condensate, while some tables that TRRC provides tabulate crude oil and lease condensate separately. Condensate accounts for about 15% of the total crude oil and condensate volumes produced in the state of Texas.
At the beginning of the monthly reporting process, EIA uses information from third-party data vendor Drillinginfo Inc. In the case of Texas, Drillinginfo combines the accepted and pending file data records. This combination reduces the time lag between initial reporting and reasonably complete data from two years to about five months. Within those five months, the difference in production volumes is generally attributed to late and incomplete data reporting.
EIA uses the state’s preliminary data plus the pending file from TRRC (as aggregated by Drillinginfo) as the starting point to make production estimates. EIA also uses the first-purchaser volumes of crude oil from the EIA-182 survey, Domestic Crude Oil First Purchase Report, to make estimates of what will eventually be reported as complete production for the most recent months in an effort to account for data submitted late or incomplete to the TRRC.
Note: Reporting month 1 is the first time production is reported for a given month. Reporting month 2 is the second time (i.e., the first revision) production is reported for that same month. These data reflect monthly reporting for June 2011 through March 2013.
continued
Texas is not the only state whose data are incomplete in initial report months. A full explanation of EIA’s approach for Texas and other states can be found in EIA’s methodology report for the Petroleum Supply Monthly.
The need for EIA to calculate a true-up oil production volume for states, including Texas, will soon be replaced by a direct EIA survey of oil producers, just as it currently surveys natural gas producers in its EIA-914 survey. The survey garners about 95% of produced natural gas volumes in the Lower 48 states and is expected to achieve similar results for oil production.
EIA’s monthly natural gas production survey now directly surveys producers in 15 states, 10 more than in previous years. In addition, EIA receives timely monthly production data from the state of Alaska.
The addition of 10 states—Arkansas, California, Colorado, Kansas, Montana, North Dakota, Ohio, Pennsylvania, Utah, and West Virginia—significantly enhances EIA’s monthly state and regional coverage, which was previously limited to Alaska, Louisiana, New Mexico, Oklahoma, Texas, Wyoming, and the federal Gulf of Mexico. As suggested by the title of the new webpage, Monthly Crude Oil and Natural Gas Production, EIA will also report survey-based volumes for crude oil production from the states covered by the new EIA-914 survey. This oil production survey, which began earlier this year, is currently being evaluated internally and will begin publication later this summer.
Thanks Alex, it was a very interesting reading!
Dean,
we should thank the EIA that they bother to explain the inconsistency in their data
I think our debate here helped a lot in this regard
Things Fall Apart:
http://theweek.com/articles/565028/russian-air-force-falling-sky
I have not worried about the myth of the resurgence of the myth of the new Soviet Man ten-foot tall invincible Russian soldier…and nor have I fretted about the myth of the rise of the Red Dragon version either.
LTG constraints are going to kneecap all that relatively soon.
Some time in the not too distant future it will be people shooting at each other with cheap riles and blowing each other up with improvised explosive devices and throwing rocks at each other and hitting each other with clubs…of wait, we see prevues of all that now!
I agree with Mac: The U.S. and Canada may be one of the better places to be as the future unfolds…as long as Leviathan focuses its declining resources on the homeland, including having a credible schema for dealing with our neighbors to the South.
Baker Hughes last Friday reported a 5 units gain in U.S. oil rig count to 645, now up 17 units from 2 weeks ago after 29 straight weeks of losses.
The Permian led the major basins with a 8-unit jump to 239. This was the second weekly gain in a row for the Permian. The Eagle Ford and the Bakken, however, fell 5 units each to 81 and 71 oil rigs, respectively. These are the new multi-years lows for these two basins.
Several second-tier shale/tight oil plays, including Niobrara, Granit Wash, Ardmore Woodford, Arkoma Woodford and Barnett are all up 3-4 units from recent lows.
The number of oil-directed rigs in “Other” (mostly conventional) basins increased 4 units last week and 16 units over the past four weeks.
I think that the US oil rig count may have reached the bottom, but it is unlikely to recover as fast as in 2009, given the likely oil price weakness in the coming months.
Relative changes in US oil rig count in 2008-09 and 2014-15
(100= peak levels before the declines)
Alex,
What I find interesting in the BH rig count in the last few weeks, hasn’t been in the oil rig count going up a few rigs but the fact that vertical rigs have gone from 99 to 121 from the 5th Jun to current, With and increase of 13 rigs in the last week alone.
Combined with the drops in the Bakken and Eagle Ford, it appears to me, rather than an uptick in shale drilling, it is really a small uptick in conventional oil/gas drilling?
Maybe Mike and Shallow have been doing a little drilling on the side, and keeping quite about it? (Smiles)
Good point, Toolpush,
Indeed, it seems that conventional activity is recovering.
In addition, some operators are adding rigs in the Permian (see the article below).
I’m not sure that this will continue if WTI falls below $50 for several weeks or months
………………………
As oil teeters at $50, a few shale producers still drilling more
Jul 10, 2015
http://www.reuters.com/article/2015/07/10/us-usa-drilling-idUSKCN0PJ17U20150710
A handful of optimistic U.S. shale drillers are sticking with plans to deploy more rigs in the coming months even as oil prices take a sharp dive well below many producers’ $60-a-barrel breakeven point.
On Wednesday, Pioneer Natural Resources Co. became the first big company to publicly confirm it was drilling more wells, saying it had already added two rigs in the Permian Basin of Texas this month and would keep on adding two a month as long as the oil price “remains constructive.”
More rigs are planned for early next year. Pioneer said it plans to add eight horizontal rigs in Texas shale basins, bringing the total rig count to 36, or the same number it had before the price of oil collapsed by more than half.
Weeks, right? Not months…
Have just read an interesting article on Spain’s attempt to replace fossil fuels with Solar Photovoltaics.
see – http://energyskeptic.com/2015/tilting-at-windmills-spains-solar-pv/
But what is really good and is the part I recommend users on this blog to read is the section at the end – Pedro Prieto’s 4/11/15 response to criticism of his book.
“Of course, one has to accept that in this complex world, all energy sources are somehow interrelated, but, as Orwell said in The Animal Farm, ‘all animals are equal, but some animals are more equal than others’. This is exactly what is happening with the energy sources and its properties and qualities: they can all be measured in EJ or in TWh or whatever, but some are more equal than others. Meaning that there is an obvious ASYMMETRIC interdependence of energy sources, being in the last century, the fossil fuels (and oil in a very first place), the ones responsible for our present global status.”
From news at ‘Seeking alpha’:
• Oil production from U.S. shale in August is expected to fall by 91K bbl/day from July to 5.36M bbl/day, the most since at least 2007 and the fourth month in a row of expected production declines, according to the EIA’s latest monthly report.
• ‘”We need to see oil prices above $60 and more toward $65 to spur a recovery in the rig count, says Bloomberg’s Andrew Cosgrove. “The longer it stays below $60, the harder it’s going to be for U.S. production to ramp back up.’”
Similar things
Arctic Ocean could hit first ice free period in three years. Right now it is heating up very fast and ice is thinner than ever.
Friday July 31 2015
http://arctic-news.blogspot.com/
Fantastic goods from you, man. I have take into account your stuff prior to and you are just extremely excellent. I really like what you’ve acquired here, really like what you are saying and the way in which through which you say it. You are making it entertaining and you still care for to stay it smart. I can’t wait to learn much more from you. This is actually a great site.|