Dean Fantazzini has provided his latest estimates for Texas Oil and Natural Gas output.
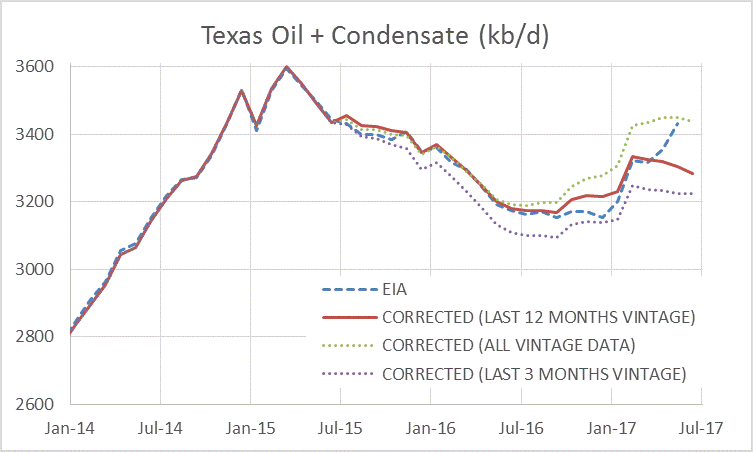
Data below is for Texas C+C estimates in kb/d.
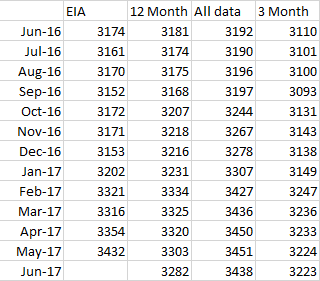
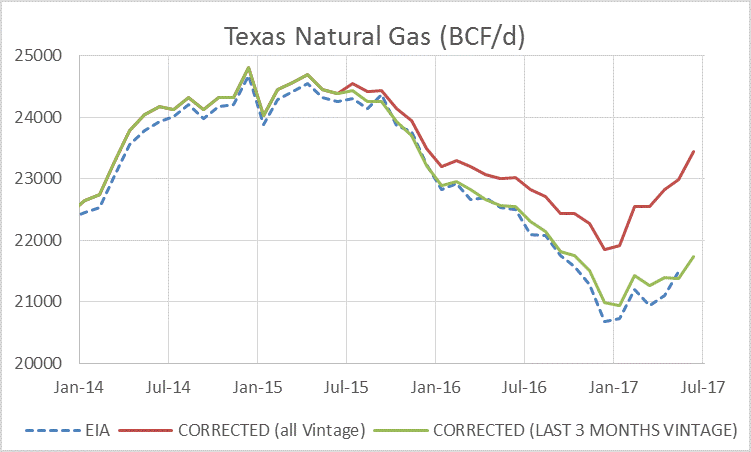
Data below is for Texas Natural Gas in billions of cubic feet per day (BCF/d). All data uses all vintage data for the correction factors and 3 months uses only the average of the correction factors for the most recent 3 months.

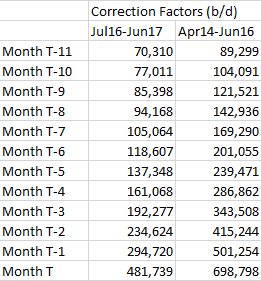
The chart below shows how the correction factors have changed over time, the average of these correction factors for T to T-11 are found for all vintage data (all shown in chart), most recent 3 months, and most recent 12 months and compared with EIA data. The average correction factor is added to the most recent Texas RRC reported output data. For the current report T= June 2017, T-1= May 2017, etc. The actual estimate in the first chart shown above uses Data for T to T-23, but I only showed the data for T to T-11 in the chart below. The correction factors get progressively smaller as we go further back in time (T-23 is the smallest).
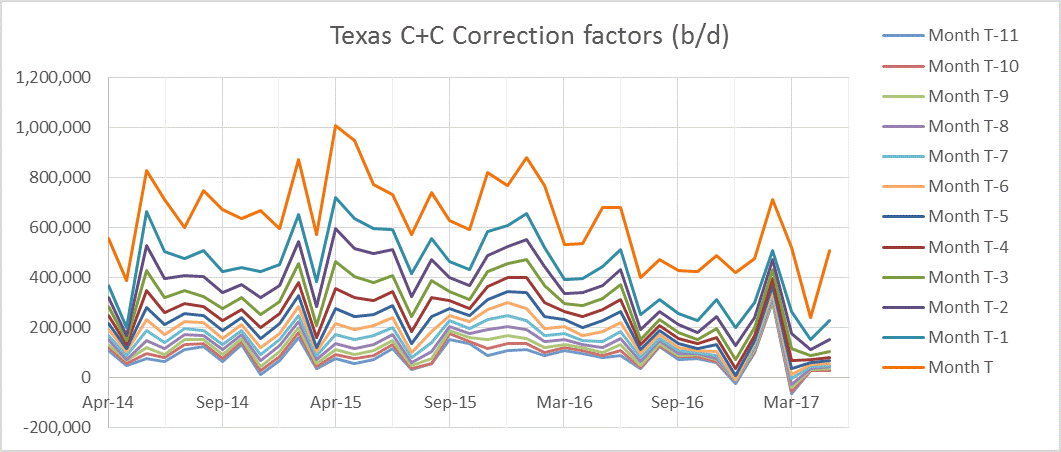
After June 2016 there was a shift in the correction factors to lower average values. The table below shows the average correction factors for the most recent 12 months (July 2016 to June 2017) and compares with the average correction factor from earlier data (April 2014 to June 2016). The RRC data seems to be improving, but for the most recent 7 months (Nov 2016 to June 2017) about 100 kb/d to 500 kb/d needs to be added to the RRC data to “correct” for incomplete data. Those with access to the “pending file” from the RRC have a better shot at a good estimate. This data is included in the estimates from drilling info for Texas.
So, what does all this tell us about when in 2018 we can expect US production to reach 9.9 million barrels a day?
Depends on the oil price which is impossible to predict.
Seems like the right answer.
Hi Guym,
Looking at the 11 month trend for US C+C output estimates by the EIA through May 2017 (most recent data point) we see a 700 kb/d per year rate of increase in output, rounding to 2 significant digits, May US C+C output was 9.2 Mb/d and 9.9 Mb/d is reached in May 2018, if the trend continues. Higher oil prices makes this more likely and lower oil prices less likely, a lot depends on oil prices and of course what happens to supply and demand for oil at the World level will effect future oil prices, all of these things we can only speculate about.
BHP’s $50 bn shale oil blunder
http://www.abc.net.au/news/2017-08-23/bhp-billion-dollar-shale-oil-blunder/8832698
This storm is definitely going to have some data coming in.
Looks like a Cat 4 (or 3- small possibility of a 5, but I don’t believe that) on landfall.
This is going to be a mess.
I’m hearing a message from a german internet weatherchannel.
It seams to get a big big mess – the hurricane will stay at the coastline until tuesday!!
If you are there please board up your house and evacuate if you don’t live in a safe house on a hill – the hurricane can’t continue into the land because of 2 high pressure systems. And he can get new water from a very hot GOM – there will be big inland flooding.
So the most likely scenario is that oil production is currently dropping whilzt gas production is surging??
Hi Daniel,
I think it is too early to say that Texas output is dropping, my guess is that output levels have been relatively flat in Texas from March 2017 to June 2017 with a change of +/- 50 kb/d over that period.
Keep in mind the most recent month’s estimate (June in this case) often gets revised by +/- 100 kb/d the following month. As can be seen by the wide movements of the correction factors from month to month the level of “completeness” of the Texas RRC data reports is variable. It is impossible to know until 6 to 12 months later the actual level of output, these are estimates which will be revised as we learn more in the future. Patience is needed, the error bars are large.
The most recent Tight Oil Production Estimates from The US EIA are at the link below
https://www.eia.gov/petroleum/data.php#crude
The latest estimate is for July 2017.
The 12 month Trend for Texas LTO (includes some output from other states such as New Mexico, Oklahoma, and Louisiana) is 599 kb/d per year over the past 12 months and for the US it is 722 kb/d. Chart below uses EIA data (link above) from August 2016 to July 2017 from the Tight Oil Production Estimates link.
We do not know if this trend will continue or if the EIA estimates are accurate.
Thanks, Dennis. I have the impression that Texas is following the same path as North Dakota, where the gas-to-oil ratio is increasing fast. However, more data will be needed to confirm this trend.
Hurricane Harvey may affect refineries in Texas. Rain, not high wind speeds, is forecasted to be the main problem but it is picking up strenght and may become a Cat. 3.
https://www.bloomberg.com/news/articles/2017-08-25/harvey-strengthens-as-gasoline-surges-on-texas-refinery-threat
I’ve been through a couple Cat 3’s in Florida. The wind is rarely a major issue. What gets you is the rain, the flooding and the storm surge. This hurricane looks to be an especially bad one with regards flooding! It’s forecast to bring drenching rains and high storm surge and then to add insult to injury it looks like it will hang around for a couple of days dumping even more rain.
http://www.nhc.noaa.gov/text/refresh/MIATCPAT4+shtml/250846.shtml
NASA is calling Harvey a cat 3 on Space.ccom
Could go to a 4. The eye has cleared out, and nothing but warm gulf water ahead.
Big danger is a stall, and 4 days of rain.
Might reemerge in the Gulf– and we would be off to the races again.
Wunderground is speculating an eye wall rebuild is in progress and this may limit the force but widen the area affected.
NAOM
Harvey just got upgraded to a cat 4.
http://www.nhc.noaa.gov/
For those who live in Texas, I wish you luck and hope you make it through.
NAOM
IEA’s monthly Oil Market Report, the free version was released today, dated August 11th.
Download PDF file from this page, https://www.iea.org/oilmarketreport/omrpublic/currentreport/
OECD crude & products inventories, chart: https://pbs.twimg.com/media/DIFXpwzXsAEqmiF.jpg
The gas and oil industry has reservations about some of the Trump rollbacks. They think he may be making the situation worse for the industry.
http://www.politico.com/story/2017/08/25/oil-and-gas-allies-want-trump-to-slow-down-242008?cmpid=sf
Baker Hughes Rig Count
US Oil Rigs, down 4: 759 (prev 763)
US Gas Rigs, down 2: 180 (prev 182)
Canada Oil Rigs, down 6: 115 (prev 121)
Canada Gas Rigs, up 9: 102 (prev 93)
Media is hyping the loss of refinery output will put pressure on oil prices. I see the opposite. The eagle ford produces 1.4 MB/day, and they have never been hit by a major hurricane. Wells don’t have backup power and many are in or near flood plains. I see the eagle ford production cut in half for several days, maybe longer.
Yes I seem to remember that after Hurricane Katrina in 2005 that the flood defences around all the gulf coast refineries were heightened.
A good bookmark for weather news…
NHC Atlantic Ops – National Weather Service – Verified account
https://twitter.com/NHC_Atlantic
6 refineries off-line, 4 currently shutting down. Oil prices down, gasoline and diesel up – or might be up-down-up-up again.
Ya know, mazama has the new BP stuff. Just took a look at the North Sea selection.
Their curve has turned up. Multi-year.
Must be miracle technology.
Or just a 4 to 5 year lag to get developments started in the high price years on-line (just as has always been the case in the previous boom and busts) – no news here.
Huge Battle Over Building the Largest Pipeline in North America—and We Have World’s First ‘Anti-Pipeline’ Beer
http://www.alternet.org/environment/huge-battle-over-building-largest-pipeline-north-america-and-we-have-worlds-first-anti?akid=16020.52744.P9ebWz&rd=1&src=newsletter1081612&t=20
How could anyone be against a beer pipeline?! 😉
Well, it depends on which way the beer is flowing. 🙂
EIA’s Drilling Productivity Report. They keep revising their completion numbers.
Just out of curiosity I compared the EIA’s estimate for Bakken completions to the North Dakota Director’s Cut
ZH ran two oil articles today. Both lead to comments following a narrative that got underway with methods unknown, which is:
The reason OPEC’s and Russia’s cuts haven’t raised price is the US has overwhelmed them with shale production increase.
1) The cuts were to happen 1 Jan this year. They were announced and hyped October last year.
2) Amount of OPEC cut agreed on 1.2 mbpd. Russia was to add (cut) 5-600K bpd. Total 1.8ish mbpd cut.
3) US oil production declined in 2016. Not an increase.
4) US oil production Jan 2017 vs Jan 2016 was a decline of 329K bpd
Feb 2017 vs Feb 2016 decline of 30K bpd
March 2017 vs March 2016 increase of 3K bpd
April 2017 vs April 2016 +210K bpd
May 2017 vs May 2016 +316K bpd
Sum that up and the US has produced 5 million more barrels this year vs last year, over 5 months. Not 5 mbpd. 5 million total / 150 days = 33K bpd. The 5 million over 5 months is only 33K bpd increase.
Versus OPEC’s cut of 1.8 mbpd.
And the price remains $47.
I see that some people on this site start to think.
Still a steady stream of projects started in the high price years coming onstream elsewhere – Brazil, UK, Russia, Norway, Kashegan- and still higher than normal storage, why wouldn’t prices stay low.
Watcher.
Have you ever compared historic corn and soybean prices to historic oil prices?
Look at a chart from the Arab oil embargo forward for all three.
The point is, why should OPEC extend its cuts? Price is lower today than when they announced them. And US production delta has been insignificant.
Hi Watcher,
It takes time for the oil storage levels to return to “normal” levels. OPEC and Russia understand this. When oil prices increase, they will increase their output.
Ya, that’s why they specified the time duration they did. And then extended it with another duration.
It is difficult to anticipate future supply and demand. I believe the plan was to cut for a period and see where things stood (storage levels and prices). No doubt this will be reevaluated at the end of 2017 (or maybe early 2018) and the cuts may be extended if oil prices remain low, or maybe not, anything in the future we can only speculate about.
“… why should OPEC extend its cuts …” – Maybe because a lot of the countries are in natural decline anyway.
Hurricane Harvey impacts on US Gulf Coast oil industry
TRADE FLOW
* With major Texas Gulf Coast ports of Corpus Christi and Houston closed to vessel traffic, imports and exports of crude and refined products will be delayed. But with Harvey now expected to weaken and largely stay clear of Houston, it is likely Houston area ports will be able to reopen sooner than Corpus Christi ports, and Houston area refineries will continue to operate.
REFINERIES
* Roughly 900,000 b/d of Texas refining capacity has been shut, primarily in the Corpus Christi region. Houston area refineries were monitoring the storm, but the most recent forecast shows Harvey staying largely clear of those plants.
OFFSHORE OIL AND GAS PRODUCTION
* Offshore operators in the US Gulf of Mexico have shut in more than 428,68 b/d of oil output, 24.49% of total Gulf of Mexico production, and 0.835 Bcf/d of natural gas output, 25.95% of production, according to a US Bureau of Safety and Environmental Enforcement survey Saturday.
ONSHORE OIL AND GAS PRODUCTION
* Oil operators have shut in what may amount to hundreds or even thousands of wells in the onshore Eagle Ford Shale in South Texas, which sits directly in the path of Harvey. Eagle Ford oil production is currently around 1.34 million b/d, according to Platts Analytics’ Bentek Energy.
PIPELINES
* Kinder Morgan shut down “select systems” of its 300,000 b/d crude and condensate pipeline in Texas. The shut-in is being implemented on the 250-mile Kinder Morgan Crude and Condensate line. The company is also implementing a partial shut down of its Double Eagle, Texas Gas Pipeline, Texas Natural Gas Pipeline and the Texas Interstates systems. All of the company’s terminals along the Houston Ship Channel were open Friday.
PORTS AND TERMINALS
* Corpus Christi area ports remained closed Saturday, and so far there are no reported oil spills or damages to storage tanks. The port of Brownsville, located further south on the Texas/Mexico border, reopened.
* All ports in the Galveston Bay port complex will remain closed for the next 24 to 48 hours, but initial steps are being worked out to open some parts of the upper Houston Ship Channel with Hurricane Harvey showing signs of a slowdown, the Greater Houston Port Bureau said Saturday.
https://www.platts.com/latest-news/oil/newyork/factbox-hurricane-harvey-impacts-on-us-gulf-coast-21762701
Currently, this is in the rear view mirror.
We have a problem Houston.
Why The Shale Oil “Miracle” Is Becoming A “Debacle”
https://www.peakprosperity.com/blog/110440/why-shale-oil-miracle-becoming-debacle
I suspect investors will continue to fund it until it peaks. Perhaps between 2019 and 2022, according to this analysis:
http://peakoilbarrel.com/future-us-light-tight-oil-lto-update/
So, if all the oil produced in the Bakken between 2009 and 2016 was accompanied by $32 billion in losses, and that the money to cover that 32 billion in losses was provided by investors, and I use that term loosely, who had hopes of receiving profits, perhaps due to future oil production increases, then who’s gonna pony up the cash after the production peaks and the idea of profits from future production increases can no longer be plausibly sold to investors? Who’s gonna fund USA LTO production, and why would they, in 2025 once the peak is in the rearview mirror?
It seems to me that the production collapses rapidly once the funding dries up. And it’s hard to fathom why funding wouldn’t dry up after production peaks; when the Ponzi scheme is exposed, as it were.
The situation in Libya changes daily. These 3 fields: El-Feel, Hamada and Sharara all seem to have been stopped. Adds up to over 400 kb/day of production…
Two more oil fields in Libya are being closed after an armed group took over pipelines to both deposits, further disrupting the OPEC nation’s plan to boost crude production.
El Feel, or Elephant, stopped production, Wessam Al-Messmari, an office manager for the Petroleum Facilities Guard that is protecting the field, said Sunday by phone. State-run National Oil Corp. declared force majeure at the deposit,
The Hamada oil field will gradually stop pumping through Monday because of the pipeline closing, Arabian Gulf Oil Co. spokesman Omran al-Zwai said Sunday. Force majeure was also declared on Hamada, he said.
Libya’s biggest field, Sharara, has been shut for about a week after an armed group closed the pipeline that linked the deposit to an export terminal, Al-Messmari said at the time. The field is still not pumping, a person familiar with the matter said Sunday.
El Feel is operated by a joint venture between Italy’s Eni SpA and Libya’s NOC. It has an output capacity of 90,000 barrels a day. Sharara, which has a production capacity of 330,000 barrels a day, is run by a joint venture between Libya’s NOC and Repsol SA, Total SA, OMV AG and Statoil ASA.
2017-08-27 Bloomberg: https://www.bloomberg.com/news/articles/2017-08-27/libya-s-oil-disruptions-widen-as-two-more-fields-halt-output
Refinery outages continued to spread Sunday, with roughly 2.2 million b/d of capacity down or being brought down. Corpus Christi-area refineries were already down ahead of the storm, and Houston area refineries Sunday were being taken down because of flooding.
Refiners have not reported any damage so far.
2017-08-27 Platts: https://www.platts.com/latest-news/oil/newyork/factbox-refineries-now-facing-brunt-of-harvey-21762771
In August the IEA lowered its estimate for world demand for 2016. Hence the unaccounted for crude oil mentioned in the news. Demand is still said to be have been slightly higher than their original January 2016 forecast (in yellow).
One of the many reasons why its hard to imagine that there is a lot of unaccounted for oil in the world is that building a new tank farm is big news…
PDVSA builds a new tank farm at Eastern Refining Center
Puerto La Cruz.- Enhancement project of Puerto La Cruz refinery, better known as Deep Conversion Project (DCP), aims to build up a new tank farm that will add 1.2 million barrels to Eastern Refining Center’s storage capacity.
Twitter: https://twitter.com/PDVSA/status/902086603518222336
Puerto la Cruz is Ven’s new Rosneft/Goldman Orinoco heavy oil refinery that will end the need for shipping to US Gulf Coast refineries.
Impact on stats: lower US imports (wackos will declare this a shale victory), lower product export, lower US oil production ( from loss of refinery gain).
Will change the dynamic.
The Chinese and GS are betting on this one.
An introduction to nuclear fusion for beginners (most of you will have heard it all before).
Bloomberg podcast 26mins: https://www.bloomberg.com/news/articles/2017-08-22/the-nuclear-tech-breakthrough-that-could-make-oil-obsolete
Fusion scientists are trying to raise funds for a bigger and better donut called, ITER = international nuclear fusion research
Construction of the ITER Tokamak complex started in 2013 and the building costs are now over US$14 billion as of June 2015. The facility is expected to finish its construction phase in 2021 and will start commissioning the reactor that same year and initiate plasma experiments in 2025 with full deuterium–tritium fusion experiments starting in 2035
https://en.wikipedia.org/wiki/ITER
US completions most likely increased in June but by how much is subject to revision. It seems you need a subscription to FracFocus to have the best insight…
Rystad Energy, August 22, 2017 – Fracking activity on the rise in 1H 2017
As data from many state authorities is subject to a reporting and processing lag, the FracFocus Chemical Disclosure Registry – a database on pressure pumping operations in the US – appears to be one of the most up-to-date sources when it comes to recent trends in completion activity, which Rystad Energy follows closely. It provides a wealth of insights into chemicals used in the hydraulic fracturing operations. Moreover, with more than 90% of recent frac jobs reported to FracFocus, it is also representative of the fracking activity in the entire US.
The data suggest that fracking activity has likely reached the level of around 35 frac jobs per day in April-May 2017. Although there is a higher degree of uncertainty when it comes to the most recent months, June 2017 has a potential for a further increase in the number of frac jobs, up to 39, which would constitute a 50% growth since December 2016. This level of completion activity is seen as sustainable in the short-term, and completion activity is set to remain strong in 2H 2017. However, further recovery requires an improvement in the market sentiment.
https://www.rystadenergy.com/NewsEvents/Newsletters/UsArchive/shale-newsletter-august2017
An attempt by the San Francisco Fed to predict Chinese oil consumption, fast economic growth could produce a demand of 20.8 mmb/d in 2025:
http://www.frbsf.org/economic-research/publications/economic-letter/2017/august/forecasting-chinas-role-in-world-oil-demand/
Growing about 4% or 5% or 6%/yr.
1.04 ^ 8 = 1.37 X 12.4 mbpd (present consumption) is 14 mbpd
1.05 ^ 8 = 1.48 X 12.4 is 18 mbpd
1.06 ^ 8 = 1.6 X 12.4 is 19.8 mbpd
Other than a big surge coming out of 2009’s global recession, 5% looks like a more typical recent year, with last year being weaker.
This year looks much stronger with a recent 5.5% measure for the year projected.
http://www.stockmarketwire.com/article/5642731/China-Petroleum-profit-up-as-oil-consumption-rises.html
India will add an even higher consumption growth rate compounding on their 4.5 mbpd today. Probably another 3 mbpd.
The sum . . . over 10 mbpd increased consumption by 2025 for just those two. Global production . . . nah, no way.
China will confiscate it from Japan. It’s the easiest and obvious thing to do.
South Australian wholesale electricity price hit $14,000 Mwh last night at sundown (currently $135).
Aussie bucks, Dennis.
New England currently $26/Mwh.
The Australian experience is becoming a renewable energy nightmare for grid scale electric production.
Edit: Just jumped to $150 Mwh. Hour and a half ago was $235/Mwh.
In addition to the astronomically high price (highest in the world), the wild fluctuations display the tenuous nature of relying upon these sources for widespread electricity distribution.
Australia has laws limiting implementation of PV so they have produced a surge/sag system.
It would be a nice thing to install a natgas energy plant there, to profit from theses spikes.
Gas plants are ideal additions to renewable energy due to be able to power up and down in short time.
Watcher should feel vindicated today.
400K Libya offline
300-400K GOM offline
300-500K EFS offline.
WTI dropped like a rock.
I was looking at oil prices in 2004 around this time of the year, they were about the same for us as now. Must be Moore’s law. LOL.
Of course, during Katrina oil spiked into the $60s WTI. Worse, gasoline hit $3 in my town for the first time ever. I filled up today for $2.099. Interesting stuff.
It’s a small club, and you ain’t in it.
The substance is created from thin air. How can you think it should conform to anything?
Some time ago I posted an interview with a Russian econ minister. The reporter kept asking him if the Russian economy would collapse because of low oil price. He kept replying the same way over and over, saying they were self funding with their own central bank and then he noted that Russian inflation was at their CB targets, unlike American inflation.
People don’t understand.
I surely know I’m not a club member.
Just interesting to see how there are different narratives at different time periods for similar events.
Relative prices are what matters. Inflation has been low and the real price of oil meaured in a basket of other goods is also low.
Doesnt matter what the value of a piece of paper is, its what you can trade it for that matters.
Dennis. I just think it interesting that grain and oil seem to be correlated.
Farmers say funds control grain prices more than supply and demand.
Have sold oil from $8 to $140 in past 20 years. Have sold corn from $1.59 to $8.20 in past 20 years.
Oh well.
The Houston refineries are off line and not buying – they are a big influence on WTI, lot’s of businesses shut down and nobody travelling voluntarily down there either, so gasoline might not spike for a few days.
Here’s the current narrative. The loss of 1 million b/d crude production globally is glossed over, and the focus is on the shut in refinery capacity.
http://uk.reuters.com/article/us-global-oil-idUKKCN1B903Z
Also, stocks are apparently so high that possible shortages following storm Harvey are not seen as a cause for concern.
http://uk.reuters.com/article/us-storm-harvey-oil-idUSKCN1B91EJ
Colombia halts Cano-Limon pipeline after rebel attack: sources
http://www.reuters.com/article/us-colombia-oil-idUSKCN1B900J?feedType=RSS&feedName=worldNews&utm_source=feedburner&utm_medium=feed&utm_campaign=Feed%3A+Reuters%2FworldNews+%28Reuters+World+News%29
Statoils Korpfjell well was “dry” (non commercial gas only). They had high hopes for this mega-structure in the barents sea and this is quite a big blow.
On another note, how easy is it to get Eagle Ford production up again. I would assume that any repair work on those low production wells would be more or less uneconomical?
I think that’s 0 out of 3 for the most recent Statoil high impact, frontier wildcats, they might be wishing they followed the other majors and stuck to near field, low risk wells.
Looks like Johan Sverdrup will be the last major oil field to be discovered in Norway.
More info here:
http://www.npd.no/en/news/Exploration-drilling-results/2017/743512-1/
They’re going to give it one more try next year
OSLO (Reuters) “Gas is almost impossible to commercialize in these remote areas, and if the eastern Barents Sea is gas prone, it will have limited value potential,” If more wells to be drilled in 2018 turn to be dry, then it would be really bad,” he added.
https://www.reuters.com/article/us-statoil-norway-idUSKCN1B90NH
That same comment probably applies to almost all offshore Arctic discoveries, and it’s looking more and more that they are going to be mostly dry or gas prone. The geostatic compression and relaxation through ice ages has either pushed the source rock into the gas window for long enough to destroy any oil and/or produced enough fractures to allow everything to escape from the traps. Wet gas is almost impossible to produce economically, even at much higher gas prices, given the hydrate issues, the short drilling season, the long transport distances and the need to handle ice bergs (e.g. grounding against pipelines or impact on production vessels) and sea ice (impact on evacuation methods, production vessel design, leak recovery and much more).
George Kaplan,
I’m curious about offshore Arctic “geostatic compression and relaxation through ice ages” pushing source rock into the gas window. In principle that could occur, I suppose, but specifically in the case of Alaska offshore the North Slope there was no glaciation. It was far too dry. I’d expect no such effect there.
The Barents Sea, though, might be a good candidate. It depends on the ice extent up there and I’d expect it to be significant but I have no data to hand.
Synapsid – I presume you’re familiar with this?
THE PLIO-PLEISTOCENE GLACIATION OF THE BARENTS SEA–SVALBARD REGION: A NEW MODEL BASED ON REVISED CHRONOSTRATIGRAPHY
http://www.sciencedirect.com/science/article/pii/S0277379108003508
I guess I should have said new exploration rather than discoveries, but I did say “almost all” and “offshore”. It might be relevant that the only major oil development is the place with the least disruption from the ice ages.
Don’t know if this has been posted (don’t think so from a quick search): Mexico C&C July down 176 to 2015 kbpd y-o-y (8% decline), 20 kbpd m-o-m (1%), and down 119 kbpd since October (I think they had 100 kbpd as their proportion of NOPEC cuts). They have at least one platform off line for some of the time for a turn around, so at least some of this will come back.
There is a lot of production loss in the pipeline (literally) from Harvey:
http://oilprice.com/Energy/Crude-Oil/Texas-Shale-Hit-Hard-By-Hurricane-Harvey.html
The thing of closed down pipelines and forced well shut downs can be a toxic mixture, recovery can take time.
Another thing to reduce the global oil glut in storage tanks.
“LARGEST U.S. REFINERY SHUT – The nation’s largest refinery, Valero Energy Corp’s 335,000 barrel-per-day facility in Port Arthur was shut, said sources familiar with plant operations. The storm has affected nearly one-fifth of U.S. refining capacity, sparking concerns about gasoline supply. ”
Is this not the US’s 2nd Largest Refinery? Or is the Motiva Aramco facility considered upstream?
http://news.trust.org/item/20170830095432-w8aoo
Bit early yet but Harvey damage numbers coming in at 70 Billion. Seems way low. BHP Sale losses so far approach 50 Billion?
Motiva is the biggest…
EIA map of the Texas Gulf Coast refineries (updated with 2017 capacities) and transportation fuels infrastructure
Map on Twitter: https://pbs.twimg.com/media/DIVGfrsWsAASFiZ.jpg
2 new posts
Norway
http://peakoilbarrel.com/norway-oil-and-gas-reserves-production-and-future-projection/
And also
EIA’s Electric Power Monthly
http://peakoilbarrel.com/eias-electric-power-monthly-august-2017-edition-with-data-for-june/
While I realize the refinery shutdowns should be relatively short-lived, the pricing result would benefit EVs in theory: Producers stuck with low oil prices (thus discouraging more production), while the consumer pays higher prices at the pump.