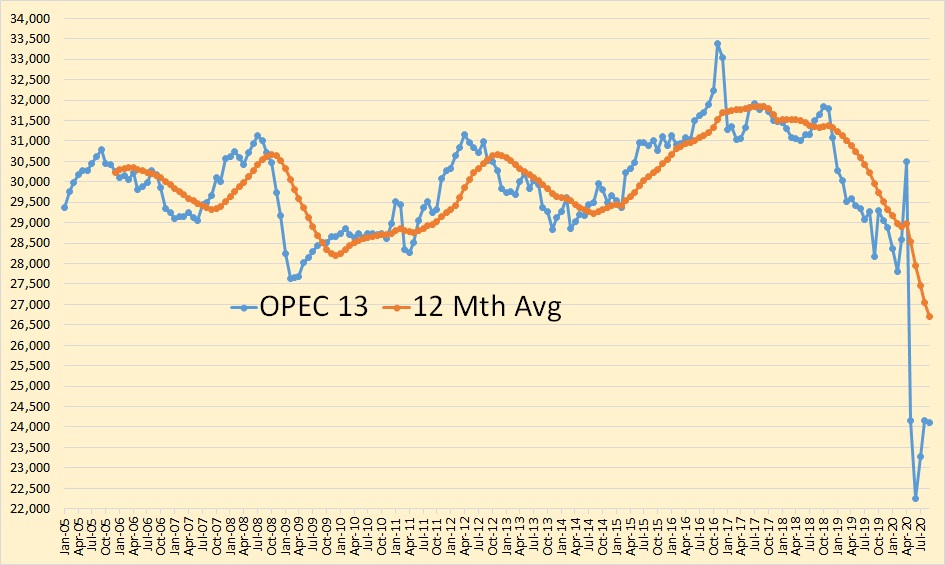
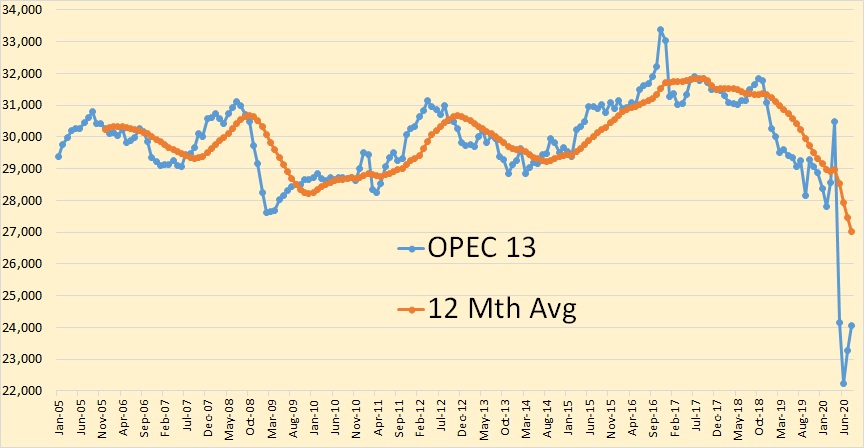
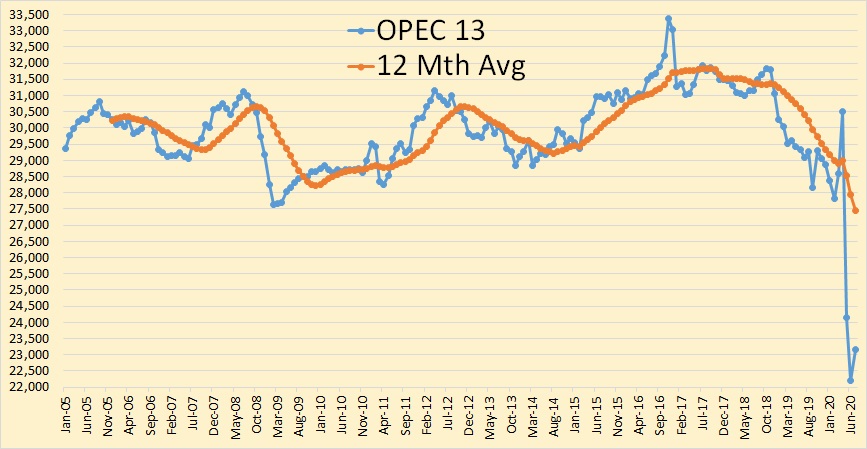
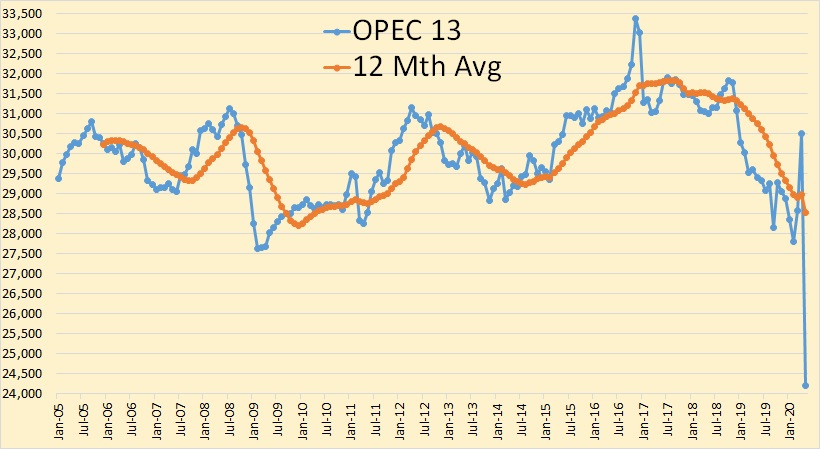
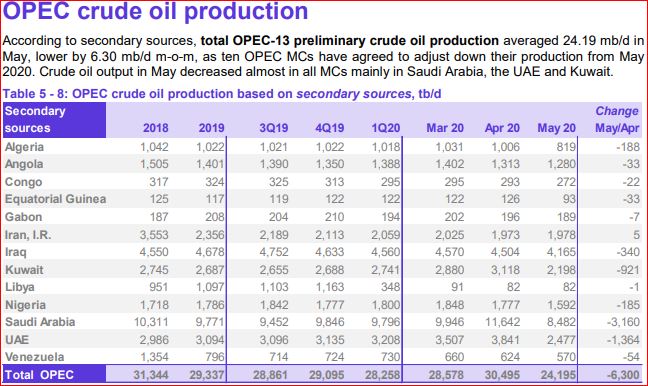
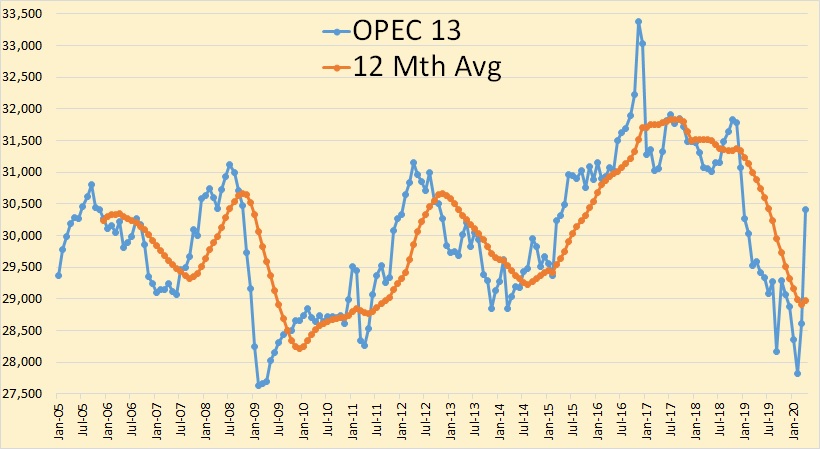
All OPEC data below is from the September OPEC Monthly Oil Market Report. The data is through August 2020 and is in thousand barrels per day.
NOTE: This new theme is screwing up the size of my charts. It seems it has a size threshold where they have to be slightly larger than my input charts to show up larger. I will have it fixed by next my next post where all the charts show up larger.
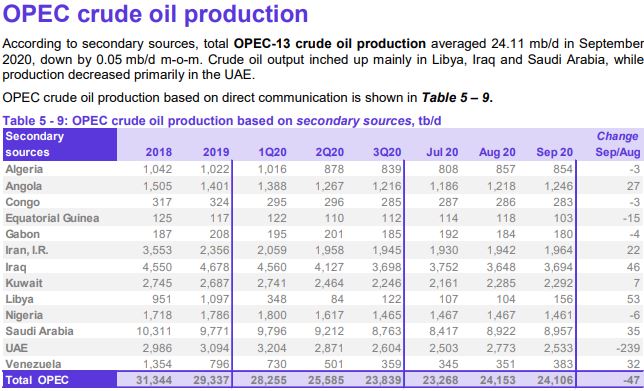
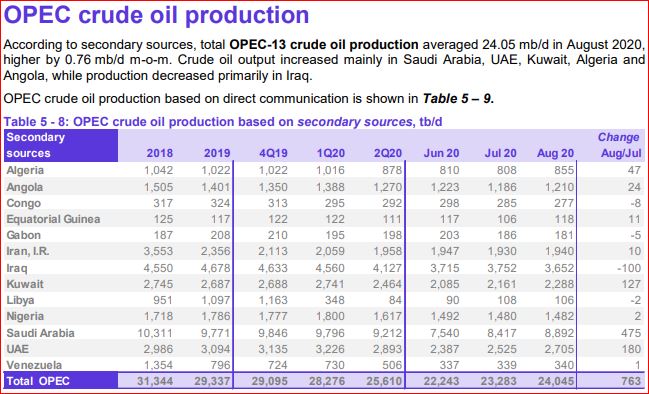
OPEC 13 crude only production was up 763,000 barrels per day in August. However, that was after June production was revised upward by 50,000 barrels per day and July production was revised upward by 110,000 barrels per day.
This is the data used in the charts below. It is basically a composite of reports by several production tracking agencies.