US February Oil Production Surprises to the Downside

A guest post by Ovi

All of the oil (C + C) production data for the US state charts comes from the EIAʼ’s Petroleum Supply monthly PSM. 

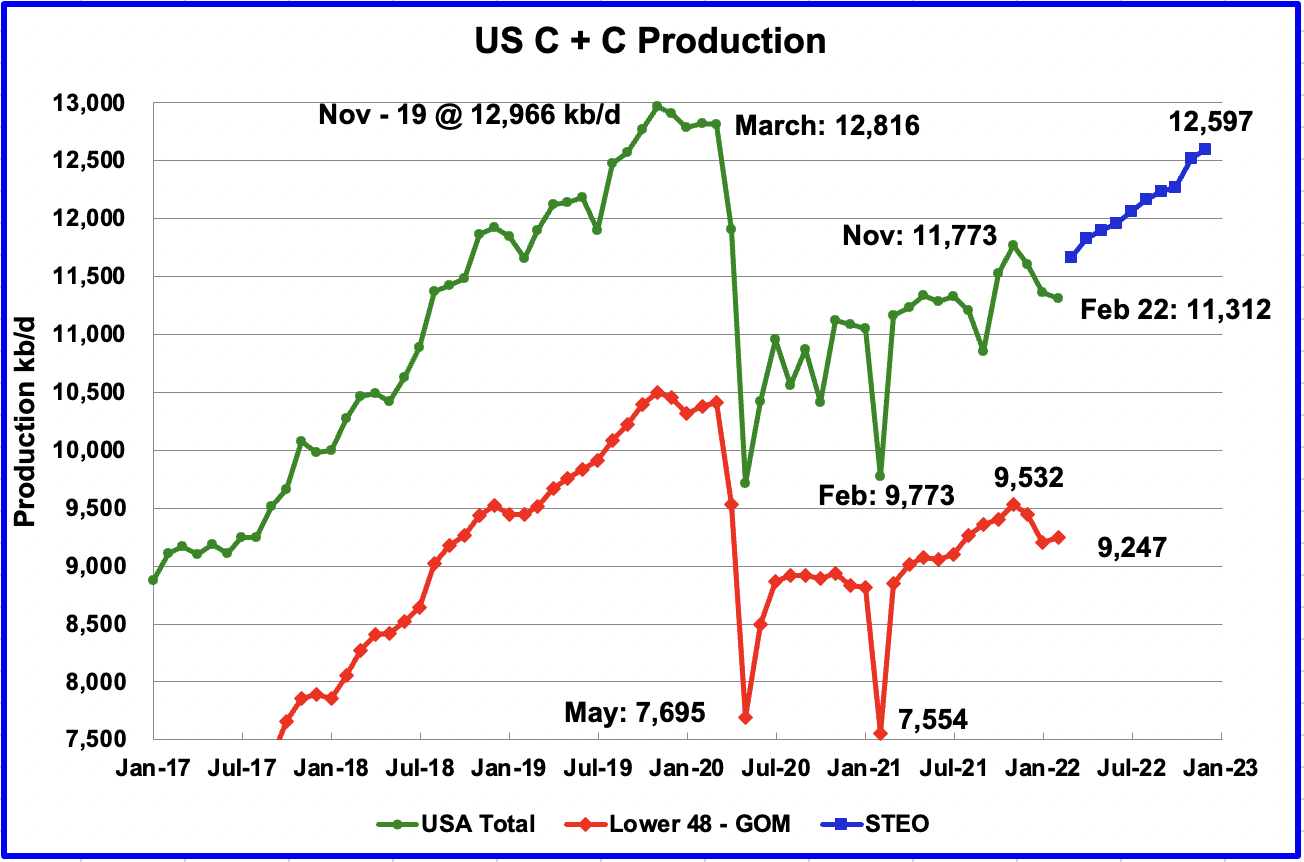
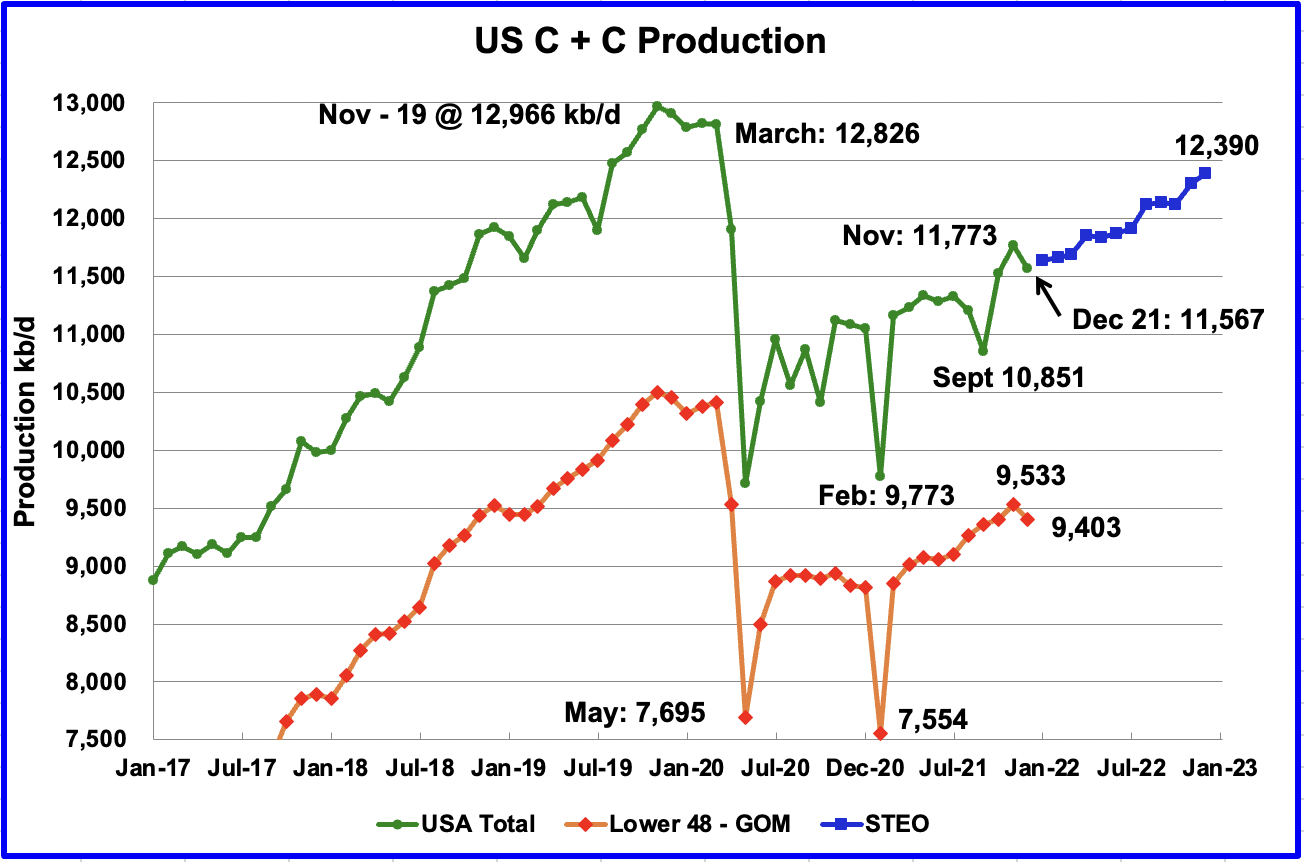
U.S. February production decreased by a surprising 50 kb/d to 11,312 kb/d. Relative to November 2021 production of 11,773 kb/d, it has dropped by 461 kb/d. The main declining states were Texas 27 kb/d and ND 23 kb/d.  The major decliner was the GOM which dropped by 93 kb/d. Of the top 3 states, only New Mexico increased its production.

Read More

November Non-OPEC Oil Production Ticks Up

A guest post by Ovi

Below are a number of oil, crude plus condensate (C + C ), production charts for Non-OPEC countries created from data provided by the EIA’s International Energy Statistics and updated to November 2021. Information from other sources such as OPEC, the STEO and country specific sites such as Russia, Brazil, Norway and China is used to provide a short term outlook for future output and direction for a few countries and the world.

Read More

September Non-OPEC Oil Production Slips

A guest post by Ovi

Below are a number of oil, crude plus condensate (C + C ), production charts for Non-OPEC countries created from data provided by the EIA’s International Energy Statistics and updated to September 2021. Information from other sources such as OPEC, the STEO and country specific sites such as Russia, Brazil, Norway and China is used to provide a short term outlook for future output and direction for a few countries and the world.

Read More