U.S. & World Oil Production and ExxonMobil Outlook

Here are the latest oil production numbers from the EIA. All data is in thousand barrels per day unless otherwise noted.

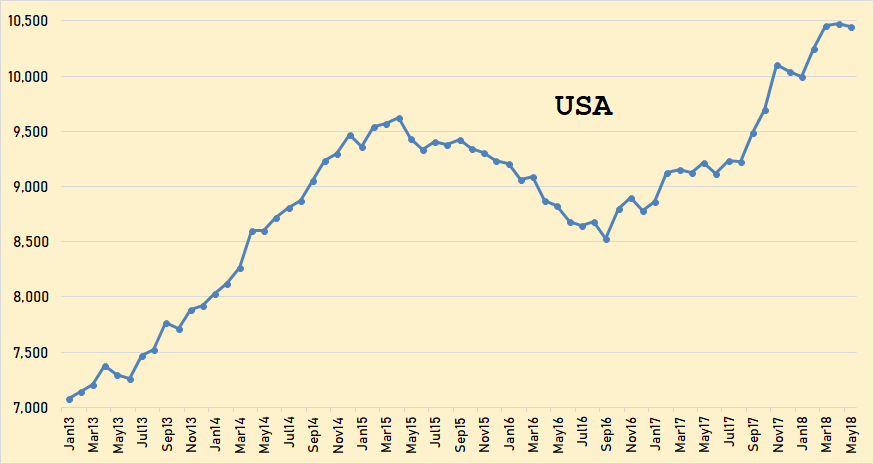
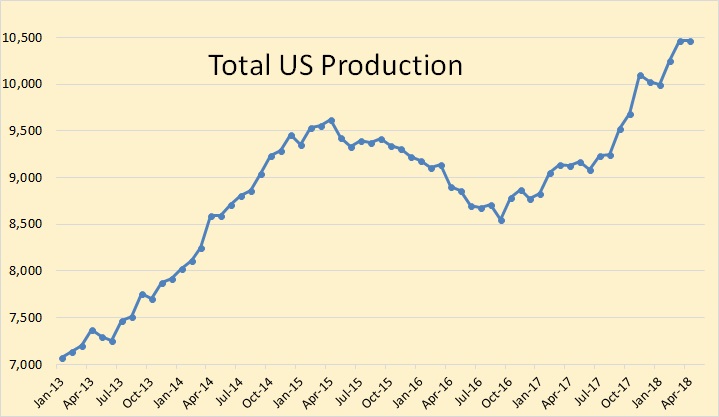
The USA through May 2018. The upward surge has stalled for the last two months. US production was down 30,000 bpd in May.

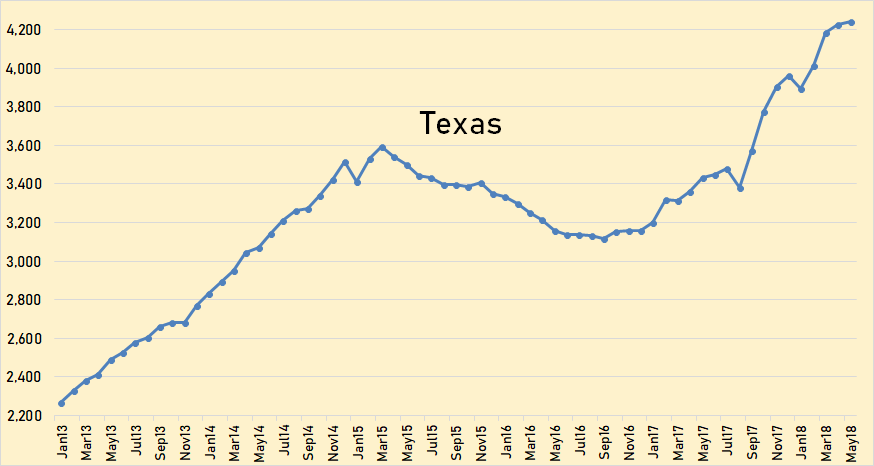
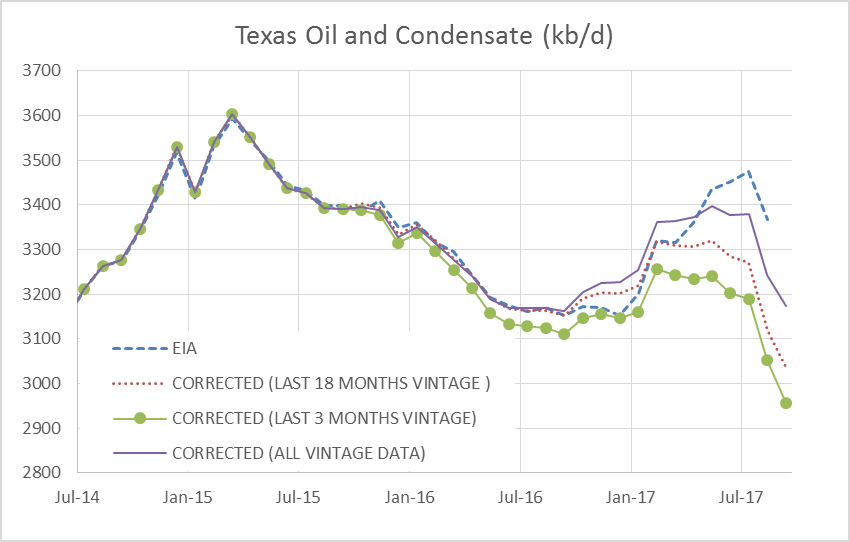
It is a little astonishing how close the Texas chart resembles the USA chart. Texas is, by far, the USA’s largest producer. As Texas goes, so goes the USA. Texas production was up 20,000 bpd in May.

Read More

Texas Update- November 2017

Dean Fantazzini has provided his latest estimates of Texas oil and natural gas output.

His analysis is based on RRC data only. Each RRC data set from Jan 2014 to Sept 2017 for crude and from April 2014 to Sept 2017 for condensate and natural gas are used in the “all data” estimate, the most recent 49 months of data are collected for each individual data set. After March 2016 there was a shift in the data for crude and condensate so for the C+C estimate, I include an estimate which uses all data from April 2016 to the most recent data point (“Corrected 18 month vintage”). Dean prefers to present an “all vintage data” estimate and an estimate using only the most recent 3 months “correction factors”. For Sept 2017 the all vintage data estimate is 3174 kb/d, the last 3 month vintage estimate is 2957 kb/d, and the last 18 month vintage estimate is 3039 kb/d with falls of 68, 96, and 80 kb/d respectively from the previous month.

chart/

Read More

Texas Update, May 2017

chart/

The Chart above compares several different combinations of past (vintage) data to estimate output. The dotted line is based on the most recent 8 months (August 2016 to March 2017) of data saved from the RRC website, the blue solid line is based on the past 12 months of data, and the yellow line is based on the most recent 3 months of data. Read More