October World Oil Production Continues to Rebound

By Ovi

Below are a number of Crude plus Condensate (C + C) production charts, usually shortened to “oil”, for oil producing countries. The charts are created from data provided by the EIA’s International Energy Statistics and are updated to October 2023. This is the latest and most detailed/complete World Oil production information available. Information from other sources such as OPEC, the STEO and country specific sites such as Brazil, Norway and China is used to provide a short term outlook 

World Oil Production and Projection

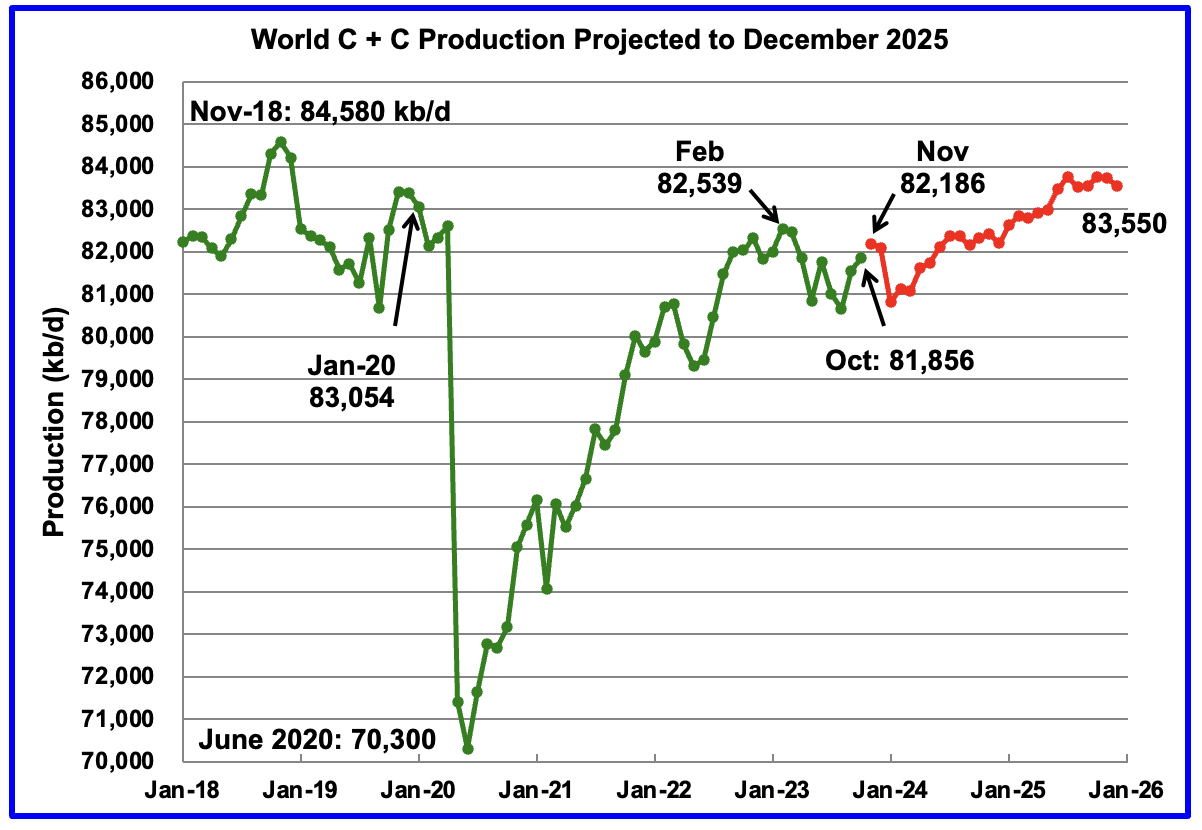
World oil production increased by 302 kb/d in October, green graph. The largest increase came from Canada and Kazakhstan with both adding 123 kb/d each.

Read More

August Non-OPEC and World Oil Production

By Ovi

The EIA International Energy Statistics had a reporting hiatus from its May 2023 report to July 2023. They have restarted their reports with the August update. This report updates the POB reports and charts posted for May, June and July.

Below are a number of Crude plus Condensate (C + C) production charts, usually shortened to “oil”, for Non-OPEC countries. The charts are created from data provided by the EIA’s International Energy Statistics and are updated to August 2023. This is the latest and most detailed world oil production information available. Information from other sources such as OPEC, the STEO and country specific sites such as Russia, Brazil, Norway and China is used to provide a short term outlook for future output and direction for a few of these countries and the world.

World oil production and projection charts are presented at the end of this post.

August Non-OPEC oil production dropped by 71 kb/d to 51,401 kb/d. The largest decreases came from Kazakhstan, Brazil and Russia.

Read More

November Non-OPEC Oil Production Ticks Up

A guest post by Ovi

Below are a number of oil, crude plus condensate (C + C ), production charts for Non-OPEC countries created from data provided by the EIA’s International Energy Statistics and updated to November 2021. Information from other sources such as OPEC, the STEO and country specific sites such as Russia, Brazil, Norway and China is used to provide a short term outlook for future output and direction for a few countries and the world.

Read More

July Non-OPEC Oil Output Adds to World Supply

A guest post by Ovi

Below are a number of oil (C + C ) production charts for Non-OPEC countries created from data provided by the EIA’s International Energy Statistics and updated to July 2021. Information from other sources such as OPEC, the STEO and country specific sites such as Russia, Norway and China is used to provide a short term outlook for future output and direction for a few countries and the world.

Read More

October Non-OPEC Oil Production Resumed Climb

A post by Ovi at peakoilbarrel

Below are a number of oil (C + C ) production charts for Non-OPEC countries created from data provided by the EIAʼs International Energy Statistics and updated to October 2020. Information from other sources such as OPEC, the STEO and country specific sites such as Russia and Norway is used to provide a short term outlook for future output and direction for a few countries and the world.

Note. I have just been informed that the EIA published their November report early. Normally they post the update at the end of the month. I will update this post ASAP and publish a November one. Sorry

Read More