OPEC July Production Data

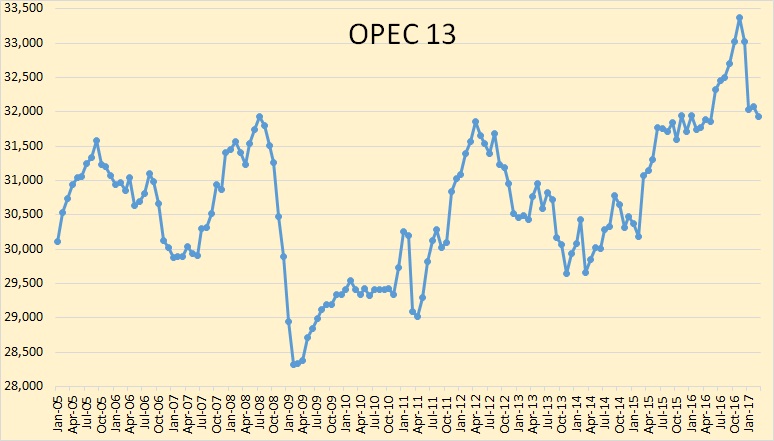
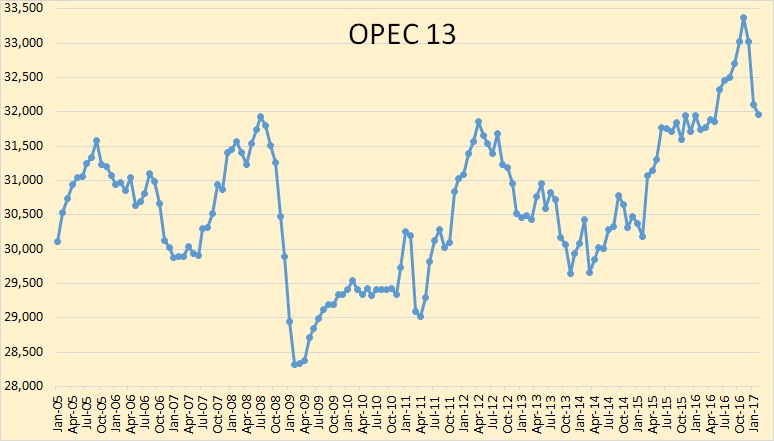
All data below is based on the latest OPEC Monthly Oil Market Report.

All data is through July 2017 and is in thousand barrels per day.

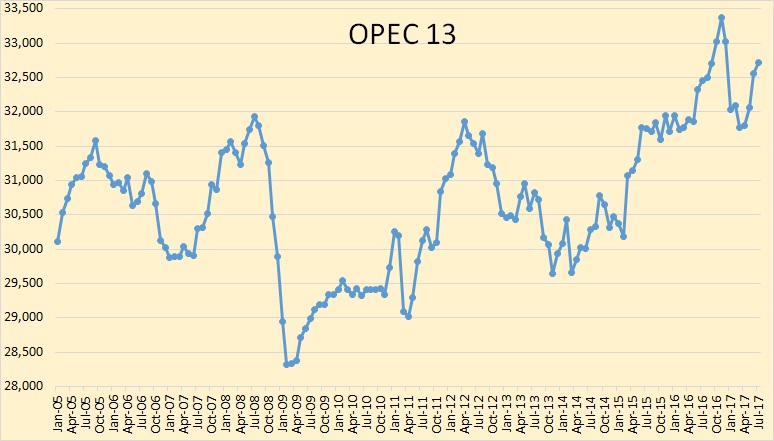
The above chart does not include the 14th member of OPEC that was just added, Equatorial Guinea. I do not have historical data for Equatorial Guinea so I may not add them at all. It doesn’t really matter since they are only a very minor producer. Also they are in steep decline, dropping at about 10% per year.

The huge June OPEC production increased was due to a revision, explained below.

Read More

OPEC March Crude Oil Data

The OPEC Monthly Oil Market Report is out with OPEC’s crude oil production numbers for March 2017.

All data is through March 2017 and is in thousand barrels per day.

Looking at the above chart it seems obvious what most OPEC nations were doing. They announced in the summer of 2016 that there would likely be quota cuts beginning in 2017. And those cuts would be a percentage of their current production. So everyone began making heroic attempts to increase production by the end of 2016. So now, after everyone who felt that they should cut, has cut, they are right back to the level that they were at before the cuts were proposed.

Read More

OPEC February Production

The new January OPEC Monthly Oil Market Report is out with crude only production numbers for February 2017. All charts are in thousand barrels per day.

All data below is in thousand barrels per day and is through February 2017.

OPEC crude oil production dropped to 31,958,000 bpd in January. That was a drop of 140,000 bpd. In January OPEC production dropped 930,000 bpd for a two month total of 1,070,000 bpd.

Officially OPEC agreed to cut production by 1.2 million barrels per day beginning in January. So they are getting close.

OPEC’s November production of 33,374,000 represented an all time high for the Cartel.

Read More

OPEC Declines in February Despite Huge Iran Increase

All charts are through February 2016

The OPEC Monthly Oil Market Report just came out. The charts are “Crude Only” production and do not reflect condensate production.

Also the charts, except for Libya, are not zero based. I chose to amplify the change rather than the total. OPEC is now 13 nations with the the addition of Indonesia.

All Data is in thousand barrels per day.

OPEC 13

OPEC production was down 174,800 barrels per day in February Read More

A Closer Look at OPEC

Taking a closer look at OPEC. All OPEC and price data below is through December. All production data is in thousand barrels per day.

Iran and Libya have had serious political disruptions in their production numbers. Simply adding them to the OPEC numbers distorts the picture. To try to figure out what has been happening to OPEC we need to look at OPEC without Iran and Libya.

OPEC Less Iran and Libya

Here is OPEC less Iran and Libya, or the OPEC 10 if you will. I have marked August 2012 as what I call the “Price Peak”. Not the peak in oil prices but the production peak that was brought about by the increase in the price of oil. That price increase began in early 2009 and by March 2011 was well above $100 a barrel. And the price of oil did not drop below $100 a barrel until late August 2014.

Read More