Texas Oil and Gas Production for April

The preliminary Texas RRC Production Data is out this morning. There appears to be a considerable drop in Texas crude oil production in April. All Texas RRC data in the charts below is through April 2015 and all EIA data is through March 2015.

For those new to this site, the Texas RRC data is incomplete. The drooping lines will eventually, after the final data comes in, closer resemble the EIA data. Though I believe the EIA data is quite a bit too high at this point.

Texas C+C

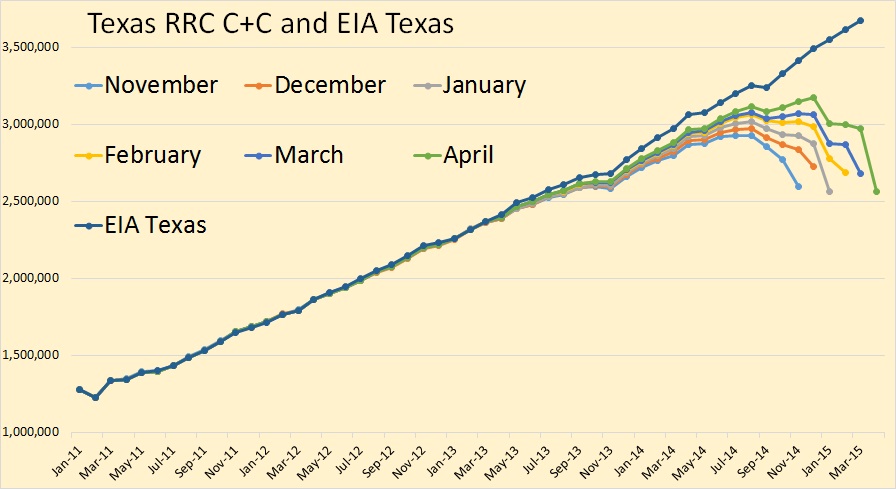
It appears that, when the final data comes in that Texas will have took a huge hit in January, recovered somewhat in February and March, then took another hit this past April.

Read More

Bakken, What Is The Data Telling Us?

North Dakota publishes, every month, a Monthly Statistical Update from which we can gather a wealth of data if we dig deep enough. They publish the number of spuds, that in new wells started, each month, along with the average number of rigs that month. From this we can glean the average number of days each rigs spends on each well.

Spuds per Rig

The last data point is March, 2015. Through 2011 a rig could drill about .75 wells per month, or about 40 days spud to spud. Today that figure is about 1.14 wells per month or about 26.3 days spud to spud.

Permits & Spuds

Again, the data is through March. We can see the falloff of spuds, rigs and permits in February and March. April and May should show a further decline in all three.

Read More

US Individual States Production, Bakken Area and GOM

The EIA’s Petroleum Supply Monthly has been published with production data for all individual states and offshore areas.  All data is Crude + Condensate and in thousand barrels per day with the last data point March 2014.

Mont+ND


Since the Bakken occupies part of two states, North Dakota and Montana, I have combined their production in order to get a better idea of what is really happening there. I have drawn a trend line from July 2011 through October 2012. That shows where production might have been if the fast decline rate and bad weather had not caught up with the. Production was 1,050,000 barrels per day in March, still 5,000 barrels per day below the point reached in November.

ND and Montana Change

I wanted to show this chart so we could get a better idea what is really going on in the entire Bakken area. Back in May and June of 2012 production was increasing by an average of 23,500 barrels every month. Now production is increasing by an average of 15,580 barrels per month.
Read More