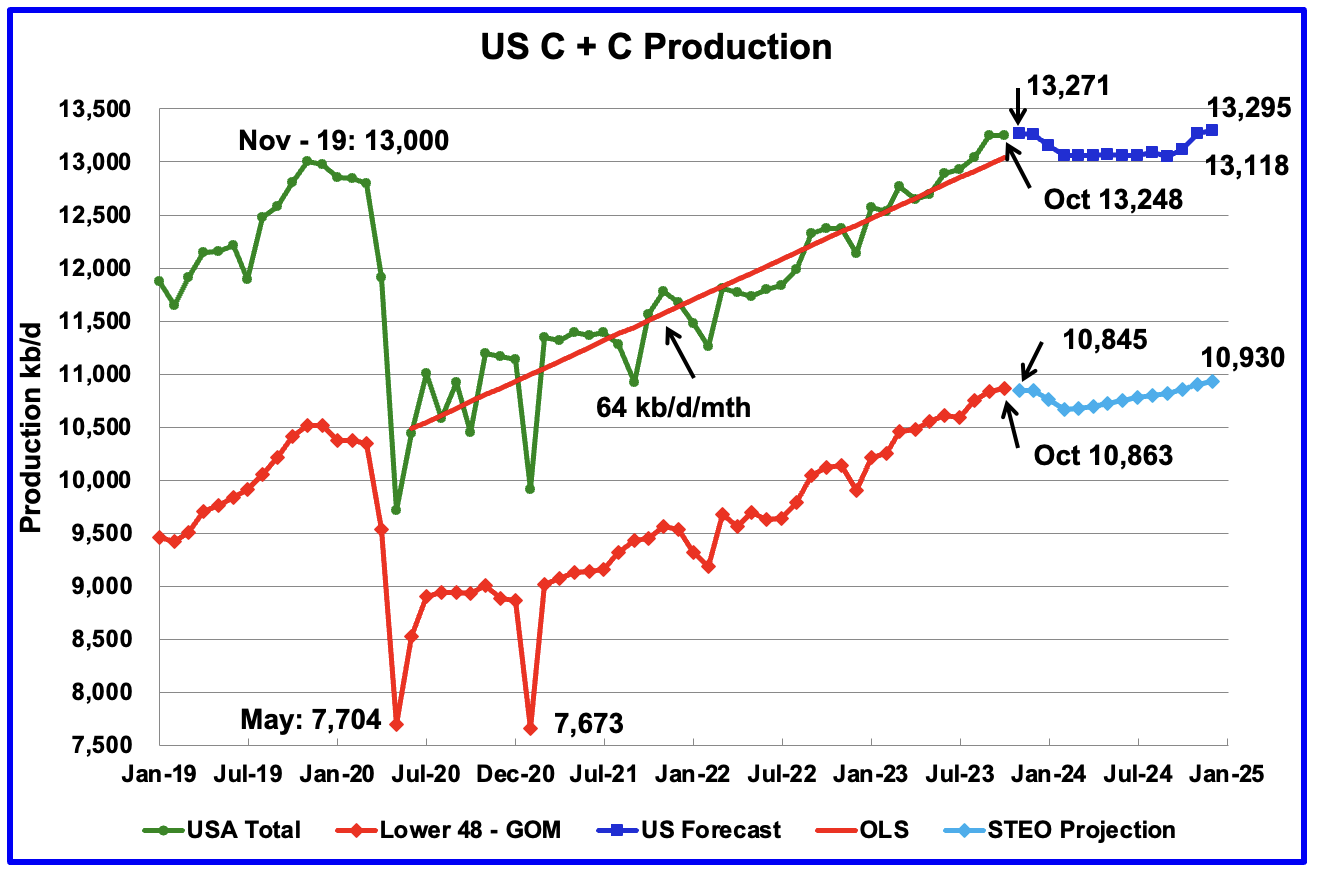
All of the Crude plus Condensate (C + C) production data for the US state charts comes from the EIAʼs Petroleum Supply monthly PSM which provides updated information up to October 2023.
U.S. October oil production decreased by 4 kb/d to 13,248 kb/d. The decrease was primarily due to decreases in the GOM and North Dakota being partially offset by increases in Texas and New Mexico. Note that September production was revised up from 13,236 kb/d to 13,252 kb/d.
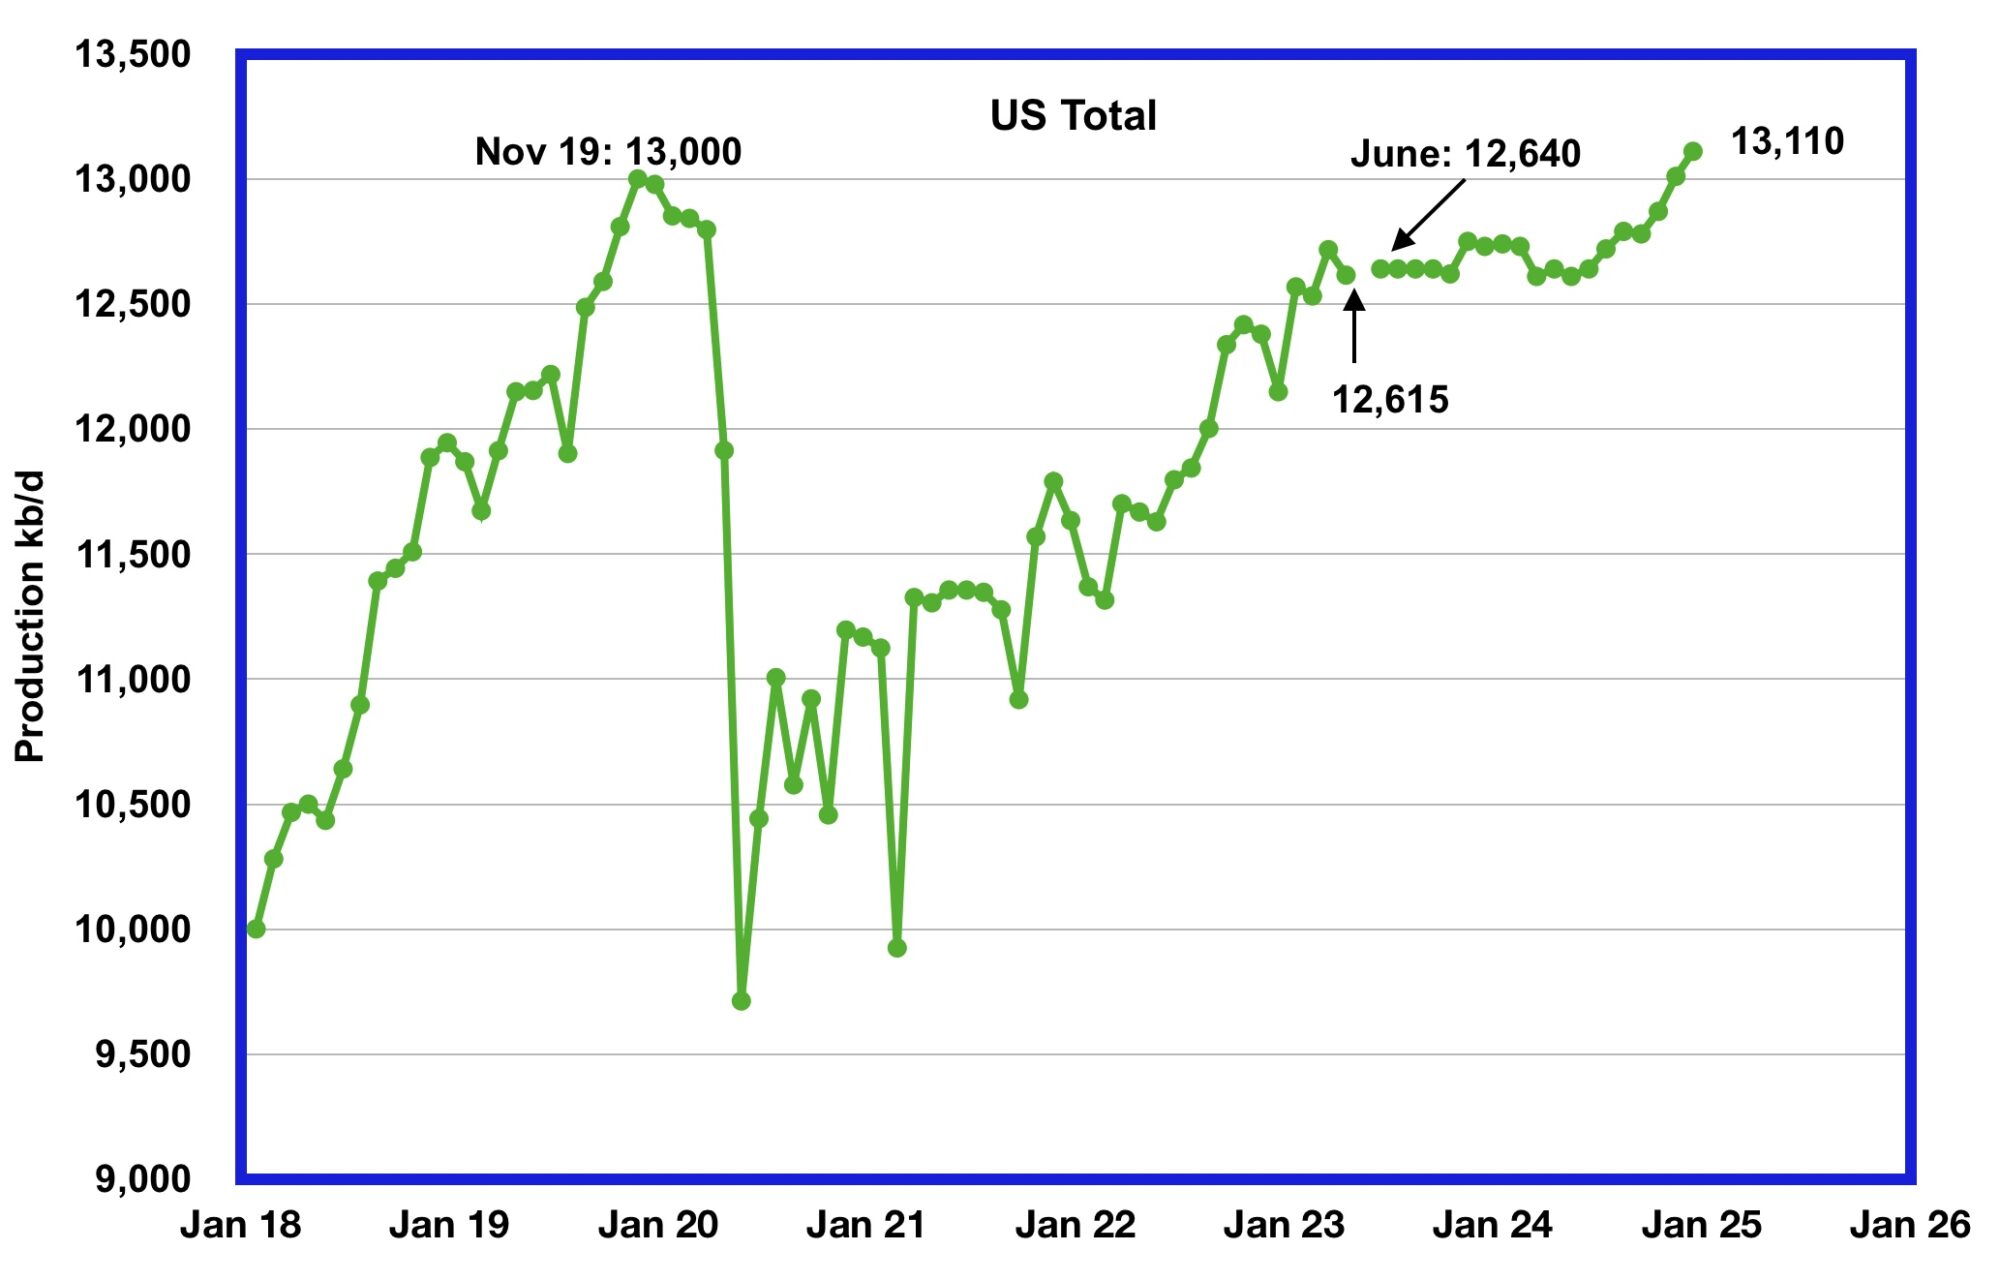
All of the Crude plus Condensate (C + C) production data for the US state charts comes from the EIAʼs Petroleum Supply monthly PSM which provides updated information up to April 2023.
U.S. April oil production decreased by 102 kb/d to 12,615 kb/d, a drop from last month’s post pandemic high of 12,717 kb/d. Note that March’s output was revised up by 21 kb/d from 12,696 to 12,717 kb/d.
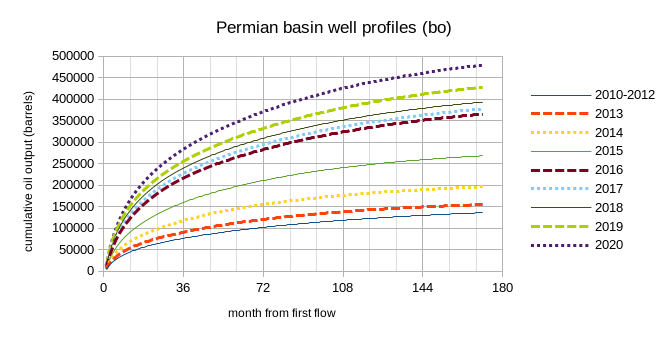
Much of the information for this post comes from data at shaleprofile , and assessments by the USGS. In addition a paper published in Jan 2022 by Wardana Saputra et al was an excellent resource.
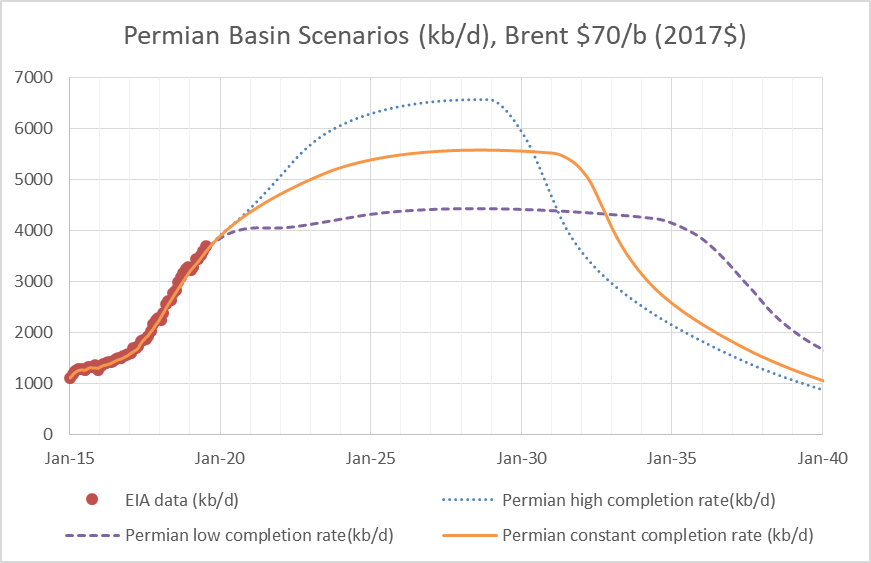
The basic method used in the is analysis is covered in an earlier post, essentially the convolution of average well profiles with the monthly completion rate over time is used to model future output. I focus on the period starting in Jan 2010 and consider only horizontal tight oil wells in the analysis. Future well profiles are estimated and several future scenarios for completion rate are used, clearly the future is unknown so future completion rates and estimated ultimate recovery (EUR) for wells completed in the future can only be guessed at.
In order to make such a guess I start with the USGS assessments for the Permian basin where the mean estimate for prospective net acres as of mid 2017 was about 50 million acres. I use an estimate for average acres per well of 300 acres (about 9500 feet lateral length with spacing of 1320 feet between laterals) which gives an estimate of about 167 thousand wells. There were about 14 thousand wells already completed in the Permian basin by June 2017 so total completions would be about 181 thousand wells, if oil prices were high enough to make every potential well location profitable. Using the mean UTRR estimate (70 Gb) and number of potential drilling locations (about 160 thousand as of Dec 21, 2021 based on the data at shale profile where about 21 thousand wells were completed from July 2017 to Dec 2021), I find and estimate for the future decrease in EUR per well that will result in a UTRR of 70 Gb if all potential wells were completed.
After that step a discounted cash flow analysis using guesses of future costs and prices is used to determine whether a well will be profitable to complete to arrive at an ERR for a given scenario, typically ERR is less than TRR, but in rare high oil price scenarios they could be nearly equal.
Average well profiles have been developed by fitting an Arps hyperbolic function to the data from shaleprofile.com for the average 2010 to 2012 well and then for each individual year from 2013 to 2020. In my scenarios I assume EUR starts to decrease after Dec 2020 and assume no further increase in lateral length or change in average well spacing.
In the discussion here I use the term net volume to refer to
the volume of prospective rock that might be developed to produce tight
oil. For each bench of a prospective
tight oil play (Wolfcamp A would be one example of a bench) there is an area
estimate (5733 thousand acres for Wolfcamp A of Delaware) and a success ratio
(%) = 94.7, in the case of Wolfcamp A.
Net acres are the total acres times the success ratio, for Wolfcamp A,
5429 thousand net acres. On average the
Wolfcamp A of the Delaware basin is about 400 feet thick, so the net volume
would be net acres times thickness or 2172 million acre-feet. An acre-foot is a volume that is one acre
(44,000 square feet) by one foot thick or 44,000 cubic feet (or a box that is
1000 ft long by 44 feet wide by 1 foot high.)
Seems we don’t know what future completion rates will be in the Permian basin or anywhere. There are many different opinions on whether the completion rate might increase, decrease or stay the same. In my view, the conservative assumption is to assume they will not go up or down, but that the completion rate will remain constant. I have created three different scenarios: in the first, the completion rate increases; in the second, the completion rate decreases; the third scenario has a constant completion rate.