Non-OPEC’s December Oil Production Drops

A guest post by Ovi

Below are a number of Crude plus Condensate (C + C) production charts, usually shortened to “oil”, for Non-OPEC countries. The charts are created from data provided by the EIA’s International Energy Statistics and are updated to December 2022. This is the latest and most detailed world oil production information available. Information from other sources such as OPEC, the STEO and country specific sites such as Russia, Brazil, Norway and China is used to provide a short term outlook for future output and direction for a few of these countries and the world. The US report has an expanded view beyond production by adding rig and frac spread charts.

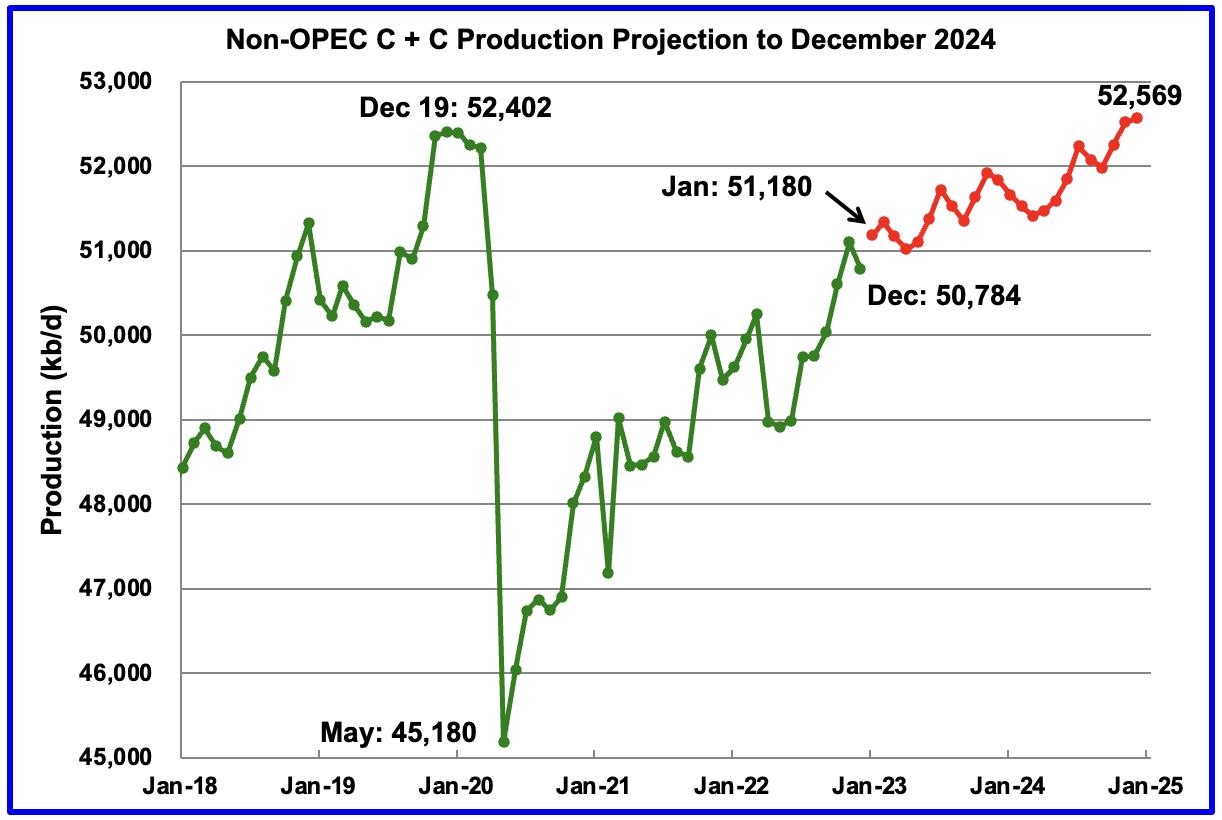
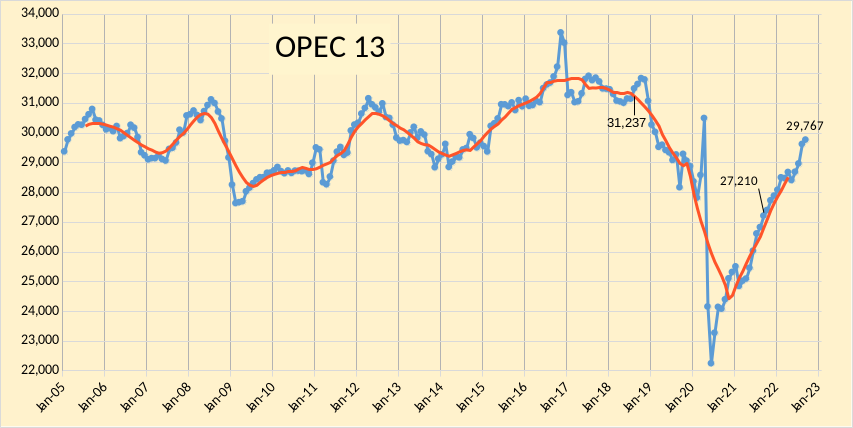
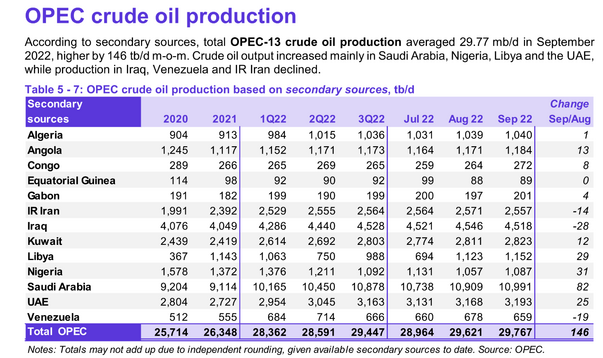
December Non-OPEC oil production decreased by 317 kb/d to 50,784 kb/d. The largest decrease came from the US, 276 kb/d.

Read More

Short Term Energy Outlook, February 2023

The Short Term Energy Outlook (STEO) was published by the US Energy Information Administration (EIA) on February 7, 2023. For most nations except the US and total OPEC crude oil output the forecast for future production is for total liquids only. In this month’s post I will try to estimate the crude plus condensate (C+C) output indicated by the STEO total liquids estimate for the top 10 non-OPEC producers and the World minus the top 10 non-OPEC producers. I will focus on quarterly output so that we can compare with recent OPEC estimates for World supply and demand in 2023. The estimate for C+C uses historical output of both C+C and total liquids and uses the average of the ratio of C+C to total liquids for the past 12 quarters (2019Q4 to 2022Q3) for the top 10 non-OPEC producers (except the US where a C+C forecast is provided) and for the World minus the top 10 non-OPEC producers. In most of the charts that follow the units on the vertical axis are kb/d of C+C output.

Figure 1
Read More

US EIA Short Term Energy Outlook, Jan 2023

The US EIA Short Term Energy Outlook (STEO) was published on January 10, 2023. This report generally provides forecasts for Total Liquids production for non-OPEC nations, crude only output for OPEC nations, and both C+C and Total Liquids forecasts for the US. At Peak Oil Barrel we focus on crude plus condensate (C+C) output as this is the critical input that provides most of the World’s liquid fuels used for land, air and water transportation. The STEO also provides forecasts for natural gas and electricity output as well as price forecasts for oil, natural gas, and electricity. This post will focus on oil (both total liquids and C+C).

We find the OLS trend in the ratio of C+C divided by total liquids for non-OPEC minus the US over the period from October 2014 to September 2022 (it has been decreasing at an annual rate of 0.267% over that period) and we assume the trend continues from October 2022 to December 2024 (the end of the STEO forecast). This allows us to estimate non-OPEC minus US C+C. Likewise we find the ratio of OPEC crude to C+C which was relatively flat at about 93.7% from Jan 2010 to December 2019 and seems to be returning to this level since the depths of the pandemic. By assuming the ratio is 93.7% crude to C+C for OPEC we can estimate OPEC C+C from October 2022 to December 2022 using the STEO crude only estimate. The non-OPEC minus US C+C estimate is added to the STEO US C+C estimate and this is combined with the OPEC C+C estimate to find the World C+C STEO forecast.

Figure 1
Read More

OPEC Update, November 17, 2022

The OPEC Monthly Oil Market Report (MOMR) for November 2022 was published recently. The last month reported in most of the OPEC charts that follow is October 2022 and output reported for OPEC nations is crude oil output in thousands of barrels per day (kb/d). In most of the OPEC charts that follow the blue line is monthly output and the red line is the centered twelve month average (CTMA) output.  I also show a number of charts from the recent World Energy Outlook 2022, published by the IEA in October. I focus on a selection of charts from Chapter 7 of that report which covers oil.

Figure 1
Figure 2
Read More

OPEC Update, October 2022

The OPEC Monthly Oil Market Report (MOMR) for October 2022 was published recently. The last month reported in most of the OPEC charts that follow is September 2022 and output reported for OPEC nations is crude oil output in thousands of barrels per day (kb/d). In most of the OPEC charts that follow the blue line is monthly output and the red line is the centered twelve month average (CTMA) output.  Note however there are a few exceptions to this for OPEC+ charts near the end of the post where EIA C+C data was used which has the most recent data from June 2022 (so three months behind the OPEC crude only data in most of the charts that follow.)

Figure 1
Figure 2
Read More