August Non-OPEC and World Oil Production

By Ovi

The EIA International Energy Statistics had a reporting hiatus from its May 2023 report to July 2023. They have restarted their reports with the August update. This report updates the POB reports and charts posted for May, June and July.

Below are a number of Crude plus Condensate (C + C) production charts, usually shortened to “oil”, for Non-OPEC countries. The charts are created from data provided by the EIA’s International Energy Statistics and are updated to August 2023. This is the latest and most detailed world oil production information available. Information from other sources such as OPEC, the STEO and country specific sites such as Russia, Brazil, Norway and China is used to provide a short term outlook for future output and direction for a few of these countries and the world.

World oil production and projection charts are presented at the end of this post.

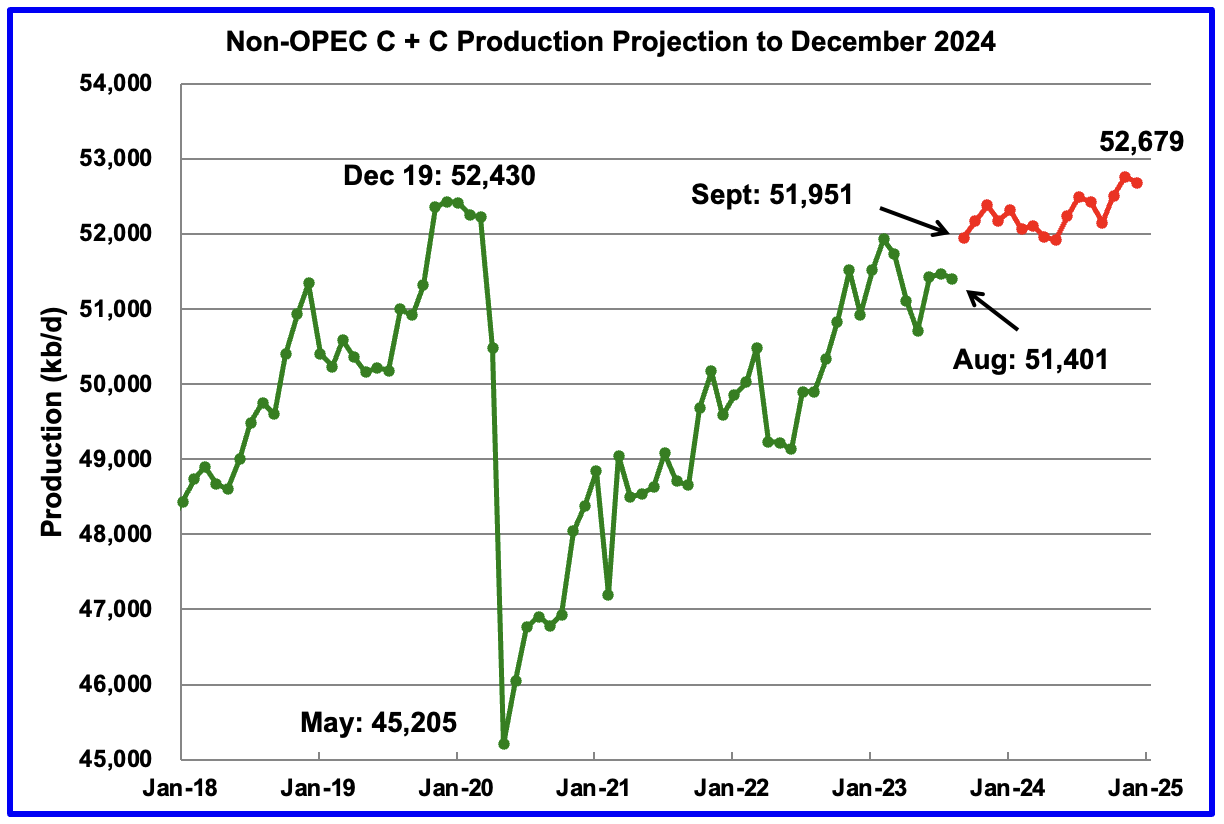
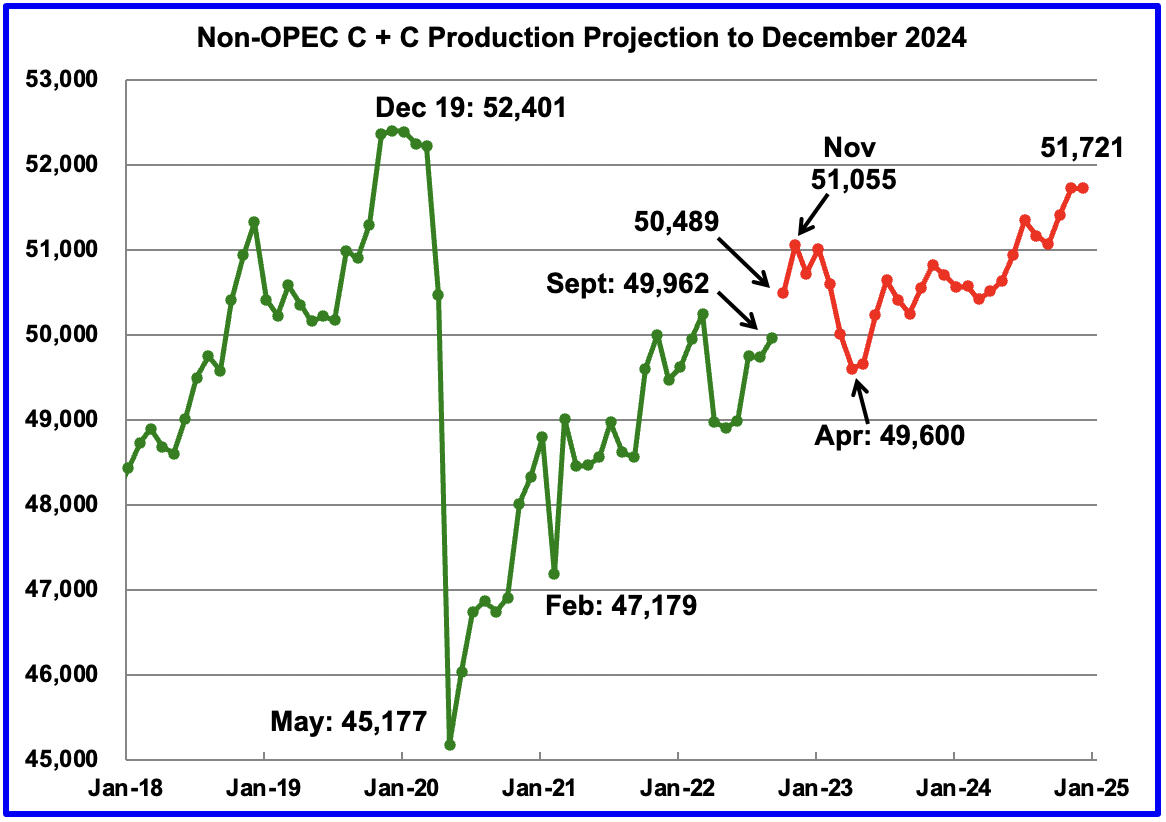
August Non-OPEC oil production dropped by 71 kb/d to 51,401 kb/d. The largest decreases came from Kazakhstan, Brazil and Russia.

Read More

May Non-OPEC and World Oil Production

By Ovi

Below are a number of Crude plus Condensate (C + C) production charts, usually shortened to “oil”, for Non-OPEC countries. The charts are created from data provided by the EIA’s International Energy Statistics and are updated to May 2023. This is the latest and most detailed world oil production information available. Information from other sources such as OPEC, the STEO and country specific sites such as Russia, Brazil, Norway and China is used to provide a short term outlook for future output and direction for a few of these countries and the world. The US report has an expanded view beyond production by adding rig and frac spread charts.

Where STEO data was used, the ratio of C + C to All Liquids was calculated. The average for the last eight months was used to project the June and July production numbers in a few cases.

World oil production and projection charts are presented at the end of this post.

May Non-OPEC oil production dropped by 412 kb/d to 50,010 kb/d. The largest decreases came from Canada 118 kb/d and Russia 193 kb/d.

Read More

March 2023 Non-OPEC Oil Production Drops

A post by Ovi

Below are a number of Crude plus Condensate (C + C) production charts, usually shortened to “oil”, for Non-OPEC countries. Normally the charts are created from data provided by the EIA’s International Energy Statistics in the first week of the month. Unfortunately the EIA was not able to update the production information for March until today. Consequently the charts below are produced from a mixture of country specific sites such as Brazil, Norway and China and the July STEO and the International report. The International report was used to update the March production data.

Where STEO data was used, the ratio of C + C to All Liquids was calculated. The average from the last six months was used to project the March production numbers and extended to May in a few cases.

World oil production charts are found at the end of this post.

March Non-OPEC oil production dropped by 268 kb/d to 51,434 kb/d. The largest decreases came from the Russia, 300 kb/d and Brazil 146 kb/d.

Read More

Non-OPEC’s December Oil Production Drops

A guest post by Ovi

Below are a number of Crude plus Condensate (C + C) production charts, usually shortened to “oil”, for Non-OPEC countries. The charts are created from data provided by the EIA’s International Energy Statistics and are updated to December 2022. This is the latest and most detailed world oil production information available. Information from other sources such as OPEC, the STEO and country specific sites such as Russia, Brazil, Norway and China is used to provide a short term outlook for future output and direction for a few of these countries and the world. The US report has an expanded view beyond production by adding rig and frac spread charts.

December Non-OPEC oil production decreased by 317 kb/d to 50,784 kb/d. The largest decrease came from the US, 276 kb/d.

Read More

All September Non-OPEC Oil Production Increase from US

A Guest Post by Ovi

Below are a number of Crude plus Condensate (C + C) production charts, usually shortened to “oil”, for Non-OPEC countries. The charts are created from data provided by the EIA’s International Energy Statistics and are updated to September 2022. This is the latest and most detailed world oil production information available. Information from other sources such as OPEC, the STEO and country specific sites such as Russia, Brazil, Norway and China is used to provide a short term outlook for future output and direction for a few countries and the world. The US report has an expanded view beyond production by adding rig and frac charts.

September Non-OPEC oil production increased by 229 kb/d to 49,962 kb/d. All of the increase came from the US, 289 kb/d. The largest offsetting decrease came from Norway 144 kb/d. Note that August output was revised down from 49,879 to 49,733 kb/d. This means that the September increase relative to the original August estimate is 83 kb/d.

October is expected to add 527 kb/d. This appears to be optimistic based on a few country charts below which project October production. Brazil +97 kb/d, Canada -600 kb/d, Kazakhstan +235 kb/d, Norway +100 kb/d and Russia +124 kb/d for a net of -44 kb/d. Maybe the EIA is not aware of the Canadian drop in October. The positive increments add 556 kb/d.

Read More