Open Thread

The EIA has released their Petroleum Supply Monthly with September production numbers for states and total US. It was pretty much a non event. So I am just releasing this post as an open thread.

Petroleum Supply Monthly

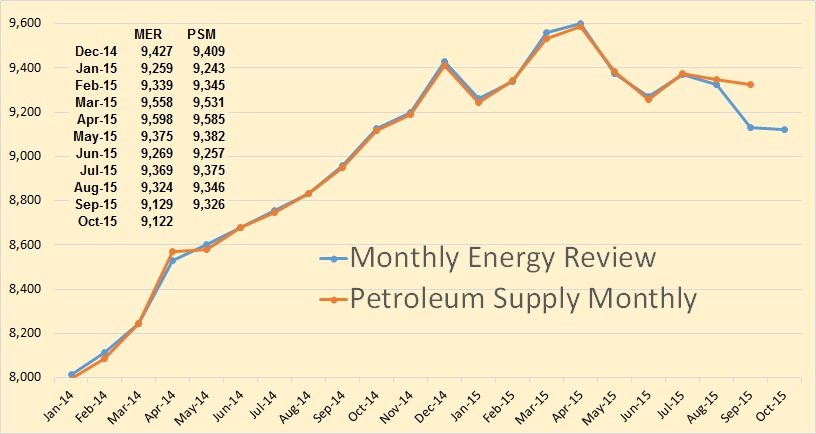
The Petroleum Supply Monthly has US production down 20,000 bpd in September. The EIA’s Monthly Energy Review which came out a few days ago with data through October, has US Production down 195,000 bpd in September and down 7,000 bpd in October.

Read More

US Oil Production Nears Previous Peak

The EIA’s Monthly Energy Review came out a couple of days ago. The data is in thousand barrels per day and the last data point is July 2015.

Consumption

US consumption of total liquids, or as the EIA calls it, petroleum products supplied, reached 20,000,000 barrels per day for the first time since February of 2008.

Something I never noticed before, consumption started to drop in January 2008, seven months before the price, along with world production, started to drop in August 2008. This had to be a price driven decline. Could the current June and July increase in consumption be price driven also?

Read More

Texas Oil and Gas Production for April

The preliminary Texas RRC Production Data is out this morning. There appears to be a considerable drop in Texas crude oil production in April. All Texas RRC data in the charts below is through April 2015 and all EIA data is through March 2015.

For those new to this site, the Texas RRC data is incomplete. The drooping lines will eventually, after the final data comes in, closer resemble the EIA data. Though I believe the EIA data is quite a bit too high at this point.

Texas C+C

It appears that, when the final data comes in that Texas will have took a huge hit in January, recovered somewhat in February and March, then took another hit this past April.

Read More