A post by Ovi at peakoilbarrel.
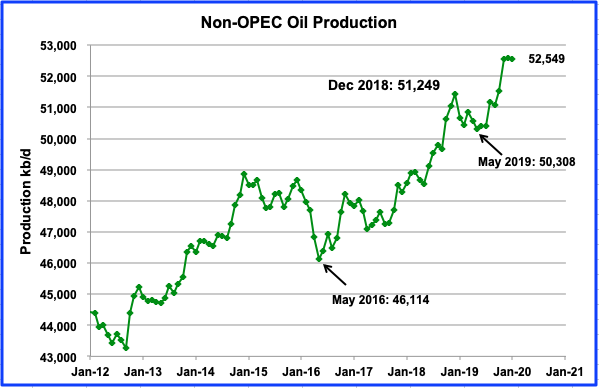
While this post updates Non-OPEC production to January 2020, we are now in late May and the direction for future production for the next few years is clear, LOWER than where it was in March 2020. OPEC, in response to the reduced worldwide demand, arranged for a production reduction through a Declaration of Cooperation (DoC) with OPEC and Non-OPEC countries. Also Canada and Norway have indicated they will be cutting production in response to world wide reduced demand. The OPEC + DoC reduction schedule and chart are shown and discussed at the end of this post.
Read More