EIA Short Term Energy Outlook, Tight Oil Report, and IEA Oil Market Outlook, May 2023

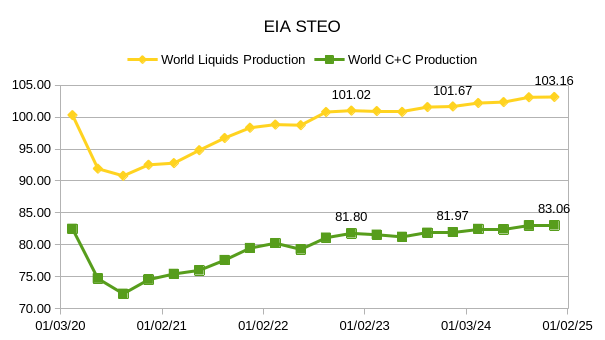
The EIA’s Short Term Energy Outlook (STEO) was published in early May. The report that follows compares World Petroleum Liquids output from the STEO with estimates from OPEC’s Monthly Oil Market Report (MOMR) from May and the IEA’s Oil Market Report (OMR) from February 2023 with an update on World liquids output based on the summary of the May report with my estimate on quarterly output in 2023 based on the annual estimate for 2023 published in May 2023 and the quarterly numbers published in February 2023.

Figure 1
Read More

OPEC Update, November 17, 2022

The OPEC Monthly Oil Market Report (MOMR) for November 2022 was published recently. The last month reported in most of the OPEC charts that follow is October 2022 and output reported for OPEC nations is crude oil output in thousands of barrels per day (kb/d). In most of the OPEC charts that follow the blue line is monthly output and the red line is the centered twelve month average (CTMA) output.  I also show a number of charts from the recent World Energy Outlook 2022, published by the IEA in October. I focus on a selection of charts from Chapter 7 of that report which covers oil.

Figure 1
Figure 2
Read More

OPEC Update, May 2021

The OPEC Monthly Oil Market Report for May 2021 was published this past week. The last month reported in each of the charts that follow is April 2021 and output reported for OPEC nations is crude oil output in thousands of barrels per day (kb/d). In most of the charts that follow there is a red (and in one case yellow) line without markers which is the centered twelve month average (CTMA) for output.  Note that this a change from the way Ron Patterson has reported the average data for many years which used a trailing twelve month average.  Essentially the curve shifts back in time by 5 months as I choose July as the center month for the January to December 12 month average.

Figure 1
Read More