World Energy 2014-2050 (Part 1)

This is a guest post by Political Economist

World Energy 2014-2050: An Informal Annual Report

 “Political Economist” June 2014

The purpose of this informal report is to provide an analytical framework to track the development of world energy supply and demand as well as their impacts on the global economy. The report projects world supply of oil, natural gas, coal, nuclear, hydro, wind, solar, biofuels, and other renewable energies from 2014 to 2050.  It also projects the overall world energy consumption, gross world economic product, energy efficiency, and carbon dioxide emissions from 2014 to 2050.

The basic analytical tool is Hubbert Linearization, first proposed by American geologist M. King Hubbert.  Despite its limitations, Hubbert Linearization provides a useful tool helping to indicate the likely level of ultimately recoverable resources under the existing trends of technology, economics, and geopolitics.  Other statistical methods and some official projections will also be used where they are relevant.

Oil

According to BP Statistical Review of World Energy 2014, world oil consumption (including crude oil, natural gas liquids, coal-to-liquids, gas-to-liquids, and biofuels) reached 4,185 million metric tons (91.3 million barrels per day) in 2013, 1.4 percent higher than world oil consumption in 2012.  In 2013, oil consumption accounted for 32.9 percent of the world primary energy consumption.

World oil production (including crude oil and natural gas liquids) reached 4,133 million metric tons (86.8 million barrels per day) in 2013, 0.6 percent higher than world oil production in 2012.  Figure 1 shows oil production by the world’s five largest oil producers from 1965 to 2013.
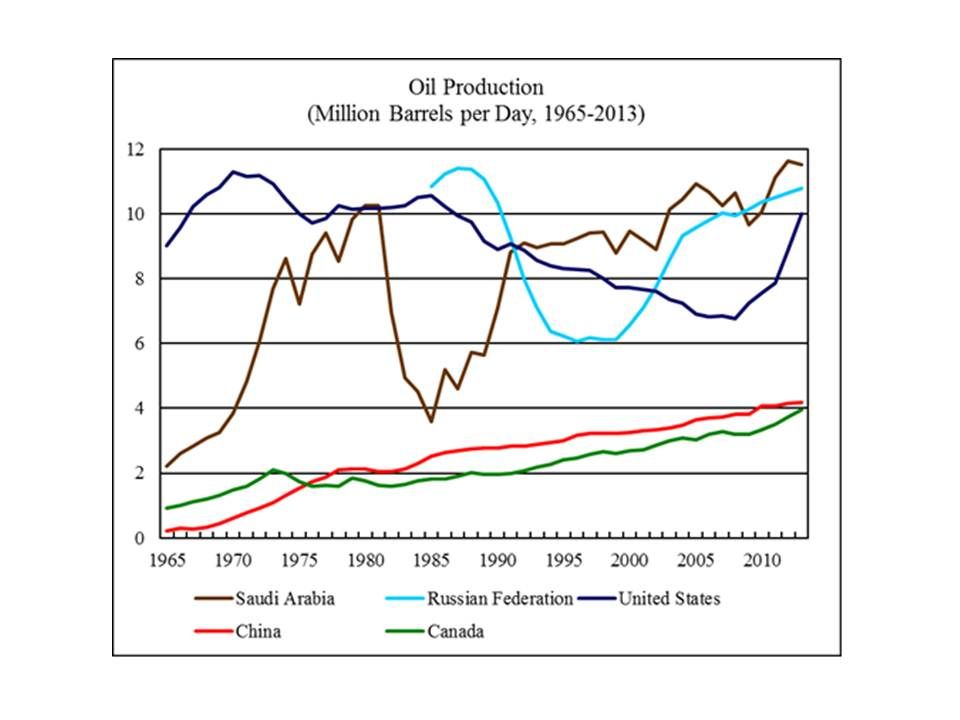
 photo Oil062014-1_zpsc4e13cc7.jpgAs of 2013, world “proved” oil reserves stood at 238 billion metric tons, 1.0 percent higher than the “proved” oil reserves in 2012.

In recent years, the US oil production has surged due to the “shale oil” boom.  The US accounted for all of the growth of world oil production from 2008 to 2013.  Figure 2 shows the historical and projected US oil production from 1950 to 2050.  The projection is based on the reference case scenario for US oil production from 2011 to 2040 projected by the US Energy Information Administration (EIA), extended to 2050 based on the trend from 2031 to 2040.  The EIA reference case projects the US oil production to peak in 2019, with a production level of 543 million metric tons.
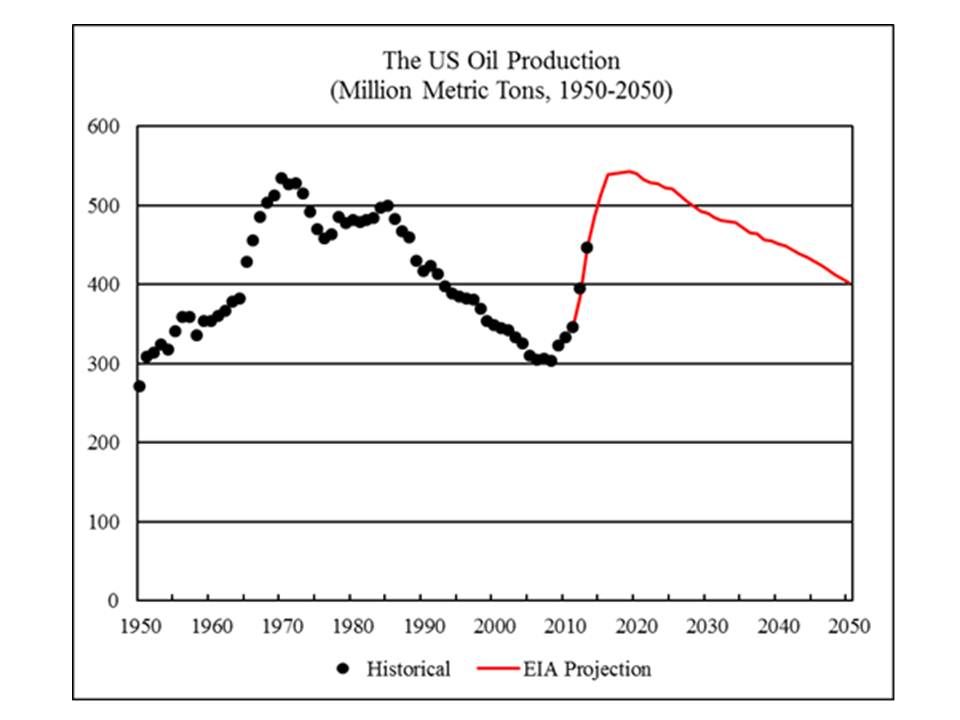
 photo Oil062014-2_zps187c496f.jpg
Read More

How Soon Will the World Oil Production Peak?: A Hubbert Linearization Analysis

This is a Guest Post By “Political Economist”

In this informal paper, I conduct Hubbert Linearization exercises on the world’s 11 topoil producers as well as the rest of the world. The results are used to project the world oilproduction in the future. The evidence presented in this exercise suggests that the world oil production may peakin 2018 or a few years later.

Hubbert Linearization

Hubbert Linearization (first developed by M. King Hubbert) is a statistical techniqueoften used in the peak oil literature. Hubbert Linearization assumes that oil production rises and falls following a pattern thatcan be described by a logistic function:

Q(t) = URR / [1 + EXP (a(Tpeak-t))]

Q(t) is the cumulative oil production up to year t, URR is the ultimately recoverable oil resources, EXP represents the natural exponential function with the Euler’s number “e” being the base, “a” indicates the intrinsic growth rate of the logistic function, Tpeak is the year of peak oil production, and “t” is the current year.

If one takes the derivative of the above equation with respect to “t”, the above equation can be reduced to: dQ/dt = aQ(1-Q/URR) Replace dQ/dt with P (current annual production) and divide both sides by Q:

P/Q = a – (a/URR) Q

If one uses historical data to conduct a linear regression of P/Q over Q, one can solve the two parameters: “a” and “a/URR”. URR (the ultimately recoverable resources) would be solved accordingly. The peak year could in turn be solved.

If one has historical data, Hubbert Linearization is relatively simple and straightforward. But the method has important limitations. Most importantly, it cannot predict future technical changes that will change the amount of recoverable resources. In many cases, the results of Hubbert Linearization are sensitive to the time period used for regressions. The selection of time period often depends on subjective interpretation of available data.

Nevertheless, Hubbert Linearization does reflect the outcomes of historical interactions of geological, economic, geopolitical, and technical factors as well as their evolving trends. When used carefully in combination with other available information, it can provide useful insights into the future trajectory of world oil production.

The World’s Largest Oil Producers

This paper uses BP’s definition of oil production, which defines “oil” as the sum of crude oil and natural gas liquids. The data are mostly from BP Statistical Review of World Energy, extended to 2013 using EIA’s International Energy Statistics.

By this measure, the world’s eleven largest oil producers in 2013 (ranked by their oil production) were Saudi Arabia, Russia, United States, China, Canada, Iran, Iraq, United Arab Emirates, Kuwait, Mexico, and Venezuela.

In this paper, all oil production statistics are stated in million tons. For a rough conversion, 50 million tons of annual oil production roughly equals 1 million barrels of daily production.

Figure 1
pefig/

Figure 1 shows the oil production of the eleven top producers as well as the rest of the world. From 2005 to 2013, the world’s total oil production increased by 192 million tons. Saudi Arabia’s oil production increased by 19 million tons, the Russian oil production increased by 57 million tons, the US oil production increased by 139 million tons, China’s oil production increased by 28 million tons, Canada’s oil production increased by 52 million tons, Iran’s oil production fell by 40 million tons, Iraq’s oil production increased by 66 million tons, the UAE oil production increased by 19 million tons, Kuwait’s oil production increased by 23 million tons, the Mexican oil production fell by 44 million tons, Venezuela’s oil production fell by 30 million tons, and the entire rest of the world’s oil production fell by 97 million tons.
Read More