Bakken by County

North Dakota publishes monthly ND Historical Barrels of Oil Produced by County. This data however does not include confidential wells. But they do estimate, by county, their confidential well production here: Oil and Gas Production Report

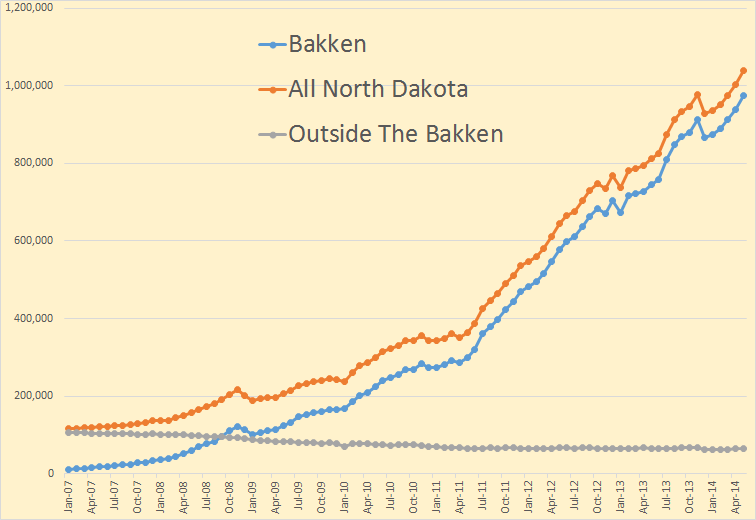
All charts are in barrels per day and are only for the last 16 months in order to get a better and expanded view of what each county is doing.

North Dakota Expanded

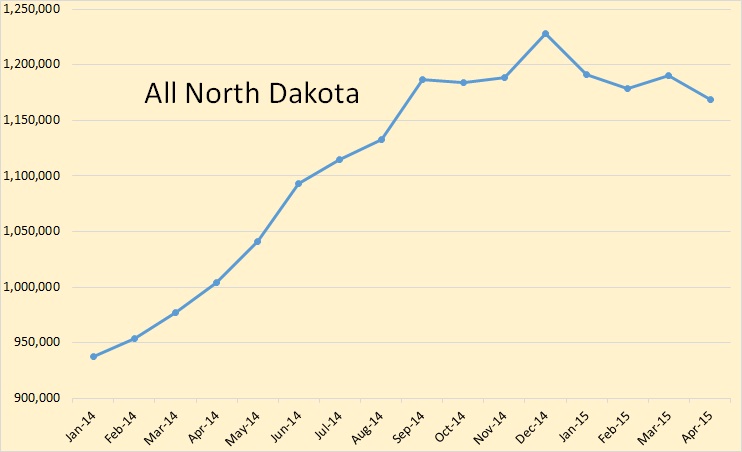
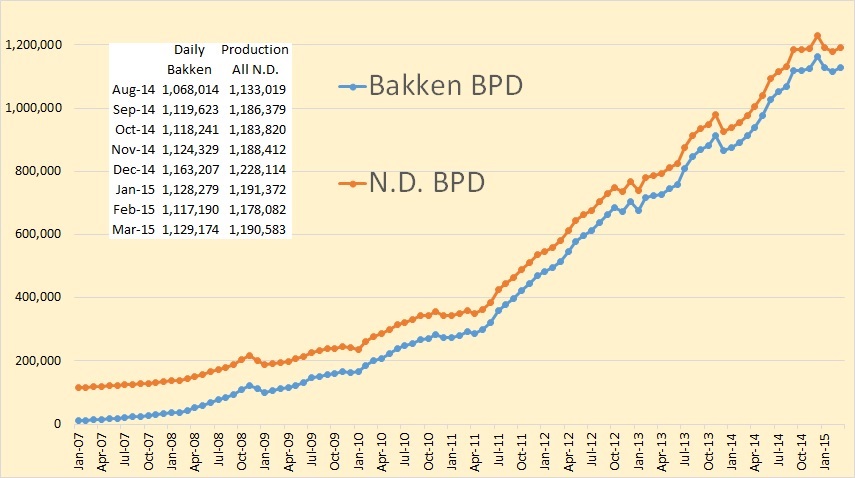
First a sixteen month view of all North Dakota production. North Dakota production, in April, stood at  1,168,636 bpd. That is 17,631 bpd below their production last September, seven months previous. North Dakota production is down 59,385 bpd since the high reached in December.

Read More

Bakken by County and Legacy Decline

North Dakota publishes Historical Oil Production by County. However confidential wells are not included in these totals. But they also publish a State Summary Report which does include confidential well data for the previous two months. Working with both we can get a pretty good estimate of production from each county.

McKenzie

McKenzie had  a 12,533 bp/d gain in March but they are still 32,447 below their December high.

Read More

Bakken, North Dakota & Production by County

North Dakota published their Bakken Production Data yesterday along with their North Dakota Production Data. This all happened the same day the EIA’s Drilling Productivity Report came out. This has resulted in two post in two days.

All charts below are in barrels per day with the last data point May 2014 even though the horizontal axis may only go through April 2014.

What type of chart is preferable to most folks, the below type?

Bakken Stacked

Or this type?

Bakken Barrels Per Day

This was a good month for the Bakken. Production was  up 36,653 bp/d to 974,695 bp/d. All North Dakota was up 36,379 bp/d to 1,039,635 bp/d. This meant that North Dakota production outside the Bakken was down 274 bp/d to 64,940 bp/d.

From the Director’s Cut, bold mine:

The drilling rig count was up slightly from April to May, and from May to June the rig
count increased by one. The number of well completions increased 14% to 227, but weather continued to impact activity in May with 2 days of heavy rain near Dickinson and 5 to 6 days with wind speeds in excess of 35 mph (too high for completion work).

At the end of May there were about 610 wells waiting on completion services, an
increase of 10.
Read More

IN BAKKEN (ND) IT IS NOW MOSTLY ABOUT MCKENZIE COUNTY

This post was originally posted at my blog “Fractional Flow”.

In this post I present an update to my previous posts over at The Oil Drum (The Red Queen series) on developments in tight oil production from the Bakken formation in North Dakota with some additional estimates, mainly presented in charts. The expansion is much about the differences between wells capable of producing, actual producing wells and idle wells (here defined as the difference between the number of wells capable of producing and the number of actual producing wells).


Figure 01: The chart above shows monthly net additions of producing wells (green columns plotted against the rh scale) and development in oil production from Bakken (ND) (thick dark blue line, lh scale) as of January 2000 and as of October 2013. The 12 Month Moving Average (12 MMA) is also plotted (thick dotted dark red line, lh scale).

There is still noticeable growth in tight oil production from an accelerated additions of producing wells.

  • For October 2013 North Dakota Industrial Commission (NDIC) reported a production of 877 kb/d from Bakken/Three Forks.
  • In October 2013YTD production from Bakken/Three Forks (ND) was 775 kb/d.
    (It is now expected that average daily production for all 2013 from Bakken (ND) will become around 800 kb/d.
  • The cash flow analysis now suggests less use of debt for manufacturing wells for 2013.
    Major funding for new wells now appears to come mainly from from net cash flows.

kb; kilo barrels = 1,000 barrels

Read More