EIA Says Shale Continues to Decline

The EIA’s Drilling Productivity Report has US shale oil on a steep decline. The below shale oil production charts are the EIA’s estimate of what shale production will look like through January 2016. Keep in mind this is the EIA’s estimate and not hard production numbers.

DPR Totals

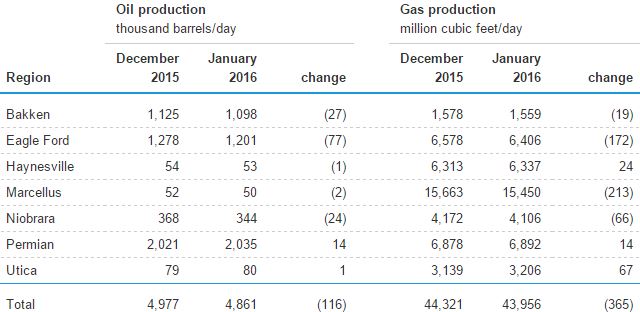
The big drops here are Eagle Ford, Bakken and Niobrara. They have the Permian still increasing in production. An expected drop of 116,000 barrels per day drop in January is very significant.

DPR Bakken

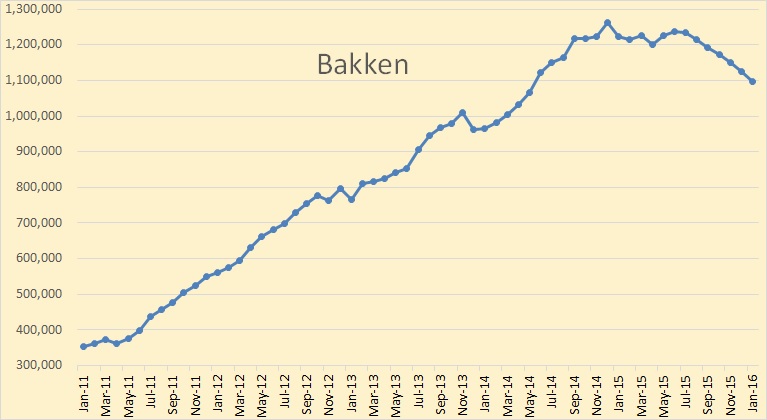
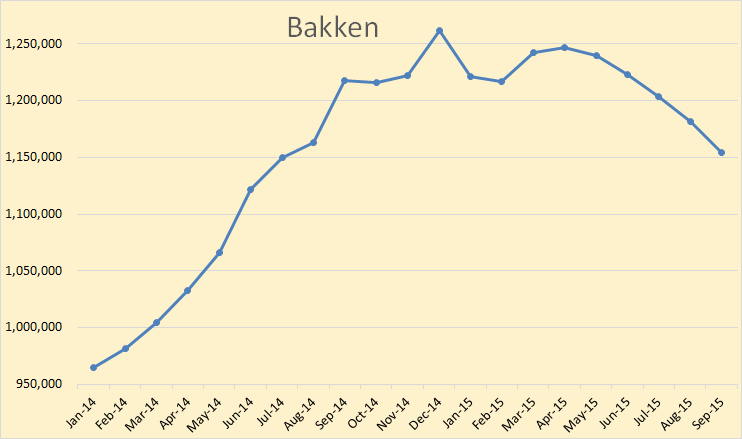
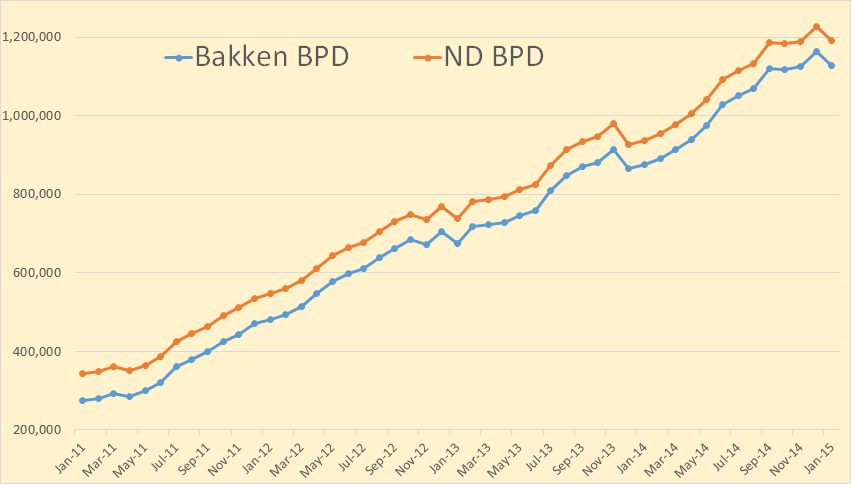
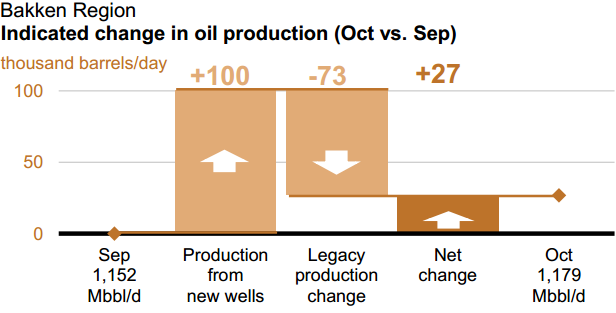
They have the Bakken in a continual decline after July. It is important to note that the EIA’s Drilling Productivity Report has the Bakken decline, July thrugh September, very close to what the North Dakota Industrial Commission has. So it appears that the DPR is getting better with its production estimates.

Read More

US Shale Declining and OPEC Still Climbing

There is new data out today. The EIA published their International Petroleum Statistics yesterday. The EIA also published their Drilling Productivity Report which gave their expected shale oil and gas production through September. Then this morning OPEC published their Monthly Oil Marketing Report with OPEC crude only production numbers through July.

First the Drilling Productivity Report. Of course most of the Drilling Productivity Report is projection, not history. And that projection goes through September 2015.

Bakken

The EIA has the Bakken peaking in December and declining 107 thousand barrels per day since that point. A secondary peak was reached in April and declining steadily since then.

Read More

Bakken Data plus The EIA versus The EIA

The NDIC has just published the latest oil production data from the Bakken.
Monthly Oil Production Bakken Only
Monthly Oil Production All North Dakota

Bakken & ND Prod

Bakken production dropped by 34,619 barrels per day while all North Dakota oil production fell by 36,927 barrels per day.

Bakken & ND BPD per Well

Bakken barrels per day per well fell by 5 to 125 while all North Dakota barrels per day per well fell by 3 to 101.

Bakken Wells Producing increased by 107 to 9,052 while all North Dakota Wells Producing increased by only 49 to 11,796.

Read More

The EIA’s Drilling Productivity Report

The Eia’s latest Drilling Productivity Report is out. However they have only updated the PDF file. The spreadsheets have not been updated and still have last month’s data. But I will give you what the PDF file shows and perhaps add some charts tomorrow if they get around to updating the Excel spreadsheets.

DPR 1

The EIA says Bakken new wells will produce 100,000 bpd in October but all the old wells will decline by 73,000 bpd and leave a net increase of 27,000 bpd. If these numbers are correct and September production was 1,152,000 bpd then that means the monthly decline rate is 6.33%.

DPR 2

The EIA says Eagle Ford new wells will produce 154,000 bpd in October but all the old wells will decline by 123,000 bpd and leave a net increase of 31,000 bpd. If these numbers are correct and September production was 1,551,000 bpd then that means the monthly decline rate is 7.93%.
Read More