EIA’s June 2022 Oil Production Outlooks

A guest post by Ovi

Each month the EIA produces four reports which project oil output for the US and the World. The Short Term Energy Outlook (STEO) forecasts oil output for a period of 12 to 24 months into the future for US and World oil production. A second report, the Drilling Productivity Report (DPR) forecasts the combined production for conventional and tight oil in the main tight oil basins, four months ahead of the EIA monthly report. Their third report, Light Tight Oil (LTO), reports on only the tight oil produced in seven tight oil basins and a few smaller ones. A fourth and final outlook is the Monthly Energy Review (MER) that forecasts US output two months past the official US production numbers, for this report that will be October and November. Due to technical issues at the EIA, the LTO report and the MER were not available at press time.

Production numbers/charts for May for four countries obtained from their official sites are provided below.

Normally the Outlooks report appears at the end of the monthly US report. For this month it has been posted separately and early.

1) Short Term Energy Outlook

The June STEO provides projections for the next 21 months, starting with April 2022 to December 2023, for US C + C and other countries. 

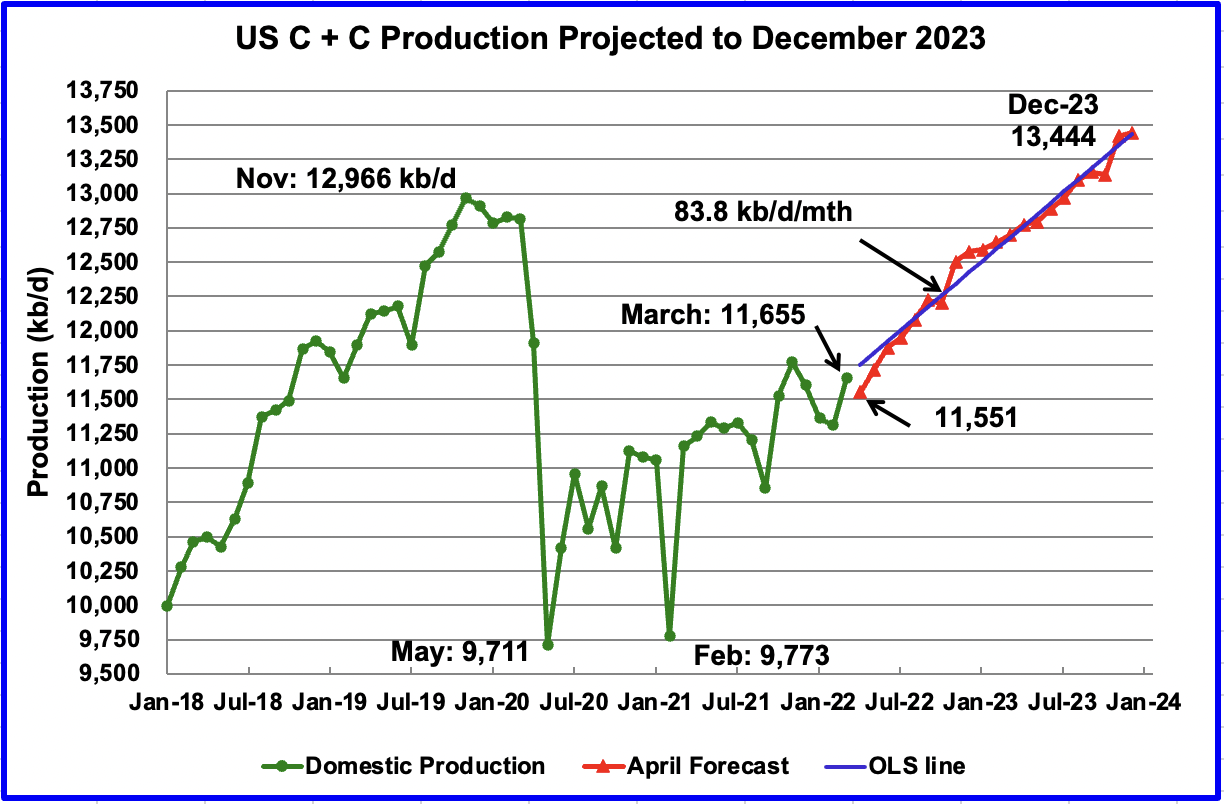
The June 2022 STEO has revised downward its projected US oil output from May 2022 to Q3-23. However Q4-23 has been revised up from the previous May 2022 STEO. In December 2023 output is expected to reach 13,444 kb/d, 160 kb/d higher than reported in the May report

Read More

US Oil Output Continues its Steady Decline

A post by Ovi at peakoilbarrel

All of the oil (C + C) production data for the US states comes from the EIAʼs Petroleum Supply Monthly (PSM). At the end, an analysis of three different EIA monthly reports is provided. The charts below are updated to March 2020 for the 10 largest US oil producing states, (Production > or close to 100 kb/d).

Today’s June 1 update shows the continuous slow decline in oil output from US oil fields from November 2019 to March 2020. March output was 12,716 kb/d, down by 28 kb/d from February’s 12,744 kb/d. Also it should be noted that February’s output estimate from the EIA’s earlier May report, 12,833 kb/d, has been revised to 12,744 kb/d, a downward revision of 89 kb/d. The Red dot is the projected April output from the May Monthly Energy Review.

Read More

US Tight Oil Estimate and Projection to Dec 2019

New tight oil estimates were recently released by the EIA. The chart below compares estimates from Dec 2018 to May 2019, where the Dec 2018 estimate is that estimate with the most recent month estimated being Dec 2018 and likewise the May 2019 estimate has May 2019 as the most recent month estimated. The May 2019 estimate is fairly close to the April 2019 estimate with a slight downward revision of the April 2019 estimate from 7399 kb/d to 7368 kb/d, March 2019 was also revised lower by 10 kb/d from 7292 kb/d to 7282 kb/d. For May 2019 the most recent estimate is 7462 kb/d and if past history repeats this estimate may be revised lower next month.

chart/

Read More

Oil Price Volatility and US EIA Data

A number of news media pieces have recently suggested that oil prices may fall due to soaring output in the US.  Output from US light tight oil (LTO) may not rise as quickly as some EIA reports may suggest. One source of confusion is that the EIA creates many reports and some are more reliable than others. The two charts below cover US LTO and US crude plus condensate (C+C) output.

US LTO Output from the EIA Drilling Productivity Report (DPR) and EIA Tight Oil (LTO) estimates in kb/d.

chart/

US EIA monthly C+C output and centered 4 week average output in kb/d.

chart/

Read More