OPEC Update, April 2023

The OPEC Monthly Oil Market Report (MOMR) for April 2023 was published recently. The last month reported in most of the OPEC charts that follow is March 2023 and output reported for OPEC nations is crude oil output in thousands of barrels per day (kb/d). In many of the OPEC charts that follow the blue line with markers is monthly output and the thin red line is the centered twelve month average (CTMA) output. 

Figure 1
Figure 2
Read More

OPEC Update, October 2022

The OPEC Monthly Oil Market Report (MOMR) for October 2022 was published recently. The last month reported in most of the OPEC charts that follow is September 2022 and output reported for OPEC nations is crude oil output in thousands of barrels per day (kb/d). In most of the OPEC charts that follow the blue line is monthly output and the red line is the centered twelve month average (CTMA) output.  Note however there are a few exceptions to this for OPEC+ charts near the end of the post where EIA C+C data was used which has the most recent data from June 2022 (so three months behind the OPEC crude only data in most of the charts that follow.)

Figure 1
Figure 2
Read More

Arguments over RCP8.5

The climate change scientific consensus is summarized via the annual IPCC documents. In one of the IPCC sections, projections of CO2 emissions from fossil fuel usage are made in the context of several scenarios, which are referred to as Representation Concentration Pathways (RCP).  Historically, the “business-as-usual” pathway was declared to be RCP8.5.

That has worked out as describing an extreme emission scenario IF society did not take corrective action in reducing emissions. In other words, RCP8.5 tracks a growth path in fossil fuels that is extrapolated from the current economic growth rate and largely dead-reckoned FF production increases.

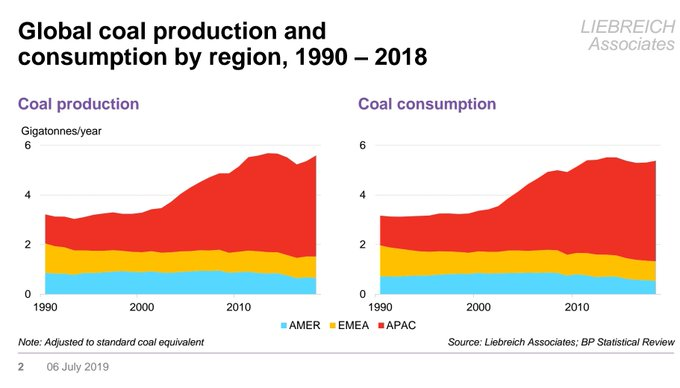
Recently an energy analyst named Michael Liebreich challenged this assumption in the context of the possibility of greater fossil fuel depletion than is currently mapped out in the IPCC, calling the RCP8.5 estimate “bollox” in a tweet.  When challenged on this assertion, he rationalized his claim as follows:

“Here’s why I reject scare stories based on RCP 8.5 and SSP5. They assume a vast increase in coal use in the absence of more international cooperation on climate. But the reality is that it coal power is peaking already. Climate change is scary enough, we don’t need ghost stories.”

— Michael Liebreich (@MLiebreich) August 4, 2019

Read More

US Tight Oil Scenario based on BNP Paribas Study

An interesting analysis was recently published by BNP Paribas (one of the top 10 banks in the World by assets) entitled Wells, Wires, and Wheels… . In that analysis they argue that long term oil prices will fall to $20/b or less in order for oil used for personal land transport to compete with EVs powered by wind and solar at current cost levels.
I reworked my oil price assumptions, first with a simple scenario that follows the EIA’s AEO 2018 reference oil price scenario up to $70/b in 2017$ and then remains at that level long term. Second I noticed that a scenario with such an oil price assumption sees tight oil output fall in 2022 so the scenario was revised with oil prices rising from 70 to 80 per barrel from 2022 to 2024 and then remaining at that level until 2028. The BNP Paribus analysis suggests that EVs will have cut significantly into oil demand by 2022 to 2025 so I assume oil prices fall to $20/b over the next 10 years.
Scenarios below.

chart/ Read More