August Non-OPEC and World Oil Production

By Ovi

The EIA International Energy Statistics had a reporting hiatus from its May 2023 report to July 2023. They have restarted their reports with the August update. This report updates the POB reports and charts posted for May, June and July.

Below are a number of Crude plus Condensate (C + C) production charts, usually shortened to “oil”, for Non-OPEC countries. The charts are created from data provided by the EIA’s International Energy Statistics and are updated to August 2023. This is the latest and most detailed world oil production information available. Information from other sources such as OPEC, the STEO and country specific sites such as Russia, Brazil, Norway and China is used to provide a short term outlook for future output and direction for a few of these countries and the world.

World oil production and projection charts are presented at the end of this post.
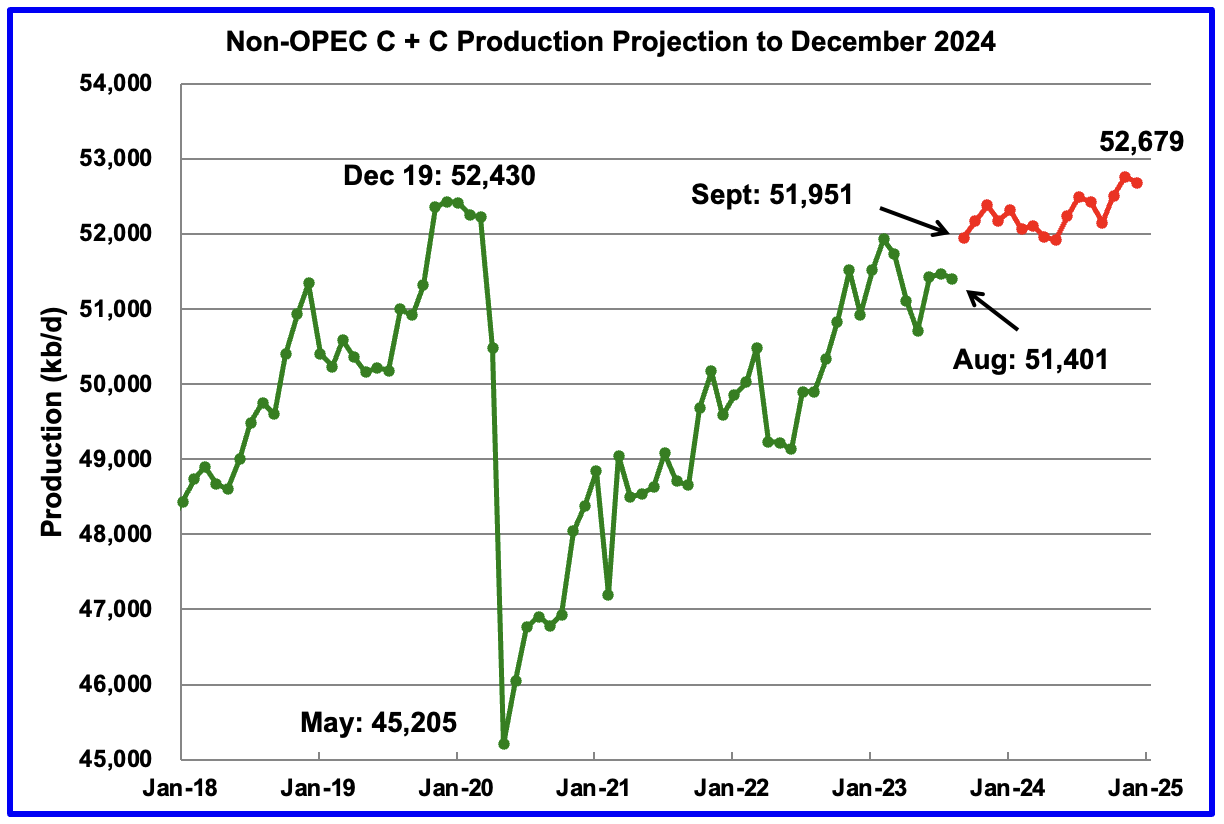
August Non-OPEC oil production dropped by 71 kb/d to 51,401 kb/d. The largest decreases came from Kazakhstan, Brazil and Russia.

Read More
EIA Short Term Energy Outlook and Tight Oil Update, November 2023

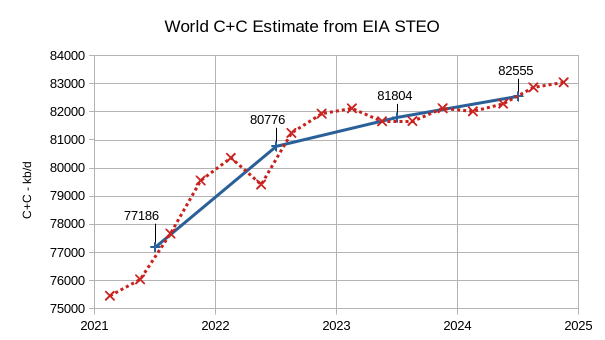
The EIA’s Short Term Energy Outlook (STEO) was published in early November. The chart below estimates World C+C by using the STEO forecast combined with past data from the EIA on World Output.

The EIA’s Short Term Energy Outlook (STEO) was revised lower in November compared to September (we skipped the October STEO). World C+C output is expected to decrease in the 2nd and 3rd quarters of 2023 and then increase over the next 5 quarters. Annual average World C+C output increases by about 1028 kb/d Mb/d in 2023 to 81804 kb/d and then to 82555 kb/d in 2024, about 445 kb/d below the centered 12 month average peak in 2018. This month’s World C+C estimates are about 400 kb/d lower than September’s estimate for 2023 and 1150 kb/d lower for 2024 due to the revisions in the STEO forecast since Sept 2023.

Read More

The IEA’s Oil Production Predictions for 2016

The IEA Oil Market Report, full issue, is now available to the public. Some interesting observations:

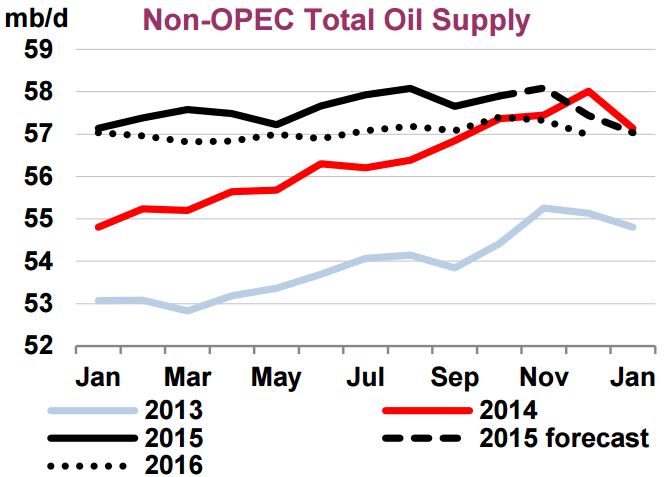
Non-OPEC oil supplies are nevertheless seen sharply lower in December. Overall supplies are estimated to have slipped by more than 0.6 mb/d from the month prior, to 57.4 mb/d. A seasonal decline in biofuel production, largely due to the Brazilian sugar cane harvest, of nearly 0.4 mb/d was the largest contributor to December’s drop. Production in Vietnam, Kazakhstan, Azerbaijan and the US was also seen easing from both November’s level and compared with a year earlier. Persistently low production in Mexico and Yemen were other contributors to the year-on-year decline.

As such, total non-OPEC liquids output slipped below the year earlier level for the first time since September 2012. A production surge in December 2014 inflates the annual decline rate, but the drop is nevertheless significant should these estimates be confirmed by firm data. Already in November, growth in non-OPEC supply had slipped to 640 kb/d, from as much as 2.9 mb/d at the end of 2014, and 2.4 mb/d for 2014 as a whole. For 2015, supplies look likely to post an increase of 1.4 mb/d for the year, before contracting by nearly 0.6 mb/d in 2016. A prolonged period of oil at sub-$30/bbl puts additional volumes at risk of shut in as realised prices fall close to operating costs for some producers.

IEA Forecast 2

The IEA has every month of 2016 Non-OPEC production below the year over year 2015 production.

Read More