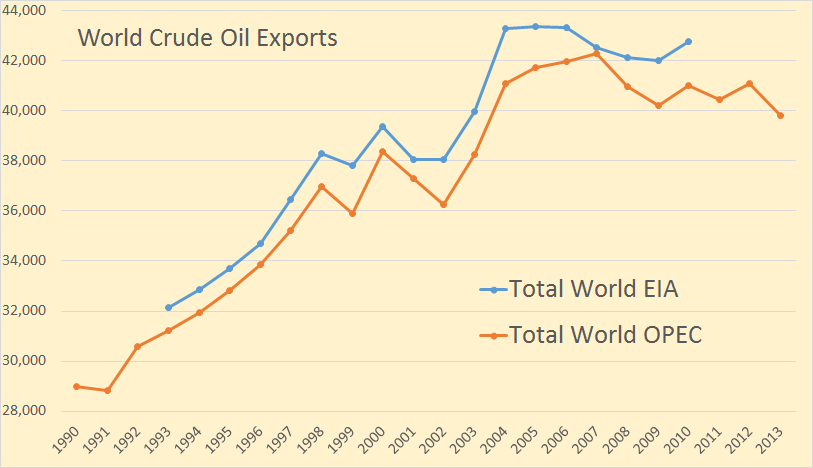
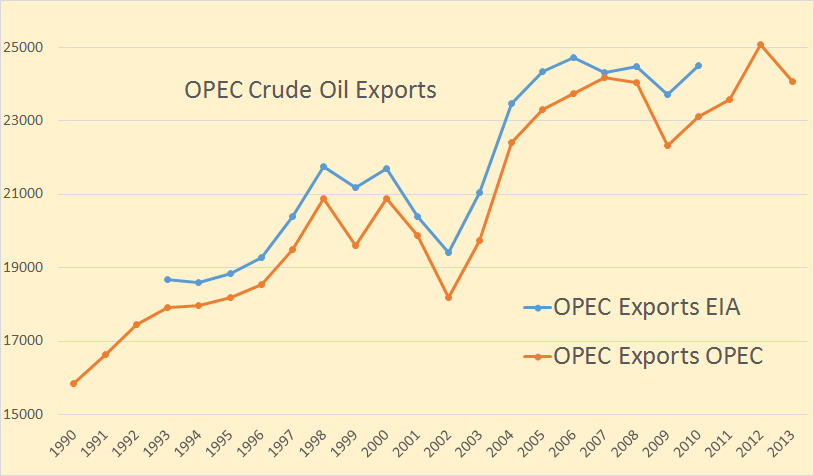
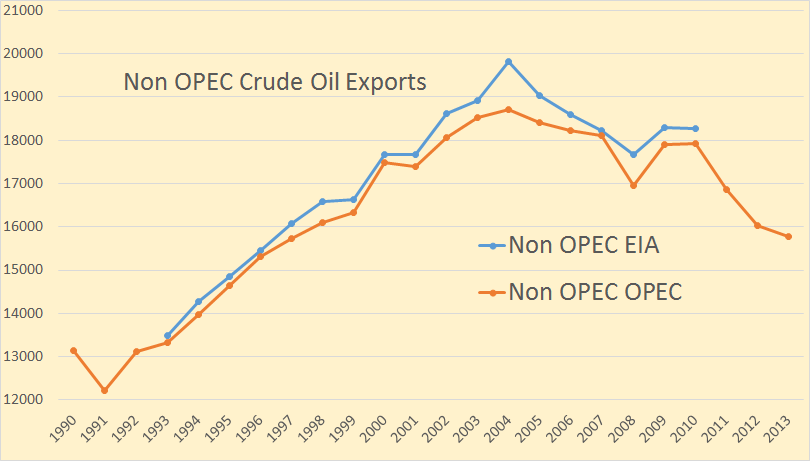
OPEC has released their Annual Statistial Bulletin 2014. Under the heading of “Oil and Gas Data” there are several tables you can download. I was excited to find one labeled “Table 3.21: World Exports of Crude Oil and Petroleum Products by Country”. It turned out to be useless however as it includes a lot of exports of imported products. And they have no table of “Net Imports”. However their their table labeled “Table 3.18: World Crude Oil Exports by Country” turned out to be very useful as it seems to measure the same thing as the EIA does in their International Energy Statistics, Crude Oil Exports which also includes lease condensate.
The OPEC export data goes back to 1960 but I have only plotted it from 1990. The EIA data only goes back to 1993. The OPEC data is through 2013 while the EIA data only goes through 2010 except for Canada, Mexico and Norway which goes through 2012. All data is in thousand barrels per day.
World crude oil exports peaked in 2007 and now stand 42,297,000 bp/d and in 2013 stood 2,467,000 bp/d below that point. World crude oil exports in 2013 were 2,467,000 barrels per day below peak and at the lowest point in 10 years.
OPEC exports peaked, so far, in 2012 at 25,068,000 barrels per day. Their exports fell by just over 1,000,000 barrels per day last year and I am betting they will fall further this year.
Non-OPEC exports have taken a hit in the last few years, peaking in 2004 and are down just under three million barrels per day since then.


