Note: Jean Laherrere sent me the below post and asked me to post it in reply to comments posted by Dennis Coyne and Political Economist on my post Bakken Update, March Production Data. But that was several days ago, the comments are stale. Also it was too large for a comment. So since we are a period where there is a dearth of data, I decided to make a post of it. Below Jean’s graphs and comments I have added a couple of news Items.
_______________________________________________
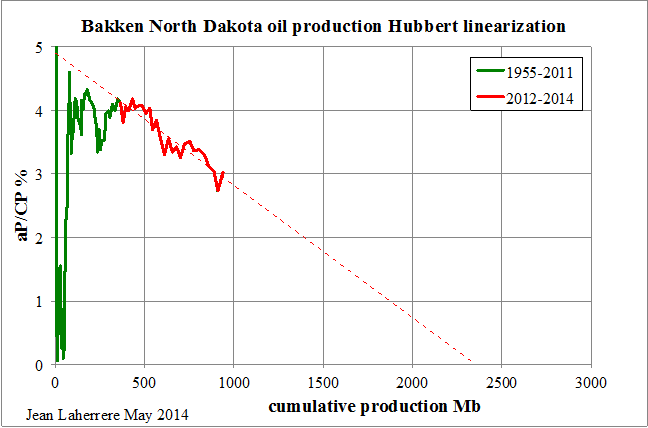
Policial Economist displays a graph for Bakken production Hubbert linearization trending towards 3.5 Gb, but it is from EIA DPR for the period January 2007 to June 2014 : it is not real data (we are not yet in June 2014) but estimates.
It is different from mine trending towards 2.4 Gb, but it is only for North Dakota Bakken using ND state data from 1955 up to March 2014.
In many of my papers I state that production Hubbert linearization is not very reliable and it is better to rely on the creaming curve of cumulative backdated 2P discovery versus cumulative number of fields. But for LTO there is no reliable way to estimate 2P reserves, because only the volume generated by the source rocks (using Rock Eval measures from cores) can be estimated but the amount lost from this generated oil and gas cannot be estimated and the recovery from what is left within the fractures needs longer historical data.
The ND production excluding Bakken Hubbert linearization trends also towards 2.5 Gb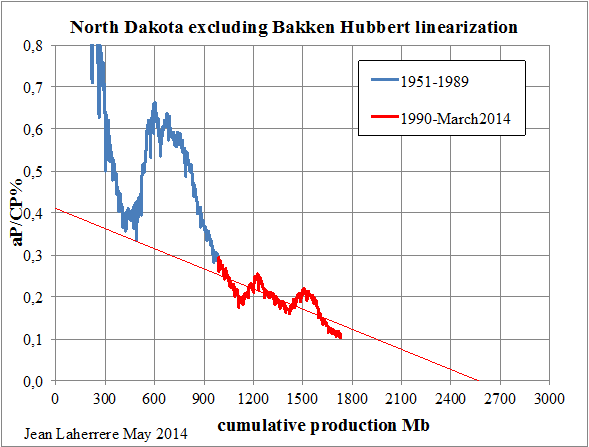
It is why I use a NG oil ultimate of 5 Gb with both 2.5 Gb for Bakken and non-Bakken.
Read More