By Ovi
The focus of this post is World oil production along with a more detailed look at the top 11 Non-OPEC oil producing countries.
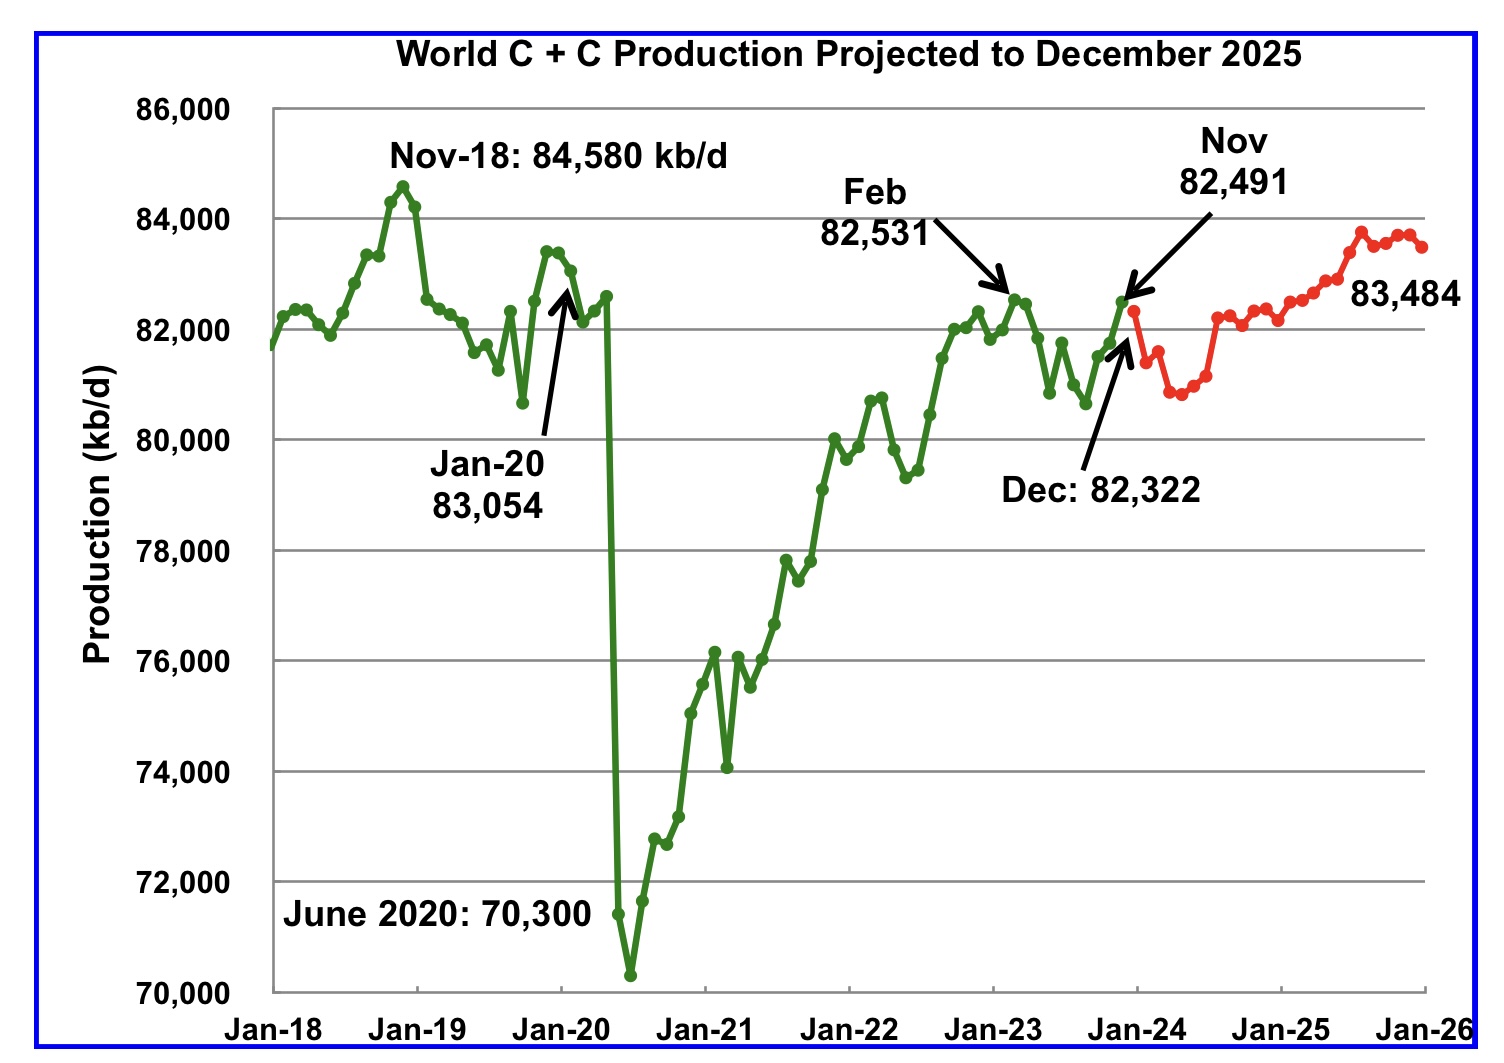
Below are a number of Crude plus Condensate (C + C) production charts, usually shortened to “oil”, for oil producing countries. The charts are created from data provided by the EIA’s International Energy Statistics and are updated to December 2023. This is the latest and most detailed/complete World Oil production information available. Information from other sources such as OPEC, the STEO and country specific sites such as Brazil, Norway and China is used to provide a short term outlook.
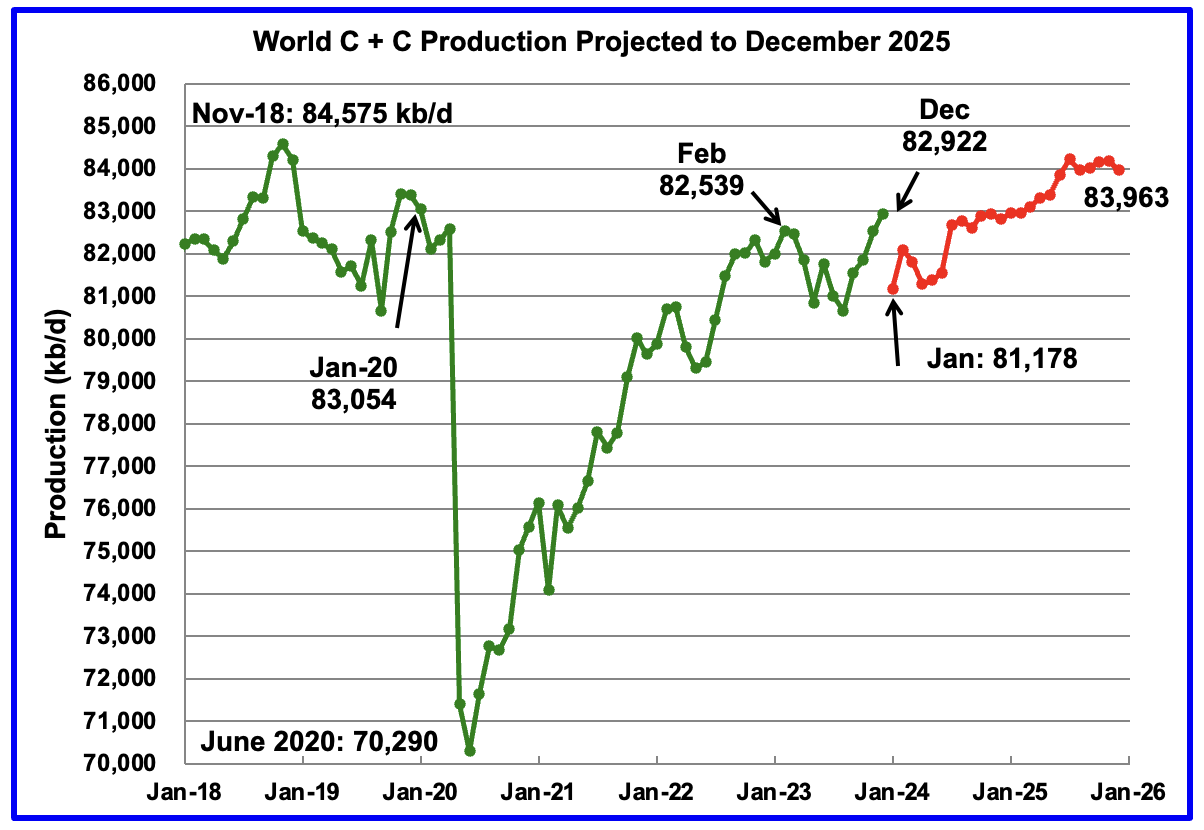
World oil production increased by 400 kb/d in December, green graph, to a post pandemic high. The largest increase came from Guyana, 175 kb/d. January World oil production is projected to drop by 1,744 kb/d to 81,178 kb/d. The large production drop is due to the STEO’s January estimated drop of 2,160 kb/d for all liquids. Of the 2,160, US accounts for 1,500 kb/d while Canada drops 130 kb/d and Brazil drops 280 kb/d.
Read More