The OPEC data for the charts below are from the OPEC Monthly Oil Market Report.
and is thousand barrels per day.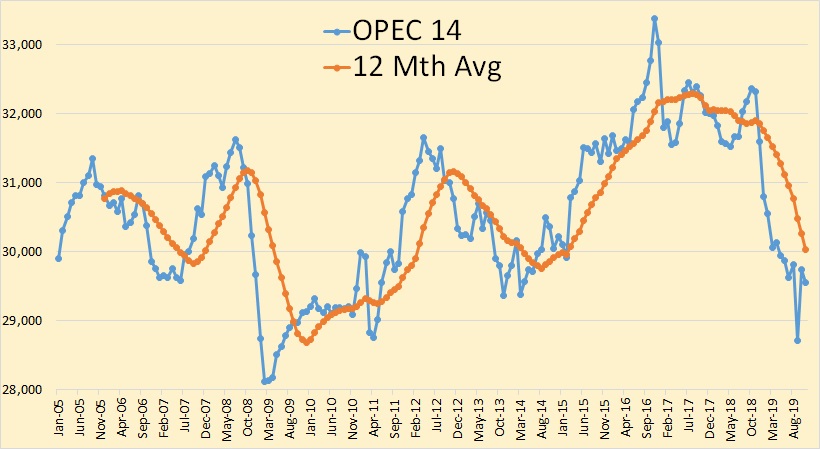
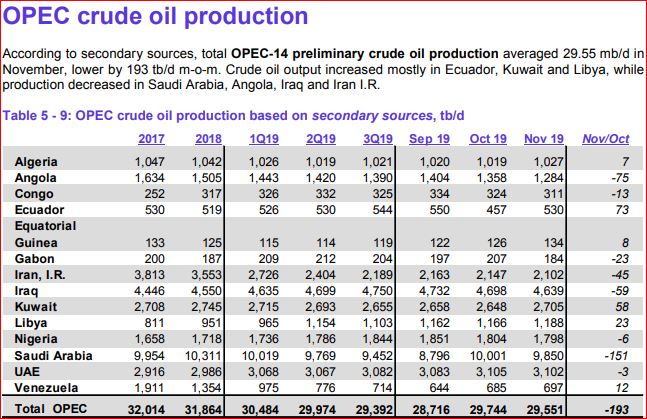
OPEC 14 was down 193,000 barrels per day in November but that was after October production had been revised up by 94,000 bpd.
The OPEC data for the charts below are from the OPEC Monthly Oil Market Report.
and is thousand barrels per day.OPEC 14 was down 193,000 barrels per day in November but that was after October production had been revised up by 94,000 bpd.
The below charts, unless otherwise noted, were taken from the OPEC Monthly Oil Market Report. The data is through May, 2019 and is in thousand barrels per day.
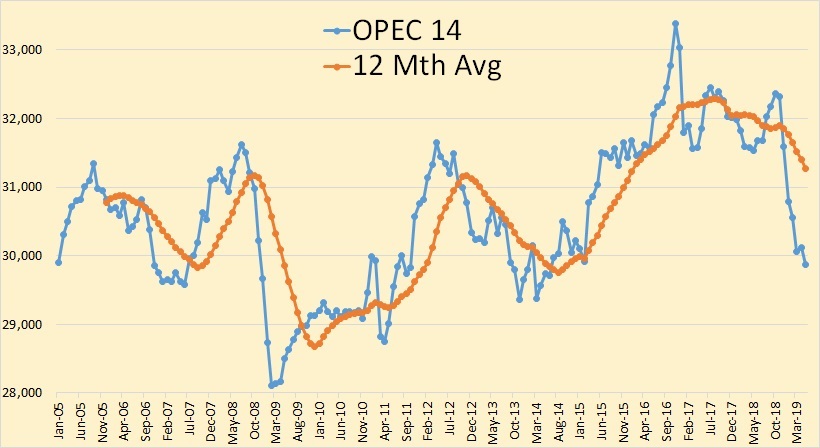
OPEC crude only production was down 236,000 barrels per day in May but that was after April production had been revised upward by 82,000 bpd.
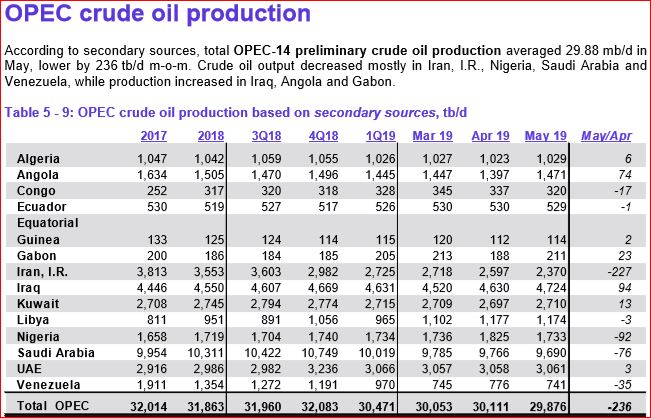
Iranian April production was revised upward by 43,000 bpd and Saudi Arabia April production was revised upward by 24,000 bpd.
The data below was taken from the OPEC Monthly Oil Market Report. All data is through April 2019 and is in thousand barrels per day. The data is crude only, that is it does not include condensate.
Total OPEC production hardly moved in April, down a mere 3,000 barrels per day.
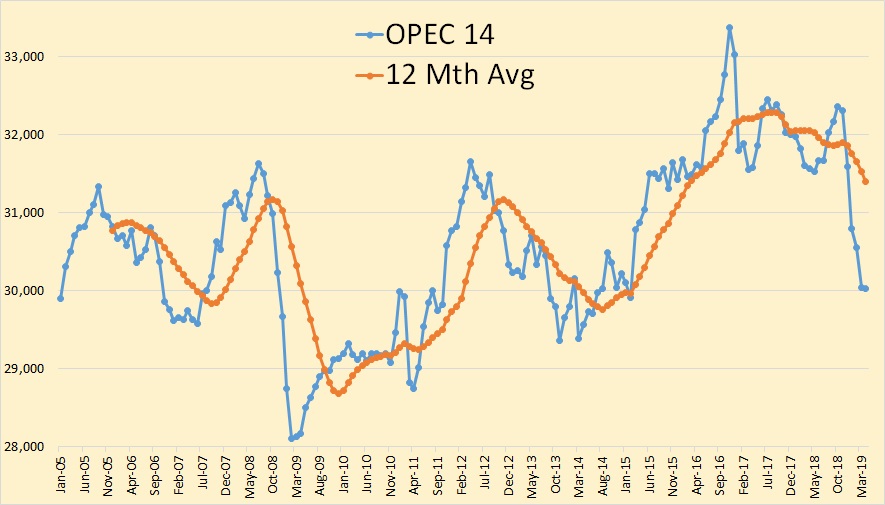
The below OPEC charts were taken from data in the OPEC Monthly Oil Market Report. All data is through March 2019 and is in thousand barrels per day.
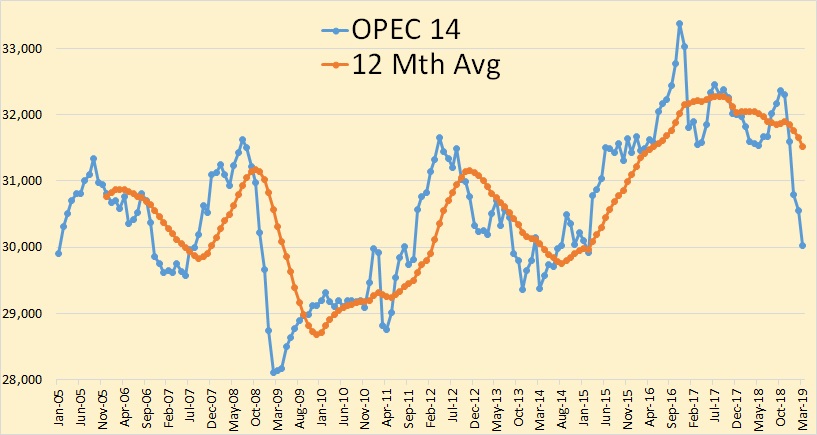
There was another big decline in OPEC production in March, down 534,000 barrels per day.
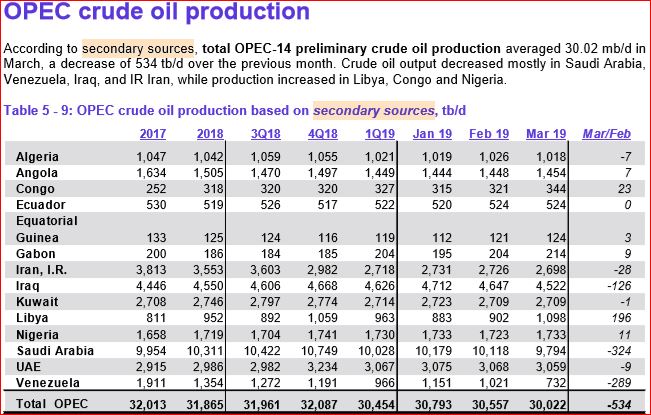
The decline was mostly Saudi Arabia, Venezuela, and Iraq.

Iran, Libya and Venezuela are exempt from quotas. Everyone except Saudi Arabia are near their quota. Saudi is over half a million barrels per day below their quota.
Most of the data below is taken from from the EIA’s Short-Term Energy Outlook. The data through February, 2019 is the EIA’s best estimate of past production and all data from March 2019 through December 2020 is the EIA’s best estimate of future production. However in most cases February production is highly speculative so I drew the “projection” line between January and February.
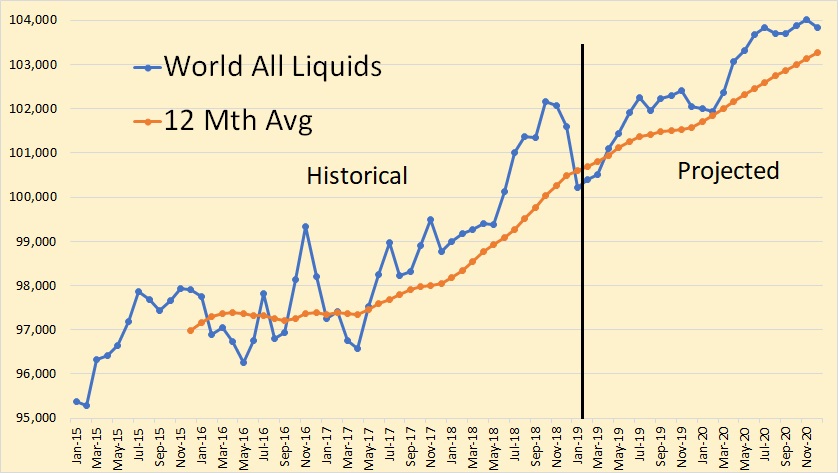
Understand the above chart is Total Liquids, not C+C as I usually post. As you can see the EIA expects world petroleum liquids to keep climbing ever upwards.
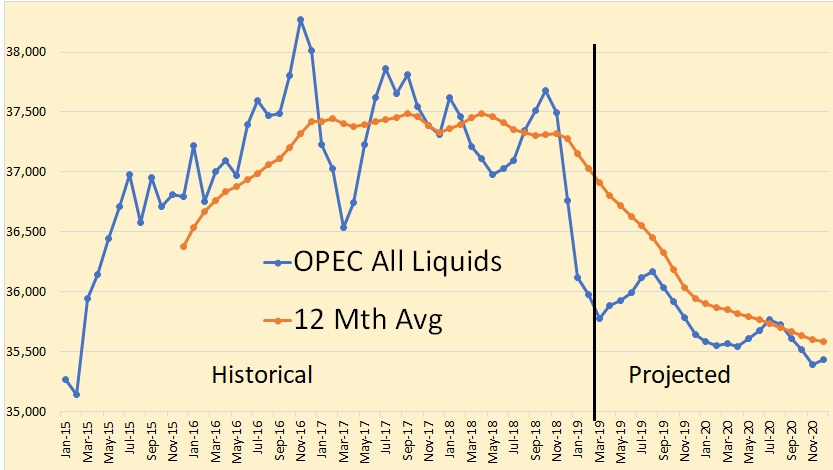
This is the EIA’s data for OPEC all liquids with Production data from April 2019 through December 2020.