December Non-OPEC Oil Output Continues Rebound from May Low

A post by Ovi at peakoilbarrel

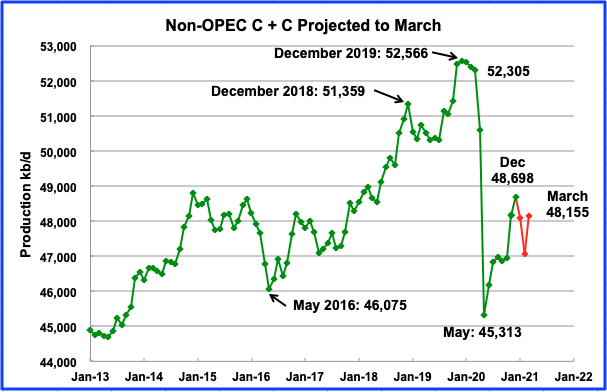
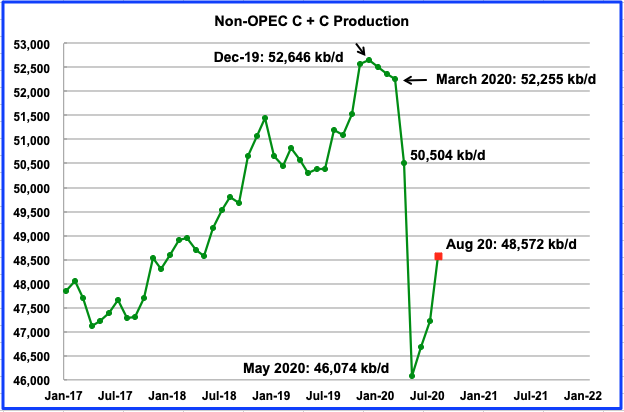
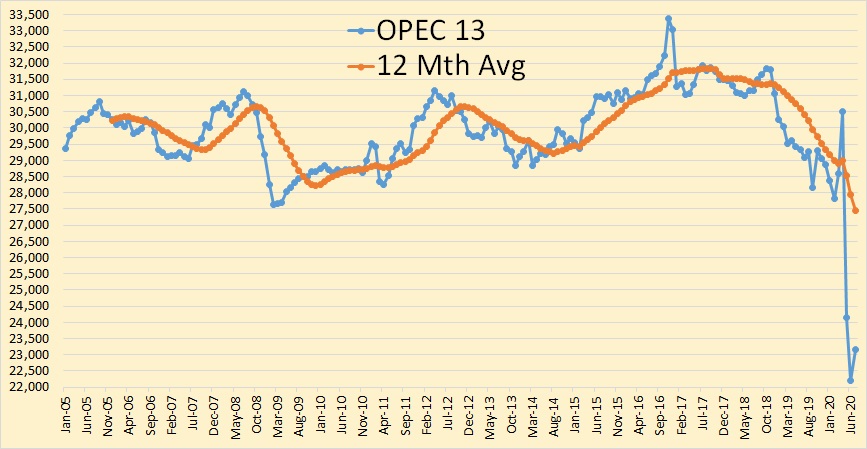
Below are a number of oil (C + C ) production charts for Non-OPEC countries created from data provided by the EIAʼs International Energy Statistics and updated to December 2020. Information from other sources such as OPEC, the STEO and country specific sites such as Russia, Norway and China is used to provide a short term outlook for future output and direction for a few countries and the world.

Read More

BRAZIL SUMMARY

A guest post by George Kaplan

Leasing

The creaming curve for lease sales in Brazil looks like it is turning towards the asymptote overall. Unfortunately there is insufficient data provided to allow land and marine leasing to be separated but I expect that the curve for land is close to the limit but that for marine areas is barely half way. The average take up of offers has remained high, which suggests APB, the Brazilian authority in charge, is discerning about what it offers.

Read More

The EIA’s Optimistic Outlook

Most of the data below is taken from from the EIA’s Short-Term Energy Outlook. The data through February, 2019 is the EIA’s best estimate of past production and all data from March 2019 through December 2020 is the EIA’s best estimate of future production. However in most cases February production is highly speculative so I drew the “projection” line between January and February.

Understand the above chart is Total Liquids, not C+C as I usually post. As you can see the EIA expects world petroleum liquids to keep climbing ever upwards.

This is the EIA’s data for OPEC all liquids with Production data from April 2019 through December 2020.

Read More