A Guest Post by George Kaplan
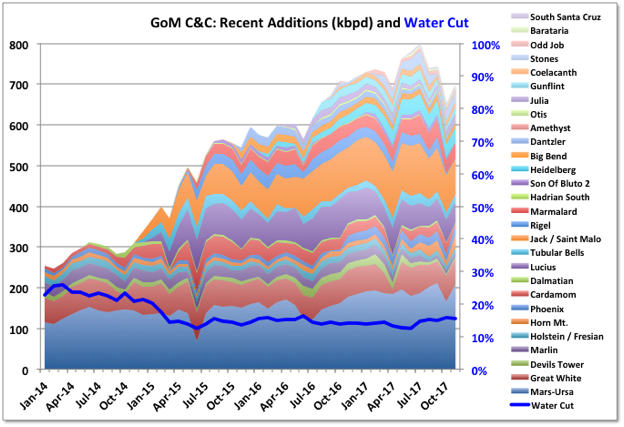
2017 was the highest producing year for oil in the GoM and included the record month in March. Gas, which has tended to come from shallow water wells, had accelerated decline. The production would have been higher but for some disruptions from Hurricanes, in particular Nate, though that had the least impact onshore, and some unplanned outages in November and December due to equipment failures. The failure to Delta House subsea manifold affected Rigel, Otis and Son of Bluto 2 fields, and the first two still appear to be off-line while Son of Bluto 2 resumed production in December (LLOG, the operator, I think calls the Rigel field Neidermeyer, which is much better for the Animal House theme). The Enchilada gas pipeline appears to have ruptured at the main platform and has resulted in Baldpate, Salsa, Llano, Cardamom and Magnolia going off-line. Plans were recently announced to restart Baldpate/Salsa, which do not go through the platform, but I haven’t seen any notice of the restart.
|
|
Oil Average |
Oil Exit Rate |
Gas Average |
Gas Exit Rate |
Total Average |
Total Exit Rate |
| (kbpd) | (kbpd) | (mmscfd) | (mmscfd) | (kboed) | (kboed) | |
2016 |
1600 | 1728 | 3308 | 3363 | 2151 | 2289 |
2017 |
1685 | 1570 | 2955 | 2381 | 2177 | 1967 |
Change |
85 | -158 | -354 | -982 | 26 | -322 |
Ratio |
5.3% | -9.1% | -10.7% | -29.2% | 1.2% | -14.1% |
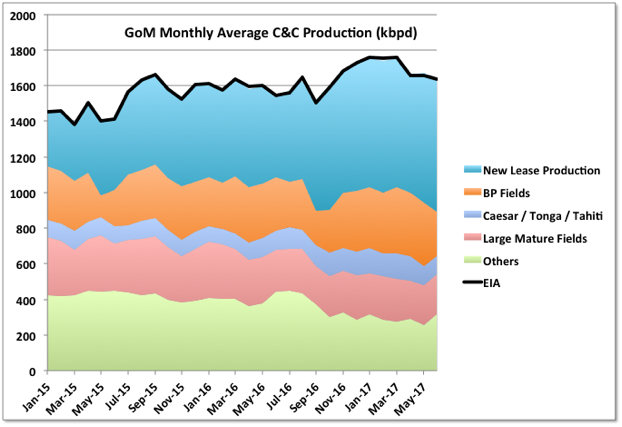
C&C Production
December production numbers were dominated by the unplanned outages, so comparisons with November don’t mean much. As well as the two issues given above the Tahiti and Caesar/Tonga fields were off line for a few weeks, though I have seen no news why (these share a common set of leases but are produced separately to the Tahiti and Constitution platforms). Each month that these are three issues hold current outages would knock about 10 to 12 kbpd off the achievable average production for 2018.
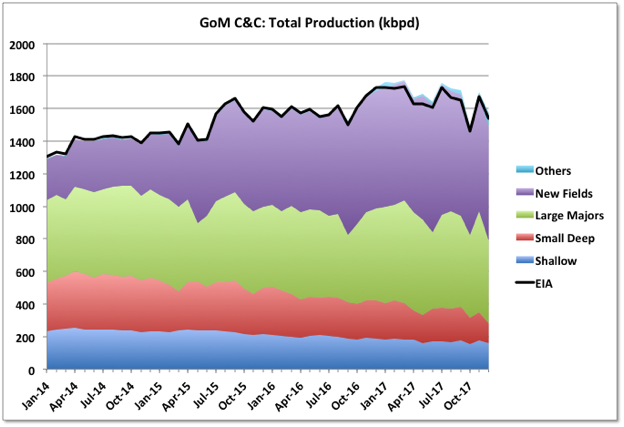
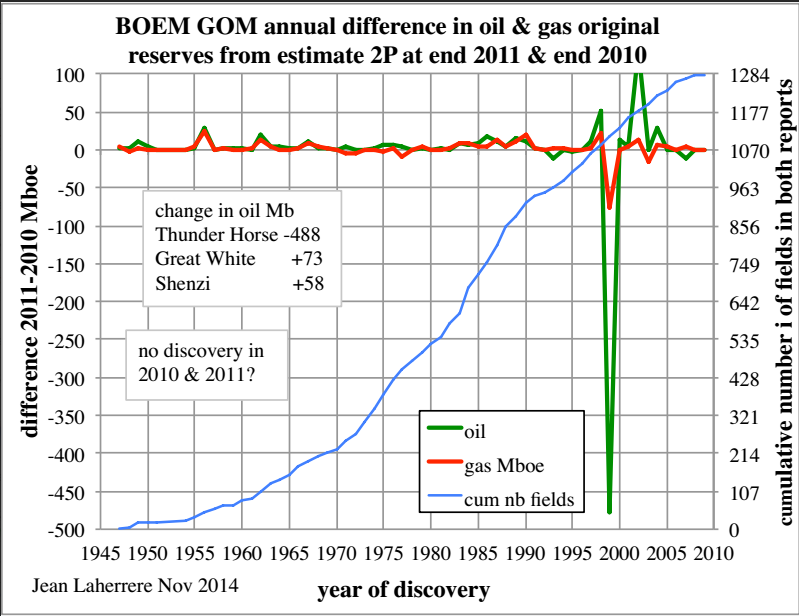
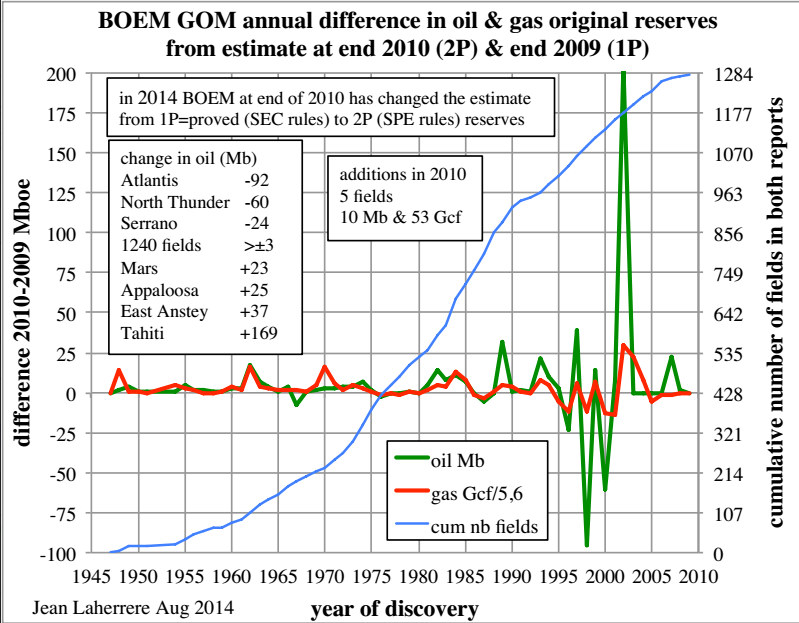
Despite recent variability it certainly looks like the new fields brought on since late 2013, and which have seen all the net growth since then, have peaked. Any average decline rate can’t really be extrapolated yet, given the recent upsets, but the BOEM reserve estimate updates, due in the next couple of months, will provide better R/P numbers as there will be longer operating data for all the fields.