I was going over the IEA’s World Energy Outlook 2013 and noticed a few things you might find interesting. Exactly what is their opinion on Peak Oil? Here, cut and pasted from the report.
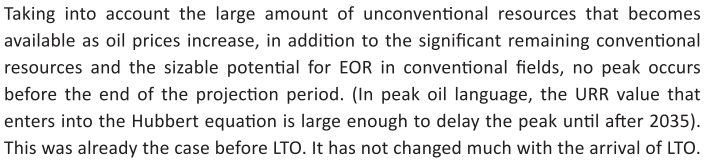
Got that? The URR is great enough to delay any peak until after 2035. Here is one of their graphs that indicate how much they think is left, coal, gas and oil.
Okay 54 years of proven reserves. That puts the peak out to well past mid century. Likely well past 2100 if you count those remaining recoverable resources. And just who has all this oil?
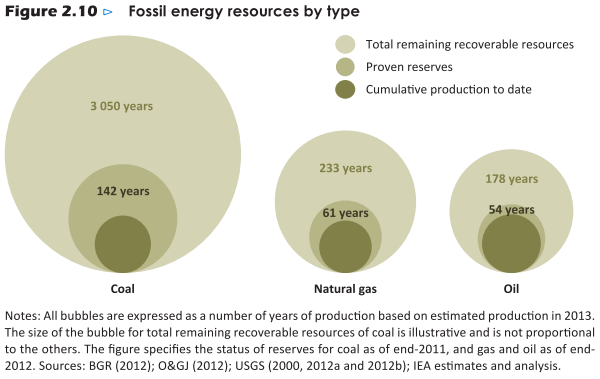
2.2 trillion barrels of conventional crude oil resources. However only 1.7 trillion barrels of that has a 90% probability of being recoverable. Of this the Middle East has the lions share, 971 billion barrels of resources with a 90% probability of recovering 813 billion barrels of that.
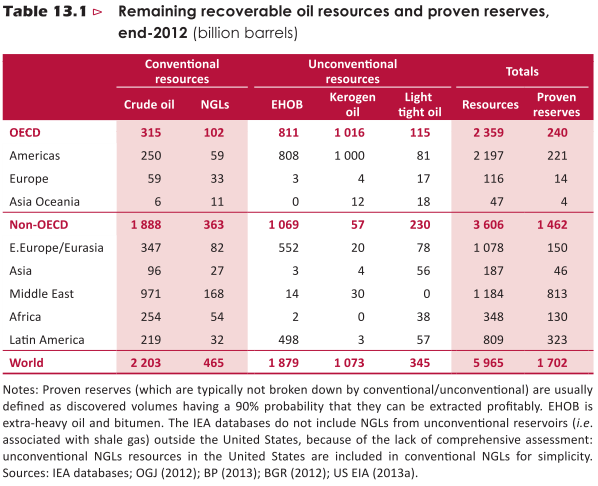
The Middle East, of course, mostly OPEC. And if you count the four OPEC countries of Africa and the two in South America, the vast majority of the world’s oil reserves are in OPEC nations. In fact OPEC claims 81% of all the proven reserves in the world.
So with 81% of the world’s proven reserves what is the IEA expecting from OPEC in the future?
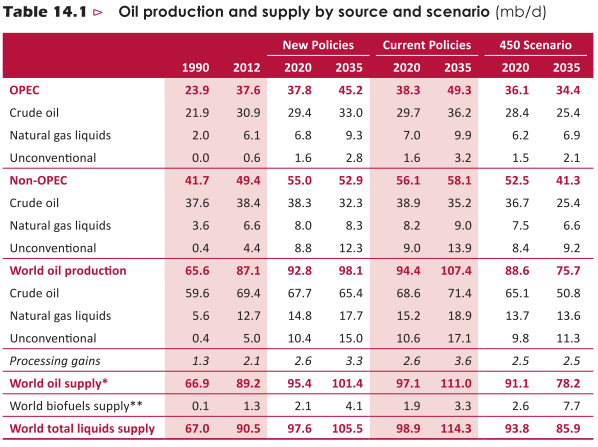

A word of explanation is needed here. New Policies Scenario: A scenario in the World Energy Outlook that takes account of broad policy commitments and plans that have been announced by countries, including national pledges to reduce greenhouse-gas emissions and plans to phase out fossil-energy subsidies, even if the measures to implement these commitments have yet to be identified or announced.
450 Scenario: A scenario presented in the World Energy Outlook that sets out an energy pathway consistent with the goal of limiting the global increase in temperature to 2°C by limiting concentration of greenhouse gases in the atmosphere to around 450 parts per million of CO2.
Current Policies is business as usual. Or, basically, we will keep on doing what we are doing. Which is of course exactly what will happen. However what the IEA sees as happening, above, is not exactly what will happen, far from it.
So, looking at Conventional Crude Oil Production in 2012, 2020 and 2035 we find this. All data on all charts below are in million barrels per day:
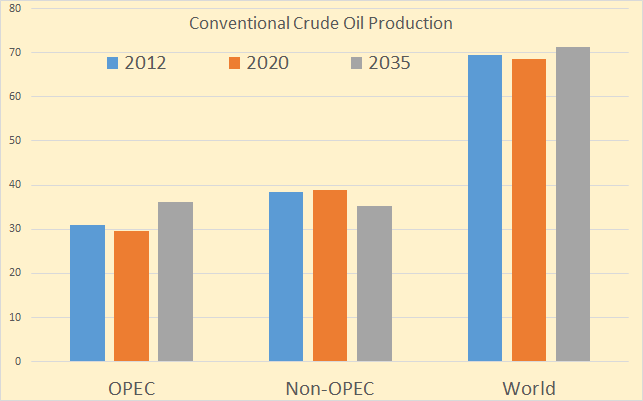
Well hell, OPEC production will be lower in 2020 than it is today. And non OPEC production will be lower in 2035 than it is today. But not to worry, total conventional crude production will be up 2.9 percent in the 23 years between 2012 and 2035.
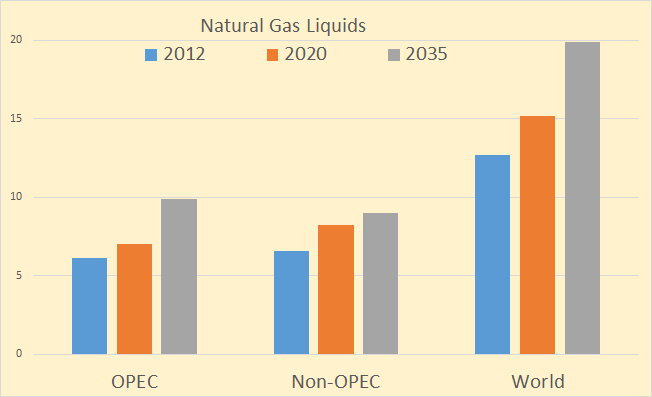
But they are expecting Natural Gas Liquids to increase by almost 57 percent.
And let us not forget about Unconventionals. What are Unconventionals?
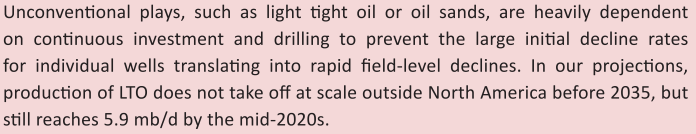
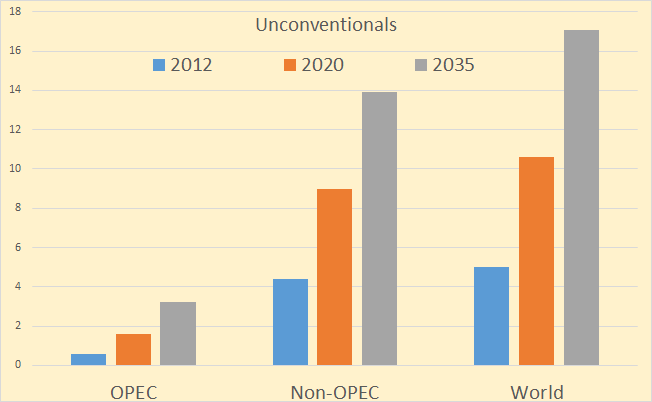
Unconventionals, Light Tight Oil and Oil Sands increase from 5 mb/d to 10.6 mb/d in 2020 to 17.1 mb/d in 2035. That is an increase of 242 percent in 23 years.
Note: If you would like to be added to my email notification list when a new post is posted please email me at DarwinianOne at Gmail.com.
Ron,
I guess this is a dumb question but here goes anyway: Will burning all that coal, gas and oil be a bad thing for the planet? Or do these guys not build global warming fears into their thinking?
Doug
Ron,
Got to love the 450 Scenario on limiting Global Temperatures from reaching 2C. Simply amazing how grown adults actually delude themselves into believing this garbage.
After spending a month pouring over all the new climate data, a simple analogy hit me. When I used to be a bartender in college, we would get groups of amateurs that would come in a drink up a storm. They would be celebrating some event and within a hour or so… do 3-4 shots. Not including the drinks they were sipping on.
Unfortunately, any amateur who was not used to drinking was already screwed… just didn’t know it yet. While they were feeling good for that first hour or so, by the time those 4 shots kicked in by the next few hours.. they were WHITE in the FACE and sick as a dog.
This is precisely what’s taken place with our climate. We BLEW carbon in the atmosphere so fast (like doing alcohol shots), that the system is now reacting to it all. I imagine we are heading into a RAPID HEATING, and there’s no stopping it because the damage was done years ago.
I have this strange feeling that the world will wake up in the next several years on the subject of climate change when MSM won’t be able to delude the public as weather events go haywire.
steve
Steve,
Maybe we should just aim for 6 degrees C. Hell man, screw the booze, we could have methane breathing, bubble watching parties while sunbathing on Arctic shores. Remember, don’t get all negative on us now.
Doug
Doug,
LOLOL…
s teve
“Well hell, OPEC production will be lower in 2020 than it is today.”
That is the one compelling issue in the article. If OPEC output will drop over the next 6 years (to 2020), there is no imaginable mechanism for that to turn around in those particular countries to generate an increase by 2035.
Unless . . . they add countries.
Watcher,
Which countries do you think might do the trick?
Doug
Not really the point — I was alluding to how the OPEC majors are about as well seismically mapped as you can be and so how do you acknowledge decline for 6 yrs and then imagine growth for 15. Iraq is going to grow some over the next 6, but it’s not going to them carry the ball for all others in the next 15.
But as for who might join OPEC, obviously Canada.
Watcher,
“so how do you acknowledge decline for 6 yrs and then imagine growth for 15” Obviously you don’t. You’re talking to the choir here man; don’t take me seriously. The whole thing is stupid beyond belief! Besides, if they manage to squeeze that much extra oil out of the Canadian tar sands (which they won’t) it won’t require Natural Gas for heat, the air temperature will be adequate by then.
Doug
Current extraction is dependent on high prices. The same high prices are unaffordable and are causing the bends around the world … a world built assuming -$20 crude into the distant future.
All that infrastructure is now stranded and credit is taking a beating. How much of a beating? Japan is staring into the abyss and China’s loan-shark economy is deflating.
When China goes into recession all that fancy ‘fracking’, blue-ocean and tar-sands nonsense will be under very deep water. When the ‘savior oil’ gets shut in, there is no $20 oil left to be put into use. It’s all gone.
Steve, Thumbs up.
However, what keeps my up at night, is the danger of third world war. As economies fail, there will be politicians standing on their soapboxes screaming bloody murder and blame everyone else except themselves. They will target foreigners, ethnic groups, and nations. They will rally the masses to go to war with promises and lies. The world can survive 6C 10C or even much higher temperatures. It cannot survive after its been turned into radioactive slag.
I 2nd the thumbs up for Steve. But I don’t think ‘the world’ – if by that we mean global human industrial society, or anything like it – can survive 6C, let alone 10C. We are toast in so many ways…
I strongly encourage all readers to watch the BBC documentary on the Permian Extinction event. You can access it via YouTube. Compelling evidence supporting the view that the extinction event resulted from two temperature spikes of 5ºC each; the first caused by volcanism in the Siberian Traps, the second resulting from catastrophic release of methane from sea floor methane hydrates.
Dennis:
Would be good to have a post just on EF.
Also, perhaps interesting to compare some of your projections to others (if they exist). IEA/EIA, CERA, Hughes, analyst reports.
I have compared my LTO scenarios with the EIA AEO 2013, other sources require guesswork, reading numbers off of charts and putting them in a spreadsheet and such. If you would like to do it, feel free, I can provide spreadsheets with my scenarios to save you some work, but I am unwilling to pull together many different future scenarios, often the latest reports are behind paywalls and I am cheap.
I did a Bakken scenario with USGS F95, F50, and F5 TRR and then used my usual economic assumptions (7% discount rate) with two different price scenarios (on the chart right axis). The dashed lines are the low price cases and the solid lines are the high price cases. ERR varies from 4.3Gb to 11.4Gb (1953 to 2073 output) for the 6 cases. Chart below.
Thanks, I’ll go look at AEO 2013.
The problem with many of these forecasts is that they don’t break out Bakken, Eagle Ford and so forth. You can check out the following:
http://peakoilbarrel.com/when-wil-us-light-tight-oil-lto-peak/
The scenario presented in that post is exceedingly optimistic in my opinion. I created the other LTO scenario out of thin air, I would be quite surprised if the LTO in the US from plays other than the Bakken and Eagle Ford reach the levels in my “other LTO scenario”.
If they could find a way to frack the high clay sediments, that would be a lot of extra barrels, no? (Or somehow otherwise get the oil from them). I have no idea how to do that or if anyone figures it out. But was just thinking that could be a place for research.
Hi Nony,
Think about clay that has not hardened and hitting it with a hammer, would you expect a lot of fractures?
I KNOW that it doesn’t fracture now because it’s a bunch of gooey clay. 😉 The question is…how could we. Or is there some other methodology, non-fracture related to get the oil.
I have no solution and it may be insoluble. But if you could figure it out, it would be amazing, no? Just total goofey brainstorming, but use some mechanical spikes (not hydraulics). Chill it and then fracture it? Dissolve the clay? I really, really don’t think any of those goofy ideas would work or that there is any simple solution…I was just throwing it out as a cool material science problem.
Pencil pushers, geologists, and EOR will allow for greater oil and gas production over time. Welcome to the Profit Lab.
The main variable that the peak oil crowd forgets is Capitalism. As prices go up stripper wells become valuable again, spacing patterns increase with the additional cash flow, and EOR technology comes about to make formerly unprofitable resources profitable. When we were briefly at $148 dollar oil I was reading articles of shut-in wells being brought back on-line to enjoy in the profit taking.
The second thing the peak oil crowd forgets is that good management cuts costs. This allows the strongest to survive if the price of oil goes too low and creates even bigger profits when the markets eventually rebound.
The third and final thing the peak oil crowd forgets is fishing for the worst of last years data to make your point means simply that you are illogical and those you lead are the same. The same can be said of the Chicken Little “warmists” still pushing their “manmade climate change” political and economic agenda in spite of all the evidence showing that warming stopped 16 years ago.
As it has been said by others we are not drilling for oil as much as we are now mining for oil. Technology is always going to improve and always be the game changer by continually increasing the amount of proved reserves.
In some lab right now someone is likely trying to create the strongest yet cheapest proppant to improve production while chemical engineers are working on better fluid dynamics to improve fracs. Right now frac pressures are 8000 to 9000 PSI with schedule 120 pipe. Someday someone is going to invent Schedule 160 pipe and increase the pressure more. Some other game changer is out there too. The nitrogen frac, the tri frac, the larger bore frac, The sonic frac, who knows?
The oil is there and as long as Capitalism prevails it will come our way.
OK, so western Europe is not capitalistic, because oil production is dropping there there 🙂
Here Here! The EIA is a major government organization. How can one think that they are wrong all the time? They certainly have evidence for their model of the world, and it is the most likely way things will pan out. As Ron says for the EIA summary: “No peak until sometime after 2100”.
Don’t worry, Be Happy.
FunnelFan,
Well, according to Dave Demshur, CEO of Core Labs, he believes Global Peak Oil Production will be 2014-2015. Core Labs analyzes drill results from the majors and 100’s of small oil and gas companies throughout the world. If anyone has a good idea of what is taking place in the oil industry, Core Labs is more qualified than most.
I guess you didn’t watch Steve Kopits presentation which he provides data that oil companies need $100, $120 and some $130 to make free cash flow. Management can’t cut costs anymore because all that’s left (for the most part) is low quality, high cost garbage oil. And the market can’t afford high priced oil. So X-NAY on increasing profits.
I see you are still going by OUTDATED CLIMATE DATA. Can’t blame you, most people regurgitate the old stuff over and over again. Arctic is heating 4-6 times the global average. And I don’t know if you heard, but the warming didn’t stop… IT JUST WENT INTO THE OCEAN.
It looks like our buddy and pal EL Nino maybe coming back for some KICKS & GIGGLES, which means it will release the captured HEAT back into the lower atmosphere. If this is the case… we get warming in spades. God hath a sense of humor.
Lastly, the so called 1 trillion barrels of OIL SHALE in the west is another way of deluding simpletons. Shell and Chevron pulled out of their Oil Shale projects as they realize.. can’t make shareholders happy by PRODUCING OIL AT A LOSS.
Maybe more Americans wake up as the Oil Production Gauge starts to head below HALF.
steve
Steve, you’re forgetting, “as long as Capitalism prevails it will come our way”. Who are you to quibble with such powerful logic?
Doug
Doug,
Heavens no…. not me.
Ah… the hell with the environment and all the birds, animals and fishies. I got my money on that FunnelFan capitalism.
Steve
Core Labs CEO thinks we may have arrived at peak oil
He estimates planetary oil production in 2014, 2015, and maybe 2016 to be at the peak level we shall ever be able to generate. When asked about future oil independence here in the US, he just smiled — and added “no chance”.
I grew up in a time when we all believed in ever better times thru technology.We sucked it in with our Mother’s Milk. I still remember the “better days thru better ways” motto from 4H with a smile.
I majored is agriculture at a major university and we were trained to have a technocopian mindset and I had one for most of my adult life.It was easy to believe because I plowed a little with a mule a boy- the mule was my grandfather’s last one and we kept it for sentimental reasons and plowed a few garden furrows with it every year even though our little mountain farms were mostly mechanized by the time I was old enough to reach the pedals on a tractor.
It was easy to believe because those were the headiest of the glory days of the Green Revolution and so far as we were concerned Borlaug was seated pretty close to God.
But we ag guys are basically scientists in the way we work and think and we are necessarily generalists because our lab is the real world where things have to work not only in theory and in the enclosed research building but also in the real world of dollars and cents and rain and wind and sun and depleting natural resources ranging from oil to phosphate rock.
And being generalists most of us got at least some minimal training business and economics.
There is a thing we refer to as the law of diminishing returns.I can grow three hundred bushels of corn on the same acre my great grandfather got thirty or forty by putting in enough effort and resources but it is uneconomic to do so.
Contemplation of the law of diminishing returns and the basic principles of biology that underlie agricultural science has forced me into giving up my cornucopian mindset.
People who are seriously studying energy issues these day are believers in the law of diminishing returns but they refer to it with new words. They speak of energy returned on energy invested. (Sometimes if they are businessmen they may use the phrase energy returned on investment meaning– to them–cash or money invested.This results in some confusion at times in the popular press.)
Those of us who have seriously studied this matter and believe peak oil is a real likelihood in the near to medium term do not doubt that there is a potentially large enough resource of oil in the ground for production to rise for several more decades at least.
But we do understand that while technology may make it possible to recover this oil technology the price of recovering it may well be prohibitive.
Nobody doubts that flying and swimming cars are possible but the cost of building them remains prohibitive more than a century after the invention of the car and the airplane.
Each time we go to a lower quality resource in the ground the cost of recovery necessarily increases barring a real technological revolution.We are now digging vast pits hundreds of meters deep and hauling up the stone in giant trucks and processing many tons of it using up a huge amount of energy and manpower and machinery to get one paltry ounce of gold.
There is a hard limit on how expensive oil can get before it gets to the price the last or marginal barrel is simply unaffordable because we aren’t ever going to be able to pay gold prices for oil.
A hundred years ago the energy return on oil was about a hundred to one. The energy return on tar sands oil may be as high as five or six to one at best and getting that oil to market consumes huge amounts of machinery and manpower that used to never be needed at an oil field.
A typical fracked well consumes many times the materials and energy it takes to bring in a conventional well. This runs up the price of fuel and trucks and pipe and diesel engines and all the other inputs for everybody else that uses these same things for other purposes.
The increase in the price of oil due to the amount of oil that is needed to frack a well is probably too small to even be calculated but a doubling of the price of it in the short term would break every for profit airline in the world.
Now is it possible that aero engineers can double the fuel efficiency of aircraft and thus offset a doubling of fuel costs? Maybe. Maybe not.
BUT it is extremely improbable that they can do so in say five years and no doubt it is impossible to replace the current fleet of aircraft in less than ten to twenty years.
My personal opinion is that history and depletion are going to outrun the technology of oil recovery like a fast freight by passing a tramp. This does not mean that the technology will not continue to improve or that it will always be impossible to recover all that hard to get at oil.
Oil is so valuable a resource that I have said many times I can more easily afford twenty dollar diesel fuel than I can afford to give up my tractors and go back to horses and mules. Some will still be produced when it costs three or four hundred dollars a barrel to get it out of the ground.
The amount we can get out of all the old legacy fields world wide is declining at about four percent annually and the unconventional oil industry has about the same chance as a snowball on a hot stove of growing fast enough to offset the decline of conventional oil because nobody has discovered any truly significant amount of new conventional oil that can be had at current prices for decades now.
The unconventional industry is starting from too small a base in comparison to the conventional industry.
Another doubling of the price of oil will break the back of the world economy and oil production will peak if for no other reason than that the world cannot afford it at the price of marginal production.
Technology is enabling us to increase the efficiency of energy use as well as it is increasing our ability to get at unconventional oil but efficiency can be increased only so fast.We can’t just scrap our existing infrastructure and replace it overnight or even in a decade or even in two decades. It will take over a decade even under the most optimistic assumptions to turn over the automobile fleet.
A simple analogy is that the economy is on the way to the hospital due to oil troubles.There is not too much doubt the technology ambulance can get the patient there –eventually- but maybe not before the patient dies enroute.
And the hospital itself may have the technical expertise to save the patient but lack the resources to do so.We can afford a heart transplant here and there as a society.
But suppose it becomes possible to grow a new heart for every old geezer in the country for a thousand bucks in a heart lab and it still costs mid six figures for the transplant operation?
I can raise apples buying twenty dollar diesel fuel and it won’t break me or the economy because I raise a hell of a lot of apples with just one gallon of diesel.
But the tourism industry wouldn’t last twenty four hours with twenty dollar gasoline and jet fuel.
Peak oil is not a matter of new technology so much as it is a matter of time and depletion and costs.
Mac,
Thanks for the wisdom. It mirrors my own observations of the biomass side of farming.
The concept of marginal cost is something that I have found is very difficult to communicate to people. One of the reasons that the developed world has gone into so much debt is that the marginal cost of maintaining our societies has risen dramatically. As the easy and cheap to develop was exploited, the new resources that are brought on line to expand capacity cost many times what the original resources cost.
The explosion of debt has masked the fact that our current life style and continual growth actually costs more than we can afford. Falling interest rates has allowed the charade to continue for quite awhile but eventually, we will have to live with what can be funded by cash flow. It will be a rude awakening for the developed world.
Woody
With the dual miracles of fracking and horizontal drilling and vast unexplored and untapped sources, like in Asia, the price of oil is not going to go much higher, if any, for a loooong time. Even if it ever actually does, there is always going be oil recoverable at some price.
Alternatives to oil will never work without obtaining inefficient and wasteful government borrowed money subsidies that are just giveaways to leftist special interest groups. This is why Capitalism is the only proven sustainable path forward. Think about it, the only obstacle right now to enjoying cheap and plentiful energy over the next several generations is current government policy. If the government would get the heck out of the way of both extraction and refining, the USA could go from importing nearly half of its unrefined and refined oil to becoming an energy exporter in less than a decade.
Funnel,
Which energy would that be? Not from fossil fuel, Right?
FunnelGuy, have you looked into the effect of Bernanke-style Capitalism on oil fields in Oklahoma that are empty? I have never done that. It would be a good study.
FunnelGuy wrote:
“. If the government would get the heck out of the way of both extraction and refining, the USA could go from importing nearly half of its unrefined and refined oil to becoming an energy exporter in less than a decade.”
Lets suppose you’re right about recoverable resources, which is incorrect, since oil recovery costs worldwide are soaring, even in the least regulated regions of the world.
Socialism and neo-collectivism is now the dominate political movement in Western civilization. In the US, both parties (GOP and DNC) are socialists, they just subsidize different groups. The US is deep in debt and has unfunded liabilities of over 200 Trillion. 26% of all federal revenue is used to pay just the interest on the 17.5 Trillion while interest rates are at historic lows. More than Half of all US household are dependant on gov’t subsidies (food Stamps, Social Security, Wealthfare, Medicare, and Medicaid). There is no way your going to convince a single household to give up their subsidies and return to a traditional capitalism system. There is no way the US is going to dig itself out and there is no way any Washington is going to surrender its power and turn over the reigns back to capitalism. Real capitalism is dead, its now in the hands of the socialists centered around nepotism and capitalism isn’t coming back anytime soon, if ever. To get back to capitalism, will require another round of revolution (ie 1776) and another global war to address the global economic imbalances.
Before you assume that you know more about oil production and capitalism then the rest of the blog members, please take the time to read through all of the the articles posted that contain technical analysis using real data and the comments directly related to them to fully understand the gravity of the situation. Its very rude to make wild assumptions with no data or evidence to support your faith.
FunnelFan,
“…the USA could go from importing nearly half of its unrefined and refined oil to becoming an energy exporter in less than a decade.” The trouble with these tongue-in-cheek comments is someone always thinks you’re serious and a ton of useless dialogue ensues; yes, it happens to me all the time. My advice would be to insert one of those cute little round yellow smiling faces following this kind of “commentary”.
Doug
I used to be a believer in capitalism. I’m just not sure what it means when money is printed whimsically on a global scale by the Fed, the PBOC, the BOJ and assorted and sundry others.
Which is why it’s shaky to think about oil output being dependent on the number of printed pieces of paper created.
Though if you embrace that concept it does make sense. Yes, if oil were priced at $50,000 per 42 gallon barrel and society was somehow configured to endure that, you probably could get natural gas from Titan and GTL it to oil for use. That point is that yes, economics is correct, if the price of something is high enough it will be produced for consumption.
Odds seem pretty high, though, that whereas some US strippers come online at $140, they don’t add more than a few hundred thousand bpd. The world burns 85+ million bpd.
I would like to hear more of your input about fracking logistics, particularly as regards above ground traffic jams by the trucks.
BTW, in a cost perspective, why has no one unionized those truck drivers?
Truck drivers are among the most individualistically oriented people still around.Most of them aren’t interested.
And unions really work- can really work – when the people who might want to be in them work in large numbers for a given employer that can be struck and forced to accept a union.
This does not apply to government employees at all of course.
There is no way to strike a thousand small trucking outfits. If a handful go out, the rest fill in the gap in a heartbeat.And most of those small outfits are family operations to start with.
If you get run over by local small time pizza delivery guy the restaurant insurance pays and if that is not enough the restaurant which is probably a corporation goes bankrupt .
The owners and managers will be making pizza right along with a new name and address in a matter of weeks. Strike a trucking company with a hundred trucks and it will disappear in a few weeks and be reborn in a few months at the longest under a new name with most of the same old customers.
Relations between customer and industry in trucking are very much on a personal basis between the buyer and the person he talks to when he needs a truck for a week or every night for a year driver included.
The only thing that really matters is the credibility of the man who answers the phone at the trucking company.
A few of the bigger companies are unionized from back in the days when routes were regulated and basically the property of whichever company had the regulatory lock on them.But they aren’t doing so well over the long haul in a deregulated environment.
If all that were real there would be no Teamsters.
This is one hell of a lot of union dues not being collected. Surprising they aren’t up there recruiting.
My Daddy was a Teamster for fifty years on a second and third shift job and being a rolling stone I have been a member at various times of some unions myself.
There are many companies that are unionized that own and operate a relatively small number of trucks as part of their own business operations and a lot of those drivers are unionized. But while they are truckers they are not part of what is usually thought of as the trucking industry – the primary business of which is actually running trucks hauling goods for hire for other companies.
There are some unionized trucking companies of course but the business is cutthroat in the extreme and paying union wages and bennies is almost impossible. There is not much a union can do to work with the management to increase efficiency the way it can in some industries such as electrical by running training programs and having a number of guys ready and waiting at the union hall for a short term but very high wage high skill job.
If you want to learn to drive a truck you can have a cdl in a matter of six or eight weeks. It takes at least a couple of years of full time work at increasing skill level and that much more in class room time to become a qualified electrician.
I learned the basics on the farm when I was twelve or so but big for my age and able to reach the pedals and my formal training consisted of riding in a truck a couple of days as as observer and then two days as the driver with the regular driver riding with me. Then I got an appointment at DMV and took the test and walked out with my license – this was about forty years or more ago.
I have mentioned that I am a rolling stone before this.I always worked at something different whenever I could and that was most of the time when I wanted to work.Having a lot of paper work such as a cdl and a pesticides applicators permit and certification to operate a forklift opens doors. Getting this stuff is as easy as pie if you are literate.
Trucking is a highly responsible job in terms of not having an accident but the skill level is trivial except for parking and backing in tight quarters. Getting good at that takes some time like any other physical skill such as playing an instrument .
But anybody with good eyesight and good depth perception can learn to do it.I never got to be very good at it myself compared to the guys who drive for years on end but I always managed
with people laughing at me sometimes for taking too long.All the jobs I ever had driving were short term ones associated with big construction projects but we had a couple of big trucks on the farm in times gone by.Most serious farmers do because it is cheaper over the long run than hiring your hauling done and you can’t ever count on hiring a truck on short notice during busy seasons in farm country.
Teamsters score a win against “sharecropping on wheels.” But will the trucking industry really change?
By Lydia DePillis, Wonkblog, March 22 at 9:44 am
The point is unionizing the enormous amount of trucking in the LTO fields. Not about unions in general anywhere else.
I wanna see what happens if well development prices go up instead of the unanimously presumed down.
“The oil is there and as long as Capitalism prevails it will come our way.”
So, either oil is infinite or Capitalism is toast.
Or you missed the episode of Sesame Street “brought to you by the numbers Finite and Infinite”.
:^)
“all the evidence showing that warming stopped 16 years ago”
Wow. Just wow. Any other words would clearly be wasted…
Ron, thank you for reinforcing my conclusion that the EIA is just a hack organization. Every time I read something like this I try to see if there is an possibility that they are right, I give them the benefit of the doubt that they may know something I don’t, and every time I end up shaking my head at the obvious deception (not ignorance, not carelessness) that is being put forth. And put forth with the imprimatur of a government agency staffed by experts. This report will no doubt be cited time and again by those who wish to believe that there is no looming energy crisis. But that’s what people want to hear. So be it. We are fools.
“It’s easier to fool people than to convince them that they have been fooled.” Mark Twain
Calhoun,
This was the IEA not the EIA. IEA website is http://www.iea.org/ where IEA stands for International Energy Agency. EIA website is http://www.eia.gov/ where EIA is the US Energy Information Administration.
They may both be hacks, I like the information coming from the US EIA, though budget cuts are making the data less timely and the estimates poorer, it is the best we have, not perfect by any means.
Dennis (or anyone),
Do you have any reason to believe data coming from the EIA is inaccurate? For example, would there be any reason to question, for example, that North Slope oil production for Jan. 201x averaged 555,000 barrels per day if that were the number provided in their monthly report(s)?
I ask because (1) I assume the reports are spot on but (2) if they’re not the whole Peak Oil discussion becomes suspect or complicated beyond belief. I do know actual shipments sent down the TAP are subject to rarely discussed variables. For example, complications stemming from water cut treatment availability on rigs, temperature requirements to flow in the pipeline, marketing issues in California, balancing needs among producers, taxation matters, etc. However, to my mind, none of this matters in the mid term: oil is produced, reservoirs decline, profits (or losses) ensue. But I really want to believe the EIA numbers — they matter. I’d like your opinion on this.
Doug
Doug, I have no reason to doubt the EIA on US domestic production. They usually do get the very latest numbers, the numbers that they must estimate, quite a bit too high. But eventually they must lower them to what the oil companies and individual states actually report. That’s why their revisions are usually lower than their original numbers.
As far as the Alaska numbers go, I think they reflect exactly what the state reports to them. And it is quite easy to measure what comes through the pipeline. So the Alaska numbers are likely always accurate and up to date.
The numbers from Texas are the most inaccurate because the Texas RRC is very delinquent in reporting their data. That is likely because the oil companies are also delinquent in their reporting practices.
But I really don’t trust the EIA as far as international data is concerned. Oh they are accurate concerning Norway, Mexico and other countries that report their production numbers. However a lot of nations do not report their data and the EIA just guesses. It is those guesses that I don’t trust. I think they choose to err on the high side. And they usually do.
Ron,
Thanks, That’s more-or-less what I’ve always assumed.
Hi Doug,
I agree with Ron on the domestic numbers, on the international numbers he is correct that the EIA’s numbers aren’t perfect, but I think he would be hard pressed to point to a better source, the JODI data is not very good, BP is ok, but it pretty much matches the EIA data. I think the IEA data is worse than the EIA’s, and OPEC gives pretty good data, but again it doesn’t seem all that different than EIA data.
The International EIA data is definitely not as good as the domestic data, on that Ron and I agree. I still think that overall the EIA data is the best we’ve got, but like all data it is imperfect.
Dennis,
Another thanks. I can sleep knowing domestic production is more-or-less as stated. As for the Arabs I suppose their numbers are sort of OK too, if you’re not talking reserves.
Doug
Dennis, I did not say there was a better source of data than the EIA. For non OPEC there definitely is not. See the below chart for Algeria, EIA and the OPEC MOMR. Now Algeria produces a lot of condensate so there is likely room for a lot of difference. But Algeria has never had those long periods of virtually no change in production like the EIA says they have.
The EIA is just not very good for OPEC and that makes the rest of their numbers for non-OPEC suspect.
Hi Ron,
Which Algeria numbers are you charting from the OPEC report, there are two different sets. As you said, there is the difference in crude vs crude plus condensate.
What is more important to me is OPEC as a whole.
If you compare OPEC crude+ NGLs and nonconventional with EIA C+C+NGL which are the only two numbers which can be directly compared, the number from OPEC is 2141 kb/d higher than the EIA estimate for the third quarter of 2013 (using the secondary sources number). So you are complaining that the EIA is underestimating OPEC output? I think it the OPEC estimate which could easily be questioned, why are they overstating their output by 2 million barrels per day?
EIA 3q 2013 OPEC C+C+NGL=35.8 MMb/d
MOMR 3q 2013 OPEC C+C+NGL=37.9MMb/d, MOMR secondary sources number was used for crude.
I only chart “secondary sources”. The “direct communication” have only been posted for about a year so there is no way I could post those.
But: Here are the figures I get in kb/d for 2013. The EIA numbers are the average for the first 10 months. OPEC Crude Only average for 2013 was taken directly from the MOMR
OPEC Crude Only 2013
The data does not include process gain, only crude, NGLs and other liquids.
But the difference is 152 kb/d not the over two million you came up with.
But my complaint is the EIA data, for several nations, never changes for many months at a time. Look at Algeria in my chart. Does that look realistic? No, they are just guessing.
I have no idea how you came up with 37.9 mb/d. I could not find that figure anywhere in the MOMR.
Hi Ron I took the 3rd quarter numbers from MOMR Crude+NGL(and non-conventional) and compared it to the EIA’s 3rd quarter numbers.
The EIA sometimes estimates output, when they think it hasn’t changed a lot, they leave the estimate the same, big deal. They are still the best data source by far, IMO, though the budget cutting in Washington, especially the big cut in 2011 for the EIA budget has certainly not improved the data coming out of the EIA, we probably agree on that point.
On the EIA 3rd quarter numbers I included only crude plus condensate and NGL (C+C+NGL), I did not include other liquids.
So my comparison was third quarter 2013 from MOMR to third quarter 2013 for EIA C+C+NGL.
EIA third quarter 2013 OPEC
c+c=32.2 MMb/d
ngl=3.6 MMb/d
c+c+ngl=35.8 MMb/d
MOMR (I think I mistakenly used the direct commumication number, my mistake, sorry) 3rd quarter 2013
crude 30.4 MMb/d
NGL 5.8 MMb/d
crude plus NGL=36.2
and the direct communication number is about 37.9 MMb/d.
The OPEC and EIA totals are pretty much the same, with EIA slightly lower than OPEC (0.4 MMb/d).
The EIA is much less focused in international data, when the shale boom starts to reach its peak (2014 to 2017 is my guess), the EIA may once again start to pay more attention to international energy data.
MOMR (I think I mistakenly used the direct commumication number, my mistake, sorry)
A good practice to follow is when you get numbers that look impossible, they probably are, so go back and check again before posting.
Those “direct communication” numbers are impossible, especially for Iran and Venezuela. They both have a political ax to grind and grossly overstate their production numbers. The EIA, to their credit, ignore those numbers.
Hi Doug,
Ron said:
“They usually do get the very latest numbers, the numbers that they must estimate, quite a bit too high. But eventually they must lower them to what the oil companies and individual states actually report. That’s why their revisions are usually lower than their original numbers.”
In the case of Texas I have been following EIA and RRC data pretty closely since Dec 2012 and so far, the EIA estimates have been pretty good, maybe this will change in the future. I am referring to the data in the Crude Production data found at the link below:
http://www.eia.gov/dnav/pet/pet_crd_crpdn_adc_mbblpd_m.htm
A chart of TX C+C in kb/d from the EIA downloaded in Jan 2013, Mar2013, Aug2013, and March 2014 is charted below, the downward data revisions have been pretty small over the last 14 months.
Dennis,
Thanks once again, that’s actually encouraging. This may be (probably is) a dumb question. When you look at EIA Gulf Coast production, is that Texas, or some other state, oil? In other words, who gets the taxes from oil and/or gas produced in the Gulf? Being a Canadian US Federal vs State is kind of a mystery to me; actually it’s a total mystery to me.
Doug
Doug,
There are no dumb questions in my opinion. Though some answers are better than others. (This answer is really a guess, so not very good.)
I am not sure what you mean by Gulf Coast Production. There is PADD 3 Federal Offshore, is that what you are referring to?
If so, those areas are controlled by the Federal Government and I believe that no royalties are paid and any taxes would go to the Federal government. I believe the leases are bid at auction and there may not be any production taxes, just the normal corporate taxes, but I am unsure about this, maybe Ron knows, he knows a lot, probably more than me [on that point we might even agree 😉 ]
Dennis wrote: If so, those areas are controlled by the Federal Government and I believe that no royalties are paid and any taxes would go to the Federal government. I believe the leases are bid at auction and there may not be any production taxes, just the normal corporate taxes, but I am unsure about this, maybe Ron knows.
No, I do not know. But I would bet my bottom dollar that you are dead wrong on this issue. There is no way that BP only pays corporate taxes on oil they recover from US territories in the Gulf of Mexico. Call it royalties or call it a “per barrel tax” but they pay something other than normal corporate taxes.
Think about it. If for some reason BP had a huge disaster… now don’t laugh, that could happen. 😉 And because of the huge cost of this disaster they would show a loss on all US operations. Then they would pay nothing at all because they had no profits.
Hey, let’s research this thing and see who is closer to the truth. Perhaps someone reading this already knows the answer. If so, please reply.
I will defer to someone wiser than myself, as I said Ron knows more than me.
Dennis,
I disagree, it’s a dumb question. What I refer to MUST be Federally owned, by definition! I guess Alaska may somehow be an exception? In Canada, everything involving tidal water is owned/controlled by the Feds but sometimes they feel guilty and toss a few crumbs to the closest Province. No idea what PADD 3 means.
Doug
Ron/Dennis,
OK, I’m ‘way beyond my depth so hereby withdraw from this discussion. Except for one question: Is it possible when Alaska joined the union the state somehow kept some (taxation) rights to offshore territory? You guys seem to have a complex system w.r.t. state vs federal jurisdiction.
Doug
I will hazard a guess here that the definition of ” Gulf Coast production” is not a well defined term but that in most cases it is intended to mean the shallow water production in state waters of all the states that touch on the Gulf. It may or may not be meant to include any shallow water production in federal waters if there is any.
It may or may not be intended to include land based wells near the coastline.
BUT this is only a guess based on my impression from reading various articles about the oil business and the economy.
The same term”Gulf Coast” is used to refer to farms a hundred or more miles inland in the farm news.
I do believe it is a very poorly defined term that may mean almost anything depending on who is using it.
Mac, Thanks for the thoughts.
What got me going on this is the EIA monthly production report entitled: “Federal Offshore Gulf of Mexico Field Production of Crude Oil” which comes out monthly and I suddenly realized that I don’t know what that means. Now you mention shallow water possibly not being part of the bigger picture. Think I’ll just admit ignorance and move on.
Doug
It varies by state, but natural resources close to shore (3 or 4 miles) are controlled by the state. Outside of that would be federal. The Feds like all mineral rights owners gets a share of the revenue.
Non-OPEC oil production by region from 2000 to 2014
This is one of the more interesting graphs I’ve seen recently, if only because of it’s format. Wish they had one just like it for OPEC. In any case, the message is clear – if not for unconventional (i.e. expensive) oil from North America and Russia’s 90’s comeback (peaking soon, if not already), the past ten years have been been pretty poor for Non OPEC production. In my opinion, we are now reaching the great inflection point — infill drilling, tertiary recovery, capital intensive LTO, and tar sands are all reaching their limits for papering over the depletion of the aging giants which have supplied us for decades.
On the other hand, there’s always kerogen.
The chart is “Total Liquids”. That is it includes Natural Gas liquids or what I like to call “Bottled Gas”. They call it oil, I call it gas. For instance they show Asia and Oceania still increasing when they actually peaked in 2010 and have declined almost half a million barrels per day since then. Here is what Asia and Oceania looks like when you don’t count bottled gas. The data is from the EIA, Crude + Condensate.
Absolutely correct, thanks for the clarification. Once again the NGL component clouds the reality.
Here’s a chart for World C+C+NGL using EIA data, the barrels of NGL have only 70% of the energy of an average barrel of crude so they have been discounted by 70%( ie 1000 barrels of NGL are converted to 700 barrels of oil equivalent(boe).
Chart below is a 12 month centered moving average of World C+C+NGL in MMboe/d from July 2000 to May 2013.
And for those who prefer a zero scale chart.
and a final chart with annual data from 1982 to 1999 added.
Note from 1992 to 2012 (20 years) output increased by 17 MMboe/d. If the linear trend since 1982 continues for 20 more years at the same rate of increase, we will reach 100 MMboe/d of C+C+NGL output by 2033, not too far from the IEA 2035 New Policies Scenario.
Personally I doubt we can maintain this linear rate of rise, but if prices rise enough we may be able to get to 90 MMboe/d of C+C+NGL and maintain a plateau for 10 to 20 years.
If the rise in real oil prices stays at a 5 to 6 % annual rate of increase (vs, the 12% rate of increase in real oil prices since 1998), then a world wide economic crash might not ensue.
The high real oil prices would then encourage substitution of electricity (from wind, solar, geothermal, and nuclear) for liquid fuels, along with some natural gas (until that starts to run short, probably 10- 15 years after the decline of oil output).
People respond to prices. Gasoline at $7/gallon or higher with carbon taxes will make people rethink their vehicle choices and demand better public transportation in densely populated areas.
Dennis,
I know the very good reasons for not using zero-based charts unless the data themselves go that low, and I agree with them, but, you know, that zero-base that you give sends a message that has an impact for me. Thanks for including it.
Synapsid,
Your welcome. The zero based chart is dramatic, but I agree with Ron that it makes it hard to see the changes in output over time, which is what we are trying to track.
I also agree with your point that it shows more clearly how slowly output has been rising since July 2000.
Is There No Limit To Human Wastefulness?
The Kingdom Tower Begins Construction on April 27th to Become World’s Tallest Building
Other sustainability features including natural air cooling from the top of the tower due to the arid environment of the region such as the Burj does in taking in the cooler air from the top of the building to use in the air conditioning of the tower. The condensation from the system will also be recycled for irrigation and other uses through the building.
Sustainability features!?!? Clearly, that word has lost all meaning.
Meanwhile, the press reports this crazy logic:
Saudi Arabia will rely mostly on fuel oil to run power plants when annual demand peaks this summer, enabling the country to burn less of its crude and keep more for export, according to consultants Energy Aspects Ltd.
Hooray! KSA gets to burn expensive imported refined fuel oil so they can export more lower value crude! No wonder they can afford to waste money on pointless buildings. (Actually the building has a very big point at the top!)
Calhoun, there is something very wrong with this story. The authors are using the wrong term. They are saying “fuel oil” when they should be saying “bunker fuel”. True both are fuel oil but they have totally different meanings in Western language terms.
Saudi gets a lot of bunker fuel from its refineries but not enough so they must import more. Bunker fuel is the sludge left over when all the good stuff like gasoline, diesel and kerosene have been removed. It is what ships use in their boilers. It is the favorite boiler fuel worldwide where a liquid fuel is required. And it is a lot cheaper than the fuel oil a lot Westerners use to heat their homes.
Ron, The Shoaiba power-desalination plant is an oil-fired complex in Saudi Arabia on the coast of Red Sea. This is the world’s largest fossil fuel power plants and the world’s third largest integrated water/power plant. There they do say it uses fuel oil but you are correct, it is in fact bunker oil — by our definition. Apparently it will be converted to gas at some point, after pipelines are built.
Doug, this is a subject that I know something about. I worked for five years in Saudi Arabia and two of those five years I worked at the Ghazlan Power Plant just north of Ras Tanura. That was Ghazlan 1. Ghazlan 2 was built long after I left in 1985.
All Saudi power plants, and evaporation desalination plants, as opposed to reverse osmosis desal plants, can use either gas or oil, they do not need to be converted. They do use different burners. When they are burning oil they have spray heads that telescope out into the center of the boiler. But when they are burning gas the gas is injected right from an orifice in the wall of the boiler.
At Ghazlan we burned gas at least 90% of the time. Mostly we burned methane but occasionally would burn ethane. The oil burners however would burn anything. Usually we burned bunker oil but could burn straight unrefined crude. Once we burned naphtha. That was a product of the refinery and I guess they had more of the stuff than they could sell.
But we never burned fuel oil, which is basically kerosene. Kerosene is far too valuable a product to use as boiler fuel.
Ron,
I was there a few years back for a plant opening at the invitation of Siemens and was told their systems can burn pretty much anything, by design. It seems the Saudis really do want to fuel turbines with gas as much as practical but often oil (in some form) is “convenient” and after plastic bags, bunker fuel must as close to rubbish as you can get. Anyway, thanks for the info update. It’s refreshing indeed to get facts first hand.
Doug
In regard to the remaining supply of post-2005 Cumulative Net Exports (CNE) from Saudi Arabia and the (2005) Top 33 net oil exporters, the question is not whether we have depleted the volume of post-2005 CNE, the question is, by how much?
My contention is that the actual rates of depletion in remaining post-2005 Saudi and Global Cumulative Net Exports of oil are vastly higher than almost anyone believes. Four graphs follow, including a new graph for Saudi Arabia.
Export Land Model
Following is a graph showing normalized values (year 2000 values = 100%) for “Export Land,” a simple mathematical model which assumes a production peak in the year 2000, with a -5%/year rate of change in production and a +2.5%/year rate of change in consumption. At the production and net export peak in the year 2000, the ECI ratio (ratio of production to consumption) was 2.0, or consumption was equal to half of production.
The Export Land Model (or ELM) demonstrates that given an ongoing production decline in a net oil exporting country, unless they cut their consumption at the same rate as the rate of decline in production, or at a faster rate, the resulting net export decline rate will exceed the production decline rate, and the net export decline rate will accelerate with time. Furthermore, if the rate of increase in consumption exceeds the rate of increase in production, a net oil exporter can be come a net importer, prior to a production peak, e.g., the US and China.
Six Country Case History
Following is a graph showing combined normalized values (year 1995 = 100%) for the Six Country Case History (Indonesia, UK, Egypt, Vietnam, Argentina and Malaysia). These are the major net oil exporters, excluding China, that hit or approached zero net oil exports from 1980 to 2010. Note that even as their combined production rose by 2% from 1995 to 1999, they had already shipped, by the end of 1999, more than half of their combined post-1995 CNE (Cumulative Net Exports).
Note that estimated post-1995 CNE, based on the seven year 1995 to 2002 rate of decline in the ECI ratio, were 9.0 GB. Actual post-1995 CNE were 7.3 Gb (billion barrels).
Saudi Arabia
Following is a graph showing normalized values (year 2005 values = 100%) for Saudi Arabia. The first three lines are actual data. The fourth line, Remaining post-2005 CNE by year, shows the estimated values. Estimated Saudi post-2005 CNE, based on the seven year 2005 to 2012 rate of decline in the Saudi ECI ratio, are about 56 Gb.
I estimate that Saudi Arabia has already shipped a little more than one-third of their post-2005 CNE, in only seven years (through 2012).
(2005) Top 33 Net Oil Exporters
Following is a graph showing the normalized values (year 2005 = 100%) for the Top 33 net oil exporters in 2005 (countries with 100,000 bpd or more of net exports), which I define as Global Net Exports of oil (GNE). As with the Saudi graph, the first three lines are actual data. The fourth line, Remaining post-2005 CNE by year, shows the estimated values. Estimated (2005) Top33 post-2005 CNE, based on the seven year 2005 to 2012 rate of decline in the Top 33 ECI ratio, are about 530 Gb.
I estimate that the (2005) Top 33 Net Oil Exporters have already shipped about one-fifth of their post-2005 CNE, in only seven years (through 2012).
One final note about “Net Export Math.”
The model and the empirical case history show that the rate of depletion in post-export peak CNE (Cumulative Net Exports) exceeded the rate of decline in the post-export peak ECI ratio, i.e., the remaining cumulative supply of net exports fell faster than the rate of decline in the ratio of production to consumption.
This implies that the rates of decline in post-2005 Saudi and Global post-2005 CNE exceed their respective rates of decline in their ECI ratios.
The seven year (2000 to 2007) exponential rate of decline in Export Land’s ECI ratio was 7.8%/year. The seven year (2000 to 2007) exponential rate of decline in remaining post-2000 CNE from Export Land, i.e., the exponential rate of depletion in post-2000 CNE, was 43.0%/year.
The seven year (1995 to 2002) exponential rate of decline in the Six Country ECI ratio was 2.7%/year. The seven year (1995 to 2002) exponential rate of decline in remaining Six Country post-1995 CNE, i.e., the exponential rate of depletion in post-1995 CNE, was 26.0%/year. (Based on the seven year, 1995 to 2002, rate of decline in the Six Country ECI ratio, the estimated Six Country post-1995 CNE depletion rate was 17%/year).
The seven year (2005 to 2012) exponential rate of decline in the Saudi ECI ratio was 4.9%/year. The seven year (2005 to 2012) estimated exponential rate of decline in remaining Saudi post-2005 CNE, i.e., the estimated exponential rate of depletion in post-2005 Saudi CNE, was 6.6%/year.
The seven year (2005 to 2012) exponential rate of decline in the (2005) Top 33 ECI ratio was 2.0%/year. The seven year (2005 to 2012) estimated exponential rate of decline in remaining Top 33 post-2005 CNE, i.e., the estimated exponential rate of depletion in post-2005 Top 33 CNE, was 3.4%/year.
I tried finding that report, but it is paywalled. 🙁
I would actually be interested in the report itself, not just “why peakers disagree”.
What report? Nony, you need to click on the “reply” button right under the post you are replying to, not just start typing in the “Leave A Reply” box at the bottom of the page.
But Why do peakers disagree? That depends on what points they disagree about. No person earth likely agrees with any other person on earth on everything. So the point of contention is very important. So if you will give me the point you think peakers mostly disagree on then I might give you an opinion. Then again I might not. 😉
I’m referring to IEA World Energy Outlook 2013, the subject of your headpost. The report costs 150 pounds. I couldn’t find a free copy online.
There is a superb article up at Wired today about coal and carbon capture and storage.
I have never seen a better one.
http://www.wired.com/wiredscience/2014/03/clean-coal/
Mac,
Agreed, very interesting. I spent about seven years is China and, to a degree, keep abreast of stuff going on there. It really bugs me to continually hear: “China is crap”. For every engineer trained in America 20 graduate from Chinese universities and there is a strong Chinese presence in every significant school in the world. Furthermore, the average engineer in China is as capable as the average one here in the west. Another fact people seem to ignore, or not be aware of, is that most leaders in Asia are engineers as apposed to lawyers. I’m prejudiced in this matter but in my mind engineers are schooled in the idea: do it once, do it right; lawyers aren’t. Having said that I would be the last person alive to say there aren’t huge problems in Asia, huge beyond comprehension. But, there are also a vast number of capable people working toward solving problems as well. The article you have cited is an excellent example of this. Thanks.
Doug
Doug, I think you are being overly sensitive to any Chinese criticism. Nowhere in the article did anyone say that “China is crap”. The article was highly critical of China’s continued increase of coal use. And I think that criticism is justified. The article, otherwise, actually praises China:
Nowhere is the preeminence of coal more apparent than in the planet’s fastest-growing, most populous region: Asia, especially China. In the past few decades, China has lifted several hundred million people out of destitution—arguably history’s biggest, fastest rise in human well-being. That advance couldn’t have happened without industrialization, and that industrialization couldn’t have happened without coal. More than three-quarters of China’s electricity comes from coal, including the power for the giant electronic plants where iPhones are assembled. More coal goes to heating millions of homes, to smelting steel (China produces nearly half the world’s steel), and to baking limestone to make cement (China provides almost half the world’s cement). In its frantic quest to develop, China burns almost as much coal as the rest of the world put together—a fact that makes climatologists shudder.
That being said, I think China’s leadership, the Chinese Communist Party, actually deserves a lot more criticism than it gets. They are corrupt to the core and, I believe, they are leading China down a path that can only lead in its ultimate financial collapse. They are building, with borrowed money, millions of office buildings, office space, apartments, malls and whole cities, that no one will ever occupy. But they must keep building and keep borrowing or the economy will collapse. So they do.
Ron,
Just to clarify, the China-is-crap comment stems from people I meet, in general, and not anything to do with your Blog.
You are correct regarding corruption, but it’s goes far beyond the Communist Party, who are guilty as charged. I can say, without ANY exaggeration: NEVER once have I attended a meeting in China, (Indonesia or several other places) where money wasn’t being handed out in envelopes between people for God knows what: for everything I guess. It’s THE way-of-life and those involved have no conception of the self destructive process it is. This is probably the biggest problem Asia faces and the scale is beyond belief.
Doug
More and more ethane being rejected into natural gas (heating/power) because there is not enough North American petrochemical demand for it and it’s hard to export:
https://rbnenergy.com/changes-in-longitudes-ethane-exports-to-europe
Wonder if anyone would comment about these very disturbing graphics.
By the way, this is my first comment. Hope these links works properly. Can’t wait to hear your comments!
And I guess I can ‘safely’ say for all of us that are no commenting: Thanks for this great site. Amazing work and commitment on informing all of us, here. We appreciate.
Please, lead on:
http://www.eia.gov/dnav/pet/hist/LeafHandler.ashx?n=PET&s=A103600001&f=M
http://www.eia.gov/dnav/pet/hist/LeafHandler.ashx?n=PET&s=MGFIMUS1&f=A
http://www.eia.gov/dnav/pet/hist/LeafHandler.ashx?n=PET&s=MGFEXUS2&f=M
First graph: the refiner’s don’t do retail anymore. Not enough money and the liability of leaky storage tanks at gas stations became too great. Refiners sell more to wholesalers now.
Second graph: with the shale bubble the Barely Crude Oil that is being produced has a proportionally large gasoline fraction. Lots of BCO times a bigger fraction means lots of gas being produced.
Third graph: flip side of the second graph.
Just my somewhat informed take. Others may be able to offer a better informed reasoning.
Naw, you hit the nail on the head Aws. Refineries are just getting out of the retail business. And refineries here in the USA are producing a lot more gasoline but selling it wholesale and exporting a lot more of it.
So, see if I got it right:
US gasoline wholesale peaked in 2005 [see link below] at around 344.106
http://www.eia.gov/dnav/pet/hist/LeafHandler.ashx?n=PET&s=A103700001&f=M
Would anyone know why EIA stopped collecting/reporting wholesale gasoline in 2006?
Also, I wondering if US gasoline production/consumption is declining faster than conventional oil… even that US has shale oil, if that should be called oil. And, perhaps, some Canada’s tar [oil] sand.
And of course, US’s remaining conventional oil.
Hmmm. Before I forget: Thanks for the wholesale heads-up!
http://www.eia.gov/dnav/pet/hist/LeafHandler.ashx?n=PET&s=WGFRPUS2&f=W
This is the relevant Gasoline chart.
I just watched “The Usual Suspects”. Cool screen name.
Another chart with 53 week centered moving average of net refiner and blender finished gasoline output EIA weekly data 1982 to 2014 chart below.
Rate of increase has slowed since 2007.
I realized that the US imports some gasoline (and we export as well and we don’t have data over the entire 2007 to 2013 period on gasoline exports). So I found consumption data for gasoline from the EIA:
http://www.eia.gov/dnav/pet/hist/LeafHandler.ashx?n=PET&s=MGFUPUS2&f=M
I downloaded the excel file so I could smooth out the seasonal fluctuations with a 13 month centered moving average. US gasoline consumption has decreased since 2006, so there has been some reaction to increased prices (though some of the reduced consumption may be due to reduced economic activity).
I read my chart incorrectly, the decrease has been since 2007 not 2006.
The following only covers 1973 to 2013 the fall in consumption looks more dramatic on this chart, otherwise same data as above.
That chart is for total US consumption. In the last 40 years population has gone up by nearly 50% so per capita consumption is falling more steeply than that chart shows.
Hope this link works.
http://iansurbanblog.blogspot.co.uk/
Failed to embed image in page. Follow link and scroll down .
Drought drives up female slaughter rates
stockjournal.com.au, 24 Mar, 2014 07:20 AM
Stumbled on this indirectly from above article…
Peter Whip: Climate champion
Meat and Livestock Australia
I guess they are catching up down under or should I say adapting to changing conditions because I don’t know anything about raising cattle there other than it requires strategies for hot and dry.
But we were teaching breeding heifers as young as possible fifteen or more years ago in this country when I was working as an agriculture teacher in a rural high school.
It is a very profitable strategy so long as the heifer doesn’t die on you giving birth.High birth weight calves grow out faster and cheaper so you breed mature cows to bulls that father that trait.But a low weight calf is more profitable given that it is born to mother up to a year younger than usual.(Some cows must be rebred , they don’t always catch.)
Modern farming is about spreadsheets to an extent that surprises most people.
Modern everything is about spreadsheets to an extent that surprises most people. I know this is what is happening behind the scenes at the organic farm that delivers my grass-fed steak at an affordable price, but this sub-thread just gives this non-farm-boy the willies….
More confirmation of Jeffrey Brown’s oil export model:
http://www.bloomberg.com/news/2014-03-25/russia-s-black-sea-oil-flows-declining-as-baltic-cargoes-gain.html
Oil & Gas Journal: Financial questions seen for US shale gas, tight-oil plays
http://www.ogj.com/articles/2014/03/financial-questions-seen-for-us-shale-gas-tight-oil-plays.html
This, Jeffrey’s link above, is quite interesting.
“While most of the companies that have made write-downs are not quitting, many players in this industry have already noted that the revolution is not as technically and financially attractive as they expected,” the analyst writes.
According to the Energy Aspects analysis, total capital expenditure nearly matches total revenue every year, and net cash flow is becoming negative as debt rises. Other financial indicators “add to concerns about the sustainability of the business,” Sandrea says.
Below ground, he says, rapid production declines and low recovery rates, despite technical improvements, remain problems in many plays and might worsen as operators move into increasingly challenging acreage.
Unless financial performances improve, capital markets won’t support the continuous drilling needed to sustain production from unconventional resource plays, Sandrea suggests, asking, “Who can or will want to fund the drilling of millions of acres and hundreds of thousands of wells at an ongoing loss?”
Ron and Jeff,
I think you’re forgetting something: “The oil is there and as long as Capitalism prevails it will come our way.” And, for the record: I don’t know how to add those little yellow faces!
Doug
Pieces of paper are not going to get in the way of preventing starvation.
If societal collapse looms from . . . whatever . . . the government will decree by executive order that in some way profit is achieved. No one in Congress or anywhere else will act to stop such a thing and the Fed will provide whatever money is needed for the trucks to roll.
Rational thought about price and economics ceased to be operative in 2009.
Replying to myself to be more clear.
If companies are leaving LTO because it costs too much, then oil ouput will plummet and it’s VERY likely that this can’t be tolerated in a post Taper economy.
And so it won’t be tolerated. If output falls to 600K bpd, you will have the interesting event of Democrats advocating giving money to oil companies to maintain trucker employment, and perhaps Republicans objecting to it as another manifestation of government corruption of capitalism.
Smiley faces. Just do it the old way, a colon, :, a minus sign, -, and a close one of these thingies, ), I cannot spell it even with my spell checker. 😉 A semicolon gives a winking smiley face. And the program automatically converts it to a yellow smiley face. At least it works for me but I don’t know if this is something that only works for administrators. But it doesn’t matter. Even doing it the old way we know that it is a smiley face.
Hi Doug,
Just a semi colon followed by a right parenthesis or colon followed by a right parenthesis will get you 😉 or 🙂 you need to leave a space on each side of the thing for it to work with no space between the colon or semicolon and parenthesis.
I suppose the cornucopians expect to make it up on volume rather than making a profit per barrel. Sarcasm light ON.
I read a piece on an economics site a few days back about peak oil being nothing to worry about since if all else fails it is possible to manufacture oil out of coal and we have plenty of coal.
And this is actually technically true in both respects- it can be done and we have coal enough to do it for quite some time -if the economy can support the necessary price.
That seems very doubtful to me but on the other hand I am neither an engineer or an accountant and have no knowledge of such matters other than whatever rough estimates I have read.
But it seems the Chinese have built a modern coal to liquids plant or maybe two or three of them so they are evidently of the opinion that if they want enough synthetic liquid fuel to run their economy they better at least have a sound experience based estimate of the cost of manufacturing it.
I will venture a wild axxed guess that if the coal and labor are both cheap the cost of synthetic gasoline and diesel probably aren’t going to be more than twice the cost of the ordinary kind all things considered at this time .
And in a few years- given the likelihood of peak oil- it may be that coal to liquids may be cost competitive if the economy doesn’t collapse first.
Everything depends so much on how fast the price of oil goes up that it is impossible in my opinion to more than guess and speculate about such matters.
But while the cheap oil based western economic model is a doddering old man threatening to wind up in a nursing home anytime or actually keel over dead a developing economy such as China might be able to handle another doubling in the price of oil if given time.
The Chinese government is powerful enough to redirect development into mass transit and energy efficiency in a way that is totally out of the realm of political reality here in the US.
And while those of us trained mostly in finance and business administration and banking and economics may think the collapse of their banking industry will destroy them it won’t- not necessarily.
It just means the people who are supposedly rich right this minute are not actually rich. So far as I can see the Chinese don’t owe much of any consequence to any other country.Not in comparison to their accounts receivables at least!!!!!!
Look at their situation as if they were all in a life boat with plenty of food and water but they get to playing poker and a handful of the people wind up owning all the food and water.
That handful aren’t going to eat and drink it all by any means whatsoever. The rest of the people on the boat may tolerate their having a larger share but over the side they will go once they try to hog it all. Or alternatively, into the cooking pot assuming there is any fuel on board to cook with.
The vast tracts of empty houses in China aren’t going to sit empty forever. Only an idiot could believe in such foolishness. The super inflated prices of those houses will deflate like a childs toy balloon and they will be occupied by people who can then afford to live in them.
Every body who worked on building them in any respect at all got a living out of the building of them in real time in the sense that they had a roof over their head and clothing on their back and food in their belly while the building was happening.
Nobody has actually lost anything except a fortune in markers he could have spent on something else if he had been wiser. But people with fortunes are seldom so foolish as to lose every last dime so that they starve. They are going to wind up older and wiser and still in most cases wealthier than they were when the boom started because most of them at that time had nothing at all beyond the clothes on their back and their skills and work ethic.
They will still have the work ethic and the skills and they will be considerably wiser to boot if not as young as they used to be.
Money ain’t nothing but a marker once you understand the reality of it.
IF you don’t see it look at what Hitler accomplished in well under a decade in a country that was absolutely busted in terms of conventional thinking.Of course what he did accomplish didn’t do either him or anybody else any good but the point is that he did succeed in putting every body to work and increasing production in a way that was believed to be impossible and is still believed to be impossible by most observers.
Ivy League professors are as perfectly capable of ignoring inconvenient facts as backwoods preachers.
Too bad it was mostly war materials and war skills.
But the point is that he did it without much of anything in terms of a finance and banking sector.He did it with real three dimensional tools and raw materials and people.
NOT MONEY.
If the Chinese can double their energy efficiency they can afford coal to liquids. And given time they may be able to pull it off. We can too but it will take us a lot longer because we will not change our ways until circumstances force change on us whereas the Chinese are most likely to be proactive as they deem it necessary.
Assuming they don’t miscalculate.
BUT at least they are calculating.
We aren’t.
From what I can put together, the price point for CTL will be around $150/brl. which will end up forming a cap for all competing forms of energy. Renewables and nuclear have a relatively small window of financial feasibility.
That is ”close enough for government work” to my guess as to it costing twice as much as conventional oil.
Hi Woody,
I have seen much lower estimates (around $70/barrel) for CTL, where did you see the $150/barrel figure? I searched but I couldn’t find such a high estimate anywhere. I assume that is $150/b in 2013$ (a real oil price), is that correct?
DC,
The $150/b is a rough number I put together based on reading multiple reports from government and industry, observations of how existing and planned GTL and CTL plants have done, and watching where industry puts its money.
At $70/b I would think you would already see a lot of CTL plants in countries with coal reserves and balance of payment problems and/or week currencies. Other than South Africa, due to the embargo, you don’t see much going on yet with CTL.
The CTL price point is important in the renewable energy area as it will dictate what types of projects are ultimately cost effective, at least without regulatory interference.
Woody
DC,
The $70/b cost you sight may represent the capital and operating costs of a model syngas conversion plant that doesn’t include the cost of the syngas itself. Whether using coal imported to the plant or syngas from gasifing an in situ coal seem there is a cost for the raw material for the plant.
If there was really a 70/bbl opportunity, would think capacity would go in. I guess there might be worry about prices dropping preventing a huge capital asset being built, but think someone would go ahead…like even a coal company.
I am not sure those empty Chinese cities will ever be filled. Cities need an economy to support them. All the cities in the uk were abandoned when the Romans left. No food, no cities.
Well, the Chinese will live in them temporarily at least.
For what it is worth I expect them to have an empire similar to our own and to be able to project force in their own corner of the world in the same way we do to protect their interests – which will include ownership of millions of acres of prime farm land in many places outside China’s borders. Likewise shares in oil fields and mines of many sorts, oil refineries, hydroelectric plants, etc.
They are buying all these things legally and when the time comes they are going to feel justified in defending that ownership.I doubt if there will be anybody in a position to stop them from doing so.
They will not have a starvation problem within the next few decades unless the climate gets too crazy. They may not be getting as much meat as they want but they have proved in the past that you can live on a bowl of rice and an egg and a little fruit and some local veggies.
They have either already built the worlds most ambitious water systems in terms of moving a lot of water a long way.
And the government is authoritarian in a good way in some respects such as making sure of long term basic needs if for no other reason than that is the best way to assure its own survival.
That should read ” They have already built some of the worlds most …. ” and have more under construction.
The PBOC can print money just as readily as the Federal Reserve. You don’t have to have an economy to do ANYTHING. If your society depends on those cities being filled, then filling them will be funded.
Economics is all gone now. And it’s never coming back.
There aren’ t any free lunches in the real world. There are tradeoffs and ”both sides lose ”games and zero sum games and ”win win” games and multiparty games out the ying yang that have so many winners and losers and ”we broke even’s” that Sky Daddy alone could sort them out.
But in the end any money the government spends- any government at all in my own estimation- is properly defined as tax revenue.
The trouble with understanding ” fiscal stimulus” is that we are mostly used to thinking inside the conventional boxes built by the conventional experts and that is sure to trip you up when it comes to truly understanding how things really work.
Taxes can be collected in two very basic ways- one is to actually levy and collect them and that is as far as most people are able to think and see.
But taxes can also be collected in the form of deficit spending that is unsupported by the actual buying of government debt with existing money .
When Uncle Sam sells a bond and one of us as an individual or institution buys it with money we actually have that transfers our money from us to the government and it does not change the amount of money in existence and therefore does not change overall prices much and theoretically not at all.
(Depending on ”what” the government spends it on the price of ”that” may rise and since we aren’t spending it on ”something else” the price of that ”something else” may fall.)
The second basic way the government can get money is thru the collection of taxes by means of counterfeiting the money. I realize this is a jump in terms of defining terms but in the end it needs to be made. Government cannot ever spend money it did not in some fashion collect from citizens and businesses because there just ain’t any free lunch and ”money” -meaning the ability to command real honest three d resources and people– can’t be magically produced.
Money is only a marker for real goods and services just like poker chips are markers for real green currency.
We need one single term for ”guv’mint”money and tax is the accepted word. It is too late to change it.
When Uncle Sam spends money he doesn’t have on things he wants or wants done the cost of his doing so is collected in the form of an inflationary tax on every body else other than the recipients of that money.
Now most people will immediately and maybe even violently object that if this were the case then there would be a lot of immediately noticeable inflation.
There is not a lot of inflation in evidence and so OFM must have been at his own private stock of gasoline stretcher right?
Well, not so fast guys. We all are smart enough in this forum at least to understand statistical noise and simple negative numbers. I have an electrical account that I pay only every six months or so as a matter of convenience in advance because it is only fifteen bucks a month. When the bill come it shows a negative ”balance owed” owed for four or five months and then I send a check for another hundred.
We understand that wind power cuts into the sale of coal and natural gas and therefore has THE EFFECT of depressing coal and natural gas prices- but that other things influence the prices of coal and natural gas in the upwards direction and that these other influences are simply larger in their combined magnitude in terms of determining prices.
We say that the influence of wind power on the price of coal and natural gas is lost in the noise.
We are smart enough to understand that when you buy a subcompact car and park your f250 beer fetcher except when you really are towing the big boat or fetching a load of firewood that this has the effect of lowering demand for gasoline and thus lowering the price of gasoline- by an amount that approaches zero in terms of one individual but that adds up when millions of people do likewise..
So – Uncle Sam spends a billion on wind power or bullets or school lunches and teachers salary supplements.( Or fuel oil for his destroyers- something leads me to think his destroyers burn something a little better than plain old bunker oil.)
That billion spent on wind is spent partially on copper and concrete and steel and the services of cranes and engineers and so forth. This has the effect of increasing demand for these things and therefore raising the prices of them;
WHEREAS unless you are selling copper or steel or crane time or engineering expertise you are the loser- you have the same amount of money as before -YOU have not collected a subsidy in THIS case.
But you will have to pay more for steel or concrete or copper or crane time or engineering services.The amount extra will be trivial and maybe too small to even calculate it of course but it is not just the wind industry that is being subsidized.
It is the teachers and the car companies and the oil companies and the real estate industry and the farmers and just about any body you can name that is collecting a subsidy in one form or another.
My own family has collected far and away more in Medicare and Social Security than it has ever paid or ever will pay.
So where is all that inflation?
Well it is there – in just about the amount needed to offset the the deflation that people such as Stoneliegh who – so far as I know- still believes is going to destroy the economy.
For what it is worth I personally believe that things are headed to hell in a hand basket (but not as fast as most doomers ) and that as things get more desperate the deficit spending will eventually reach a level that will result in some Carter era type inflation – well over ten percent annually.
After that -we may as likely as not see some runaway inflation before things flat fall apart.
This inflation will be a defacto tax on whoever is foolish enough to be holding long term paper such as bonds and cash savings.
It will run up the prices of everything for every body but there will still be winners and losers because a lot of people will collect more than they lose.
A hell of a lot of people aren’t going to have anything to loose except excess body mass.
“IF you don’t see it look at what Hitler accomplished in well under a decade in a country that was absolutely busted in terms of conventional thinking.Of course what he did accomplish didn’t do either him or anybody else any good but the point is that he did succeed in putting every body to work and increasing production in a way that was believed to be impossible”
Interesting that you brought up Germany. But what happened next? When they ran out of money and resources to continue they went to war to take them from their neighbors. Now that the Chinese economy has reached the end of its rope, it’s looking to military expansion.
Politicians in over indebted, over extended economies have two choices: 1. Face the music, go to jail perhaps get executed. 2. Take the masses to war to distract them from your crimes. If I was a betting man, I would place it on “Red 2”! FWIW: thats what the USA did.
The funding of the German military buildup is interesting.
That funding was forbidden by the treaty and the treaty monitors never saw it. It was all done essentially by a private and secret central bank that was printing deutchmarks.
That will happen everywhere eventually. You need money to avoid Apocalypse? Don’t have it? Your central bank is paralyzed? No problem. Create another one in secret.
Don’t measure things with dollars. That ended the day the FASB changed its rules in early 2009.
“capital markets won’t support the continuous drilling needed to sustain production from unconventional resource plays”
This is all you need to read right here to know this article is missing the point completely. There is still a lot of people out there who have not adjusted to the new way of thinking about unconventional vs. conventional oil. Since Bakken wells, for example, pay for themselves in one year to as little as six months, what difference does the “decline rate” make when it comes to profitability? Its not like wells depleting and going dry is anything new for the oil industry to deal with. That has always happened, but thanks to our free market economy the oil has never stopped flowing.
Plus, always focusing on decline rates misses the bigger picture of the importance of EURs. They are continually increasing as the operators come up with better completion methods and drill more and more wells closer together. Just look at the latest Continental Resources presentation
http://investors.clr.com/phoenix.zhtml?c=197380&p=irol-presentations
On Page 10 they are saying the EURs for there latest Hawkinson density test will beat the old estimate by 50% to be around 900 MBoe per well!
Just a few years ago, we were told to expect a 1-3% recovery of the oil in the Bakken. Then, that number jumped to 6-8%. Now experts like Harold Hamm are saying the % is going to be even higher and we are looking at decades upon decades of drilling just in North Dakota and Montana alone. And that number will just keep increasing as the operators continue coming up with new methods and new technologies to complete ever better wells.
900 bp/d is initial production. Initial production does not last very long. Only wells in the sweet spots are paying for themselves in one year or less. Wells in outlying areas take a lot longer and a lot of them are losers.
Your link is for investors. They are begging for money and painting everything as if every dollar invested will return millions. I wouldn’t bet on it.
The presentation wasn’t talking about initial production, but EUR. CLR is saying the newest wells will produce 900,000 BOE during there lifetimes of 45 years at least. More than 750,000 barrels of that amount will be oil judging from the other CLR wells. And remember whose in charge at Continental, Harold Hamm. I probably trust him more than anyone else to improve the EURs of his wells even more as better technology comes along and all the other oil zones in ND/MT are explored.
The industry vets I speak with here in Houston are talking about all the oil in the lower Lodgepole (above the Bakken) plus formations below the Three Forks like the Duperow and Interlake. Of course the Tyler is just to the south of the Bakken in ND. Everybody is saying there’s going to be a surge of rigs into that area very soon with at least several thousand wells to drill. MRO drilled the first wells in this area over the winter while the company’s landmen were busy securing leases for other wells.
Oh, and there’s the Spearfish Formation near the Canadian border which is really heating up. There will be something like 5000 wells to drill over the next few years up there. Landmen were up in that area too over the winter securing leases in areas that haven’t gotten attention from the oil companies since the 1960s. Trust me, my wife’s parents own some mineral rights in that area and really want to see some fat royalty checks. lol. Less than 25 % of ND residents own the mineral rights on there land since they were sold to mostly Texans in the 1930s before anyone discovered oil in the region. I guess many of the locals in ND hate it that wells can just be placed anywhere on there property and then the royalty checks go to somebody hundreds or thousands of miles away who has never even set foot on the land, but there relatives should have thought about that before selling the minerals rights in the first place. Its Capitalism in action, and once again thanks to the miraculous technologies of horizontal drilling and fracking the scarcity of rich oil and gas sources is simply not the case any longer. It is truly a wonderful new day for energy!
Hamm will be spending most of his time trying not to lose his company in the divorce.
As for the Lodgepole, the USGS did not exclude it in their analysis.
btw 900,000 / 45 / 365 is about 50 bpd.
A EUR horizon of 45 years is not especially relevant. Discounting cash flows over such a long period yields a low net present value. Investors want to see significant near term cash flows. This will become increasingly true if (as I expect) interest rates begin to rise despite the Fed’s efforts to keep them low. In fact, I would say that LTO production is as much the result of low interest rates as it is the result of high oil prices.
Also, keep the cash flow aspect in view. Many unprofitable companies continue for years because they have positive free cash flow. Likewise, companies that are profitable on paper often fail because of lack of cash free cash flow. According to Steve Kopits, LTO ventures are generating negative free cash flow. This is very bad news for them and is what keeps them seeking loans and investors. But the bankers and wall street types are getting wary.
LTO actually has very fast payback because of the high decline curve and the simplicity of the development (compared to deep offshore or the like). It’s less dependent on low interest rate than an investment with more of a wait for first oil or more of the total oil coming later.
Any investment is negative payback the first day of the project. This is the nature of an investment. However, a lot of LTO pays back the drilling cost in 1-2 years.
Since the value of these acres is now realized, new players will not earn substantial profits because of the high cost to get into good acres [or because the remaining prospects for new acre acquisition are marginal]. This is just the nature of something valuable being priced properly. But it doesn’t mean the underlying asset is low value, just that it costs a lot for new entrants.
Interest rates have been falling for 30 years. What more rate-driving buoyant economic growth is pending than existed over that period of time?
FunnelFan,
Listen… I really appreciate when someone really tries to be passionate about what they believe. It’s quite commendable.
However, Capitalism in this country died years ago. The last nail in the coffin was 2008. The FED’s balance sheet is now over $4 Trillion and it’s leveraged about 80 to 1. Basically, our Federal Reserve is BANKRUPT-INSOLVENT if we were to apply “Mark to Market” accounting.
This does not include the TENS of $Trillions (yes.. tens of trillions) of FOREX swaps with the EU- European Union after 2008. The Fed sent them $trillions in Dollars and they sent us back $trillions in EURO’s. Which kept the whole financial system from imploding.
The shale gas industry lives on VAPOR coming from the bowels of Wall Street and the FED. Without the Fed buying of Treasuries and MBS, interest rates would rise… and that would be the end of the Shale Gas industry as they would not be able to finance their debt.
The public believes the FED is tapering and is now only purchasing $55 billion a month. If you believe that, I got some oil shale resources in Colorado I can sell to you. The FED is purchasing a great deal more QE than they publically state.
FunnelFan, the kind of capitalism you speak of doesn’t exist anymore… only in the minds of Warren Buffet wanna-bes. We are standing on the edge of a precipice, and at any time the whole thing could come tumbling down. There are more BLACK SWANS than WHITE in the market… we just don’t know when they come home to roost.
I would be more concerned about learning how to SURVIVE the great collapse than focusing on the DEAD-END ideology of capitalism.
steve
Funnel:
A lot of the stuff on Spearfish or Lodgepole or Tyler on the net is pretty old and pretty uncertain. Have not seen recent reports of these developments really taking off. They will get some oil no doubt, from the best parts. But if it were similar to Three Forks (which really has been a substantial addition) we would be hearing about it.
This is anecdotal, but whenever I see Lodgepole or Tyler wells reported on Million Dollar Way blog, they are bad wells (uneconomical or even dry holes). I would be happy to look at an overall recent analysis of any of these areas (Lodgepole, Tyler, Spearfish).
P.s. I think Watcher is incorrect when he confidently says Lodgepole was included in the USGS assessment. It definitely was not in the 2008 work (specifically says this). The 2012 work mentions it once by name in the context of geology, but does not show any AUs targeting this formation (as they do with middle Bakken or TF or Sanish sands). And none of the discussion says it was added (as TF was). Not that it makes much difference since Lodgepole is not taking off.
Nod. The middle Bakken conventional AU encompassed the Lodgepole area. That’s why it didn’t get a seperate AU. Lotsa maps around and comments about it in McKenzie and shallower drilling did take place. The overall assessment was very poor for that AU.
Ron,
I’m reminded of some companies that bloggers recommended on The Oil Drum in years past, e.g., Pacific Ethanol and Petrobank.
In any case, the last time I recall a company talking about wells that should produce for at least 50 years or so, it was Chesapeake talking about the 2007 vintage wells that they had drilled on the DFW Airport Lease, in the Barnett Shale Play. They described this lease as having some of the thickest and best looking Barnett Shale intervals in the entire play, and they asserted that the wells that they had completed in 2007 would produce “for at least 50 years.” Actually, 50 months was more accurate.
Five years later, production from the 2007 vintage wells was down by 95%, and about half of the wells completed in 2007 had already been plugged and abandoned.
Outside of Fantasy Island, decline rates do matter.
The price of gas is more relevant. We are in a relative glut.
In general shale gas wells have a “turn” in their decline rate after the aggressive drop. In any case, it’s not news about the first few years rapid decline. Really, it’s not. Bottom line is despite the fast decline, you can just drill more…and we are swimming in natural gas.
I would also emphasize not to make too much of individual wells. Who cares if Chesapeake paid too much for some acres or had a few things not pay off. That’s just very simplistic PR games. Overall, we have so much natural gas that the price is depressed.
P.s. It is very easy to go back to your posts from 10-5 years ago and see all kinds of calamity predictions that did not come true. That’s what I find in the TOD. And still, you haven’t learned and improved. Just regurgitate the ELM even when no one (even your buds) has anything to say about it.
“It is very easy to go back to your posts from 10-5 years ago and see all kinds of calamity predictions that did not come true.”
I guess you are referring to my early 2006 warning about an imminent problem with global net exports of oil, in the context of the rapid increase in global net exports of oil after 2005?
Ron,
Incidentally, I suspect that there are two reasons that Peak Oil Barrel (POB) is attracting the attention of stock promoters: (1) POB was recently mentioned by Professor Hamilton on his Econbrowser blog and (2) The article questioning the economics of the tight/shale plays was in a high profile industry magazine, the Oil & Gas Journal.
By the way, I understand that Mr. Hamm will be testifying in front of Congress today. An excerpt from a Reuters article (emphasis added):
Lifting U.S. crude export ban would help counter Russia- oil CEO
http://www.reuters.com/article/2014/03/26/usa-oil-ban-idUSL1N0MM22T20140326
It’s easy to demonstrate the “overnight impact” that Mr. Hamm is talking about. Here is a link to the latest four week running average supply data from the EIA:
http://www.eia.gov/dnav/pet/pet_sum_sndw_dcus_nus_4.htm
If we just focus on the imported crude oil supply for US refineries over the last four weeks, we (gross) exported 64,000 bpd and had (gross) imports of 7,337,000 bpd. So net imports of crude oil were:
Gross Imports – Gross Exports = Net Imports
7,337,000 – 64,000 = 7,273,000 bpd
Let’s assume that we boost gross exports by 1,000,000 bpd and to offset for the decline in supply, we then boost gross imports by 1,000,000 bpd. Net imports of crude oil would then be:
8,337,000 – 1,064,000 = 7,273,000 bpd
A comment following the Reuters article:
So, we should cut back our crude oil production until our domestic crude oil production is sufficient to only meet the demand for crude oil from US refineries, about 15.0 to 15.5 mbpd. Given the discussion in the media about exporting US oil and gas, it’s actually a pretty reasonable comment.
And of course, last year, a talking head on CNBC noted in passing that the US was already a net crude oil exporter.
And so it goes . . .
Let’s redirect our oil imports to Europe, even though it will cause prices in the US to skyrocket and our economy to slump into a deep recession, just to get back at Putin for Crimea. sarc
If we start exporting, it just puts our oil directly on the open market. Doesn’t matter if we import heavy and export light. In fact it makes hella sense since our refineries are geared for heavy, not light and since our light sweet is very valuable on the world market (gets more $$ than the heavy crude costs). But in any case, it’s a swap. There’s no “loss”. Plus it stops from building useless splitters and the like.
Plus our country has a lot of size and different coasts and the like and there are cases where it is cheaper to import/export than the transport across the continent. (Water transport cheaper than rail…)
“On Page 10 they are saying the EURs for there latest Hawkinson density test will beat the old estimate by 50% to be around 900 MBoe per well!”
What they say is that the early results look to be 50% higher than the 603 kboe of the “typical” CLR well over a 45 year life based on 4 months of data (it is also based on 12 of 14 wells, why not all 14, were the other 2 wells terrible?)
The experts without anything to sell at the USGS suggest an average 30 year EUR of 360 kb for the best areas of the Bakken, other “good” areas are around 250 kb.
Also note that in the same presentation (page 31) GAAP net income in 2013 was 764 million dollars and they produced about 35 million barrels of oil for the year so they made about $21.83/barrel. Capital expenditures were about 3.7 B so ROR was about 20%, which is not too bad.
At some point the sweet spots start to run out of room and well productivity will decrease, the true average well EUR is about 350 kb over 30 years at present and at some point (I would guess over the next 12 to 24 months) the average new well EUR will start to decrease. Price increases will be needed if these companies are to remain profitable.
The Hawkinson project is an experiment, it may work out or it may not, the question is will it be profitable? Maybe in the sweet spots, elsewhere probably not.
DC, great post. I don’t like unthinking cornies any more than unthinking doomers.
Seguing:
1. I have been wondering about this type curve difference. Would love it if someone analyzed it or interviewed the companies and USGS. Is there a difference in lateral length assumed? (Very) sweet spot versus not so sweet spot? Different “b” or exponential? Leaving out the bad wells?
2. I would also love to see someone (Drilling Info?) do an analysis of all the Bakken downspacing experiments to date. There is probably a fair amount of data from the individual wells that is not given in the press releases. I’m kind of interested in the tradeoff of how much less oil you get per well, versus how much more for the DSU. E.g. some comparison of downspaced to non downspaced DSUs (similar geography, completion).
Also, there seem to be some inklings that the zipper fracking and the like actually gives a synergy in these downspacings (fracks the old well’s rocks more) in a way that combats the interference. But I’m really not clear if that happens.
In addition, would be nice to somehow combine the information that is quantitative and detailed (well production) with less quantitative information from press releases (e.g. for wells still on confidential). Or even to compare press releases (old) to what we really learn when all the well results come in (to what degree are we only hearing about the best wells in a downspacing experiment).
Hi Nony,
Many if the investor presentations suggest that 600 kb EUR30 wells are typical, the NDIC has also presented a similar type curve. When I have tried such a well profile in combination with the actual number of wells added (as I do in my own models), the match is not very good.
See http://oilpeakclimate.blogspot.com/2013/04/bakken-model-suggests-7-billion-barrels.html and check the fifth and 6th chart of the post (where chart 1 appears first, etc). Fifth chart is below, check the link for chart 6
I think the 600 kb EUR suggested in the investor presentations is a bit on the optimistic side. Probably about 40 to 45% too high.
The investor presentations pretty much universally quote EUR in terms of BOE, so an attempt to replicate the numbers has to take into account the gas the wells will also produce. Are your models based on BOE (oil and gas), or oil only? Either way, I would still anticipate the EUR curves from investor-targeted publications to be on the overly optimistic side, but obviously excluding the proportion of production coming from gas would make the EUR curves from the presentations inherently too high.
Hi Wes,
I used the well profile from the following NDIC presentation
https://www.dmr.nd.gov/oilgas/presentations/EmmonsCoFB101512.pdf
see slide 29 of the presentation (chart below)
slide 30 of the same presentation states that the average Bakken well will produce 615 kb of oil over 45 years.
The NDIC well in my blog post was based on the well profile from the Emmons presentation.
Hi Wes,
I checked out natural gas production in North Dakota, in Jan 2014 natural gas sold was about 10% of all oil and natural gas sold in North Dakota in barrels of oil equivalent
(I used 5800 cu ft of natural gas to 1 barrel of oil.)
Bottom line, natural gas sales are a pretty small part of the picture and to get the Bakken output to match with the number of producing wells added over time a well profile with an EUR about 43% less than the NDIC average well (as in the chart above) would be needed (500 kb/350kb=1.43).
I double checked the well profile. The first point at year zero should be ignored (this is an IP number). After that each number on the chart is athe average production for that year so year 1 average production is 427 b/d. By this method the average well has a 30 year EUR of 569 kb according to the NDIC, if my models are correct they suggest about a 350 kb 30 year EUR so the NDIC “average well” would be 569 kb/350kb=1.63 or 63% too high. Note that a 30 year EUR of 350 kb is pretty close to the recent USGS estimate for the best areas of the Bakken (around 360 kb EUR30).
I really wouldn’t make that much of the NDIC slide. It doesn’t seem like some thing that is a tech report. More like a slide in a presentation. The company type curves have more standing behind them (repeated often, they know the SEC implications).
I wonder how the type curves of the companies compare to actual performance for the years we have seen?
Or even a company like CLR or EOG or whatever. If I take all their wells and compare to the type curve, how are they performing in IP and in curve. If I average all of CLR’s wells and plot the months, how does it compare to the type curve? Is their type curve really representative of their wells or just their best wells?
Hi Nony,
I pulled a type curve from a CLR investor presentation in March 2014 and used it as a background for an excel chart with the NDIC curve presented as cumulative output. The chart is very difficult to read and I had to use some weird scaling to try to get the scales from the two charts to match. Ignore the black numbers on the left axis, the red numbers are for the NDIC cumulative curve and the black numbers on the horizontal axis and the right axis are for the CLR type curve, the dashed gridlines are from the NDIC excel chart.
Interesting article in the Guardian newspaper on shale gas prospects in Europe.
http://www.theguardian.com/environment/2014/mar/26/will-shale-gas-make-europe-less-dependent-on-russian-gas
Comments are the usual mix, one of interest is from DrDavidLowry at 1:48pm.
My favorite quotation:
The PM is right in that shale gas can put the UK in charge of our own destiny. In addition to the gas needed to heat our homes, keep the lights on and power our businesses, it is nearly impossible to get through a day without using multiple products that contain oil or gas. Shampoo, toothpaste, shaving foam, lipstick, and clothing all contain petroleum products and natural gas is also the raw material for plastics. Many industries use gas not only as an energy source but also as a key component of their manufacturing processes.
Ken Cronin, chief executive UKOOG, the UK’s onshore oil and gas industry body,
He is absolutely right — the developed world’s economies and lifestyles are utterly dependent on oil and natural gas. But that fact does not support the contention that shale gas drilling will make a difference – it merely reflects the predicament we are in and how severely things will change as supplies diminish. There WILL be drilling, and some companies WILL make huge profits from it, but the result will not be energy independence but wasted time and money attempting to forestall the inevitable.
Calhoun,
“… but the result will not be energy independence but wasted time and money attempting to forestall the inevitable.” And, to quote: “Therein lies the rub.”
As usual, you and I are on the same page, the same paragraph!
Doug
Steve,
Here’s one for you. Source ScienceDaily News, today. SUMMARY “Six massive glaciers in West Antarctica are moving faster than they did 40 years ago, causing more ice to discharge into the ocean and global sea level to rise, according to new research.” But you need to read the whole thing.
http://www.sciencedaily.com/releases/2014/03/140326153747.htm
Doug
Doug,
I don’t know… that all sounds very conspiratorial to me. I don’t believe nut’n those liberal scientists have to say anyhow.
steve
Hi all,
I have been getting some help from KC to more easily update the data for the 22 active fields in the Eagle Ford play, a preliminary update is below.
The RRC data has been converted to kb/d and a % of Eagle Ford to statewide TX C+C (%EF/TX)has been calculated (around 40% lately), then an EIA estimate (est 1) is created by multiplying EIA TX C+C by the %EF/TX.
A second estimate(est 2) is the average of RRC and estimate 1 up to June 2013 and 96% of estimate 1 from July 2013 to Jan 2014. Chart is below.
Note that EFC+C(kb/d) (dark blue line) is the RRC data, I should have labeled that more clearly, EFest1 is the estimate 1 (EIA TX C+C times %EF/TX) and EFest2 is estimate 2 as described in my comment above (avg of EFC+C and EFest1 up to June 2013 and 96% of EFest1 after June 2013.
Dennis:
1. Nice work. I think the main finding is that you can get a sort of EIA current estimate of EF production by multiplying the EIA estimate of total TX (which is better than the very lagging RRC total TX) by the RRC’s recent EF/total TX. This of course assumes that the degree of lag is the same for EF and for rest of TX, but that’s maybe reasonable and in any case is the best we can do.
2. I really recommend to do separate headposts for this sort of thing. Burying it in comments you’ll get no feedback. Either here or if Ron doesn’t want that amount of traffic, on your own site. You can cross post to comments still…it’s gotta be way more relevant and new and interesting than that guy who just keeps cutting and pasting the old ELM explanation over and over again. 😉
3. This thing was really a head-scratcher to decipher, man. I’m probably more into it than the average reader, although not as smart as Enno or you. But I still had to seriously concentrate and read it several times to figure out what you were doing.
I would recommend to cut the estimate 2, and the RRC EFC estimate and the % cond C+C. [ADD the EIA TX estimate as a line!] I think you are keeping some of that stuff, because you’re mixing in the issue of responding to Ron’s post (implicitly). But it’s confusing and not needed. Show the two lines that are on the left side of your equation (EIA TX and RRC EF/TX) and then your result (est1).
If you do keep all those different lines (please no), than at least label them better. EFC C&C should say RRC on the legend. The % cond C&C should say overall TX. Etc.
Really, I’m not nitpicking. I could NOT understand the post and the graph without reading it over four times. If it helps to motivate you to do just that little bit extra on the graphs for the readers, consider that YOU ARE the first audience for your own charts (even using them for data exploration). Andrew Gelman (very notable blogging statistician) talks about this concept and says he tries to make close to publication ready charts even for his own inspection, because it helps him think through things and see more. But, if that doesn’t sway you…well it’s almost impossible for even engaged readers. 😉
Under 1, perhaps you could do a check of old RRC adjustments and see if there is a difference in the amount of lag EF to rest of TX. My assumption would be more big operators in the EF (thus more squared away and faster), but who knows. Could also be more people wanting to keep the data hidden longer.
Hi Nony,
Thanks for the feedback. I did this quickly and I agree it was not that well done.
I will re do it and will do a post on it such as
http://oilpeakclimate.blogspot.com/2013/08/eagle-ford-shale-may-soon-reach-1.html
HUG!! 😉
Hi Nony,
A problem with trying to include EIA TX C+C on the chart is that the scaling doesn’t work very well as excel limits me to two scales (one left and one right), so I will do it as two charts. I welcome criticism, the idea is to get these ideas across to others, if you don’t get it, I imagine others are left scratching their heads. So thanks!
So the chart will be more readable I will post it at the bottom of the comments. Look for it and let me know if you like it better.
It is peak oil. The Bakken would be untouched if there were better sources for oil. Oil wells that sip oil out of the ground are going to produce, but aren’t going to pull the entire load.
In the early 50’s, farmers were in need of some cash to purchase a washing machine because the farmer’s wife wanted a washing machine for clothes. A time saving device that made her world a little bit better. What the farmer did was trade a few mineral acres for a washing machine, a refrigerator, a television; electricity made their lives better, mineral acres weren’t that important to them at that time. The proprietor of the business that sold washing machines, refrigerators, televisions ended up with some acres here and some acres there in and around several counties in northwestern North Dakota. Those mineral acres became divided again when the mineral owner passed on and the mineral acres owned spread far and wide with time. A little foresight by the business owner paid off in the long haul.
Other farmers in North Dakota headed north the Manitoba and offered to buy mineral acres from Canadian farmers and landowners. Makes the landman’s job more of a chore.
It can get messy sorting through papers at the county courthouse.
Those mineral owners waited many years for a knock on the door until it finally got there.
That is how it happened in the real world. Others would buy the land with the mineral acres, retain the ownership of the mineral acres and sell the land back to the farmer. You then have more owners of smaller parcels of mineral acreage that are then forced to incorporate to gain control of the income from mineral leases, royalties, and direct payments from the sale of oil.
You have a paper corporation that does nothing except sign leases and collect checks from the oil interests that do the real work. It is going to pay.
FYI, socialism never works, never has and never will because it is not possible, socialism is just an idea which has no basis in reality. Capitalism always will prevail, black markets exist for that reason. Those Libyan renegades with the hijacked oil tanker were doing there darnedest to unload some oil that they thought they would be able to do it without getting caught is a prime example of a black market business. They were going to get themselves some money.
Socialism is capitalism. State capitalism.
It is capitalism in a perverted, contorted, malodorous form.
The proof is in the pudding.
Ron, Dennis or Jeff,
Does anyone have an idea when the EIA updates the monthly NatGas production figures. Is it at the end of March?
steve
Natural Gas Monthly
Data for December 2013 | Release Date: February 28, 2014 | Next Release: March 31, 2014 | full report |
Hope this is what you want.
Ron,
Yeah… thanks a trillion.
steve
Hi Steve,
http://www.eia.gov/dnav/ng/ng_prod_sum_dcu_NUS_m.htm
Data can also be found at link above, it is probably the same data as Ron pointed to, though sometimes the EIA has different numbers in different places, you can choose the number you prefer in that case or average the two if they are different.
Dennis,
Thanks. By the way, sometimes I don’t get a chance to thank you, Ron and others for answering previous questions. So Kudos on all the helpful replies.
I noticed Natgas storage declined another 57 Bcf as of March 21st. It will be interesting to see if the U.S. gas industry is able to make up the huge shortfall before heading into the next winter withdrawal season.
steve
Futures prices for this summer and next winter are still sub-$5. Seems like the market is not worried. And like Robert Rapier was wrong about a squeeze happening in March. (Go gas, go!)
Pretty sure US prices of nat gas are not equal to Europe prices of nat gas.
Correct statement, but so what? Make your point.
Much of the discussion here is whether or not and how we can maximize the amount of carbon produced in the face of a planet that is rapidly changing for the worse because of the excess of carbon. The IEA is confidently predicting that we will have plenty of oil and other forms of energy going forward. If this prediction is anywhere close to correct, this is not good news.
Regardless of how one cuts it, trillions of dollars will be spent going forward trying to delay the inevitable. Is this really a prudent use of limited resources? If this money is spent on alternatives, including conservation alternatives, this would be something worth trying. If, at the end of the day, this is found wanting, all that oil, natural gas, and coal will still be in the ground for future generations. They can always destroy the planet later.
The question of when peak oil or whatever will occur is interesting and even instructive. But it will occur. So, why proceed as if it won’t? Hubris, stupidity, and greed seem to be 3 reasonable candidates for the beginning of an explanation for this question.
tstreet,
I agree with every single word in your post; what you have said is what matters. With respect to (almost) all views expressed on Ron’s Blog: how much oil we can ween out of shale, the timing of peak oil, the ultimate production achievable from tar sand, etc. is irrelevant. What matters is doing what we can to preserve-and-protect the planet for our children, grandchildren and the remaining plants and animals trying to survive here. But we’re not and we won’t.
Doug
tstreet,
When we have lunatics like Obama making a speech while “Waving his hand” saying the U.S. is going to export LNG to Ukraine and Europe to by-pass the war-mongering dog, Putin… you know logic and reason is no longer something the US Govt practices.
As for renewables… they’re nice and nifty to have, but they don’t pay for themselves over the depreciated lifespan of the project. While I believe its wise to put a solar system on your house so you can be guaranteed some amount of electricity… you shouldn’t worry if it pays for itself.
However, the huge Solar Projects going up around the country and especially California are only viable by huge Govt subsidies as well as the local Power Utilities being forced to by the Solar Power at 2-4 times the going wholesale electric rate.
This is not sustainable. So… what’s left? Well, I imagine we watch as KOOKLA, FRAN and OLLIE up in the White House make a complete mess of things, before events really get out of hand. There is NO EFFECTIVE PLAN B… and we got Mother Nature knocking at the Door as El Nino looks quite angry this year.
I would be my bottom Federal Reserve Note that we see record Heat Waves this year… and onwards.
steve
Steve,
A doubling of wholesale electric rates isn’t sustainable? Have you looked at your bill recently? If it is anything like mine, the cost of the electricity is maybe a third of the total. Throw in an aging distribution system that will require increased investment to maintain service and maybe increased interest rates in the future along with higher natural gas prices and a doubling of wholesale electricity won’t seem like too big a deal.
Solyndra ended up being a waste of money. Those biofuel companies of Khosla (that also got some government grants) are doing badly. Maybe just let the market decide and don’t worry about it. When we have “smart people” trying to second guess the market with government investment, we end up losing money…
Nony,
While I find it hard to agree with you on most of your views… you get a HIGH FIVE on this one.
steve
I must disagree with you guys on the usefulness of solar and wind power which are the only really important renewables at this time other than hypo.
A well situated solar farm or wind farm not only returns energy in a far more useful and easily distributed form- since we already have an existing grid- than goes into the building of it.That energy is more valuable and cleaner too.
We will just have to deal with the far off – thirty or forty years off – future when it gets here. In the meantime we are already getting about four percent of our total electrical generation annually from existing wind and a little more from solar.
This means we are saving about four percent annually ALREADY on the cost of coal and natural gas needed to generate electricity. This savings will be repeated ANNUALLY for the life of the wind and solar farms and that will be any where up to forever with replacement of the component machinery as it wears out. It will not be less that twenty to thirty years.
Beyond the actual cost involved in purchasing that coal and gas there is the fact that when you reduce the demand for a commodity substantially you also put a lot of downward pressure on the price of it although this down pressure may not be enough to offset other pressures that are pushing prices up.
BUT there can be no doubt at all that both coal and gas would cost MORE than they do except for wind and solar.
Now some people believe that solar does not generate as much energy as it consumes. But if you consider the number you find out that an honest accounting says it does.
There is no question that wind is energy positive.
I have had something pop up that must be taken care of immediately but I will return to this later.
Mac,
I don’t have much of an opinion on wind/solar, my experience is very limited and rather dated BUT. When my youngest daughter married she and her husband bought acreage and decided to try living “off the grid”. I bought them a windmill and a few solar panels for Christmas and we proudly set everything up. The location was bad for wind so that was a failure. Not a big deal, the location was just wrong. Solar worked pretty well when augmented with a Honda generator from time to time. However, after about two years the (very expensive) deep cycle storage batteries had to be replaced. Then it happened again. The conclusion became that it wasn’t viable because of this ongoing battery cost. This was a few years back, maybe systems are better now but in all it was a discouraging adventure. At that time, I can say, for them solar wasn’t viable. Only one story, true.
Doug
Going off grid is a pretty tough thing to do if you want a modern lifestyle and money matters very much. It takes a lot.
But wind and solar farms are intended to feed the grid rather than replace it. The value of them resides mostly in the two basic facts that they are cleaner / healthier than coal and natural gas and that they stretch the the available ever depleting supply of these irreplaceable fossil fuels.
In the end the renewables we are building now are going to be some of the biggest long term bargains in history- because the wind and sun are always going to be free.
The delivered prices of coal and gas are going to keep on going up just as they have more or less since I can remember.
A large dump truck- not a tractor trailer- load of so so quality coal costs over two thousand bucks now in southwest Virginia and we are close enough to the mines that the truck can make two or even three trips in a day with the same driver.
Coal that sells for twelve or fifteen bucks in the western mines costs over five times that in Atlanta after the rail freight is added on.
Taxes are going to be piled on both coal and gas as times get tougher because government at all levels is going to be in an eve worsening bind for money.
The world market price of natural gas is about three times the domestic price and the industry has made it plain that it intends to export and get that price. Gas ain’t gonna stay cheap!!
Here’s something quite FUN off the News Press:
Russia To Create Own National Payment System In “Bid To Reduce Dependence On The West”
The more the West attempts to “isolate” Russia and pushes it away from its “core values” and of course the US Dollar, the more Russia will seek the safety of a non-dollar based system. We have previously described how Putin has been scrambling to enmesh Russia in tight bilateral commodity-based trade with both China and India, and now it is Russia’s turn to announce it would seek its own “national payment settlement system” following last week’s surprising and unmandated service halts by both Visa and MasterCard, which as Vladimir Putin said earlier today, will be a “bid to reduce economic dependence on the West.”
http://www.zerohedge.com/news/2014-03-27/russia-create-own-national-payment-system-bid-reduce-dependence-west
This is the beginning of the end for the PETRO-DOLLAR. The day the petro-dollar finally dies, Americans will witness the kind of inflation normally experienced in third-world countries.
steve
Steve,
The Gazprom website is an amazing source of information, discovered by accident, from which I was able to glean the following and a ton of additional information. According to the Company, when Putin visits Beijing in May he’ll sign the famous $1 trillion gas deal to supply China’s CNPC with 3.75 billion cubic feet of gas a day for 30 years, starting in 2018. China’s current daily gas demand is around 16 billion cubic feet. Of course Gazprom collects most of its profits from Europe but Asia is its future. It seems the Company plans to use this mega-deal to boost investment in eastern Siberia which will be the hub for gas shipments to Japan and South Korea — and the reason why Asia won’t “isolate” Russia. (See Asia will not ‘isolate’ Russia, Asia Times Online, March 25, 2014.) On top of all this, there remains the possibility Russia and China will agree payment for the Gazprom-CNPC deal in yuan (or rubles), the dawn of a basket of currencies becoming a new international reserve currency. This is certainly a key BRICS objective: which could be the beginning of the end for petro-dollars. Be interesting to see!
Doug
Doug,
I’d buy that for a DOLLAR.
steve
Ron,
I’ll take advantage of this spot to thank you for providing an opportunity for a motley collection of lunatics the opportunity of venting (often) ill considered opinions and off topic thoughts on your Blog. I’m certainly as guilty as anyone of this.
Doug
Steve,
Thought experiment for you. If the petro dollar dies, do the folks building LNG and coal export facilities end up looking like geniuses and what will that do to power costs in the US?
It is gradually starting to dawn on commentators in the UK what the collapse in North Sea production means – welcome to import land!
http://www.telegraph.co.uk/finance/newsbysector/energy/oilandgas/10727129/Fuel-imports-take-UK-back-to-dark-days-of-1984-as-refineries-close.html
Note the rather staggering stat that:
”Information collected for the Joint Oil Data Initiative showed that declines in North Sea output have carried through to this year. Production of crude oil fell by 5.8pc in February compared with the previous month, which had also posted declines”.
This is already blowing holes in the UK’s trade balance, which is getting progressively worse.
Ron, Dennis, Jeff, Doug et al,
I would like to hear opinions on this NEW TIDBIT:
China Eyes Massive Production from First Shale Project
China’s Sinopec is planning to develop a production capacity of 10 billion cubic meters per year by 2017 at the Fuling shale gas field, making it the country’s first commercial shale gas project.
…By 2020, China hopes to be producing 60-100 billion cubic meters of natural gas per year, for which the drilling pace will have to be picked up exponentially.
http://oilprice.com/Energy/Natural-Gas/China-Eyes-Massive-Production-from-First-Shale-Project.html
Is there any reality at all to this…. or is it more wishful thinking?
steve
Wait a minute… do they mean Billion cubic feet per day per year… or just per year. If they are talking about 60-100 Bcf per year.. that’s peanuts.
steve
hold on a minute… looks like they mean CUBIC METERS. Big difference.
Steve,
Hold still, you’re jumping around so much I can’t decide where you’re at. I have some contacts in China and will make some inquiries; don’t hold your breath. This units stuff drives everyone crazy, and you Yanks aren’t absolved from blame. Feet, cubits, miles….. what the hell are you talking about? (yellow face). Oh yeh, how is your Chinese?
Doug
Doug,
My Chinese is as good as my Russian.
steve
Quite a few of the producers in the Bakken are doing very well, and have published calculations of generations worth of oil and other liquids to be brought to the surface.
One of the efforts I really find promising is a new very closely spaced frac technique from Whiting (WLL). It has vastly increased output while also decreasing extraction costs. A lot more sand gets used as proppant, but less water is needed overall. You can bet this is an important consideration in areas where water is in short supply.
Don’t forget that plays like Permian, Niobrara and other Colorado benches, Marcellus, Utica, Haynesville, and offshore Gulf of Mexico will continue to do very well and return great value for shareholders. Of course the “mother lode” could well be in California in the Monterey shale, but it’s a well known fact that area is home to many “environmental crazies” who want nothing but to return us all to the cavemen days. You can’t do much more than wish Occidental (OXY), the biggest player in that region, all the best luck.
Disclaimer: I am long shares of Whiting (WLL), Continental (CLR), Apache (APA), and frac sand supplier Hi-Crush (HCLP), plus short a couple of others.
Thanks man.
I have seen some recent signs from company statements, downspacing experiments, and rig count to indicate the play is looking a little rosier. Not a huge difference cause it was doing fine, but seemed to be slowing just a bit (even before the winter), but now is slightly back to more promising. I think spring/summer will be cool for those who like to watch the production number grow. Too bad, we have to wait 1.5 months after each month end!
Whiting has an interesting completion technique as does EOG. CLR said in their recent conf call, that they will experiment with alternate completion method (more costly) this year. Probably similar. I’m not clear how much better it is (as some of EOG’s stuff from 2012 tended to boost IP, but at the expense of later months and possibly EUR.) One of the promising things I’ve heard about the Whiting technique is you get a greater percentage of the oil immediately adjacent to the well (like a smaller cylinder for same production) and then this enables more downspacing.
I don’t know about the generations. Obviously the wells will go for 40-50 years. I am hearing stuff like 8-20 years of drilling planned. Both in presentations as well as what Helms has heard by word of mouth.
Hi Nony,
There are very few wells in the Bakken that have lasted more than 30 years.
And even if they last for 50 years, the output over that last 20 years is quite low less than 10 b/d. Lets say we have 40,000 wells at 10 b/d, that would be 400 kb/d, but not all those wells will be at 10 b/d, lets say an average od 5 b/d, then we’d have 200 kb/d if sweet spots never run out of room and new well EUR remains at current levels.
Let’s just go with that assumption and to make calculations easy we will assume EUR is 400 kb over 30 years and never decreases.
With 40,000 wells we get 16 Gb of oil over 30 years, 60,000 wells gets us to 24 Gb of oil. These must be the kinds of calculations that Harold Hamm does.
Not high enough for you?
Lets say the CLR type curves are correct and we will get 600 kboe from the average well, in that case 60,000 wells gets us to 36 Gboe and if we assume 90% of this is oil we would be at 32.4 Gb of oil. Currently there are about 7000 Bakken wells producing so to get to 60,000 wells we would need another 53,000 wells and if we drill 2000 wells per year we will be all drilled up in 26 years. And this is just North Dakota.
So are you buying this? We expect 32 Gb of oil and those clowns at the USGS are low by a factor of 4 (mean TRR estimate around 8 Gb).
If anyone is buying this, I have a bridge to sell you, very historic 😉
JBech,
“and have published calculations of generations worth of oil and other liquids to be brought to the surface.” I have degrees in Engineering and the Earth Sciences and have no idea what that means, none whatsoever. “…calculations of generations…” Is that even English?
“It has vastly increased output while also decreasing extraction costs.”vastly” what the Hell does that mean? Would it be 1%, 5%, 500%, 5000%. And, for that matter, what do you mean by output anyway?
“…but it’s a well known fact that area is home to many “environmental crazies” who want nothing but to return us all to the cavemen days.” This is a joke, right?
You know, you might be in the wrong place; perhaps you should be addressing your comments to the Rotary Club or maybe some local High School investment group. Anyway, all the best luck, or is it best of luck?
Doug
Well have you been keeping up to date on how best to play the markets as regards the shale revolution? Keep up on the articles from WSJ, Bloomberg, The Fool, Seeking Alpha, etc…Look at this one from Fool about Whiting (WLL) and how they have grown production more than 44% in three years plus also increasing the earnings per share 32%. Plus it notes just a few weeks ago John Paulson bought into 10 million shares of the company, which is a pretty good indicator of the financial strength of a company.
The “generations” comment was just that. So long as enviro wackos (who do want us living like cavemen, else why are they always against oil, coal, cars, metals-all the stuff that brought us modern civilization and stopped us from living like cavemen) and the government stay out of the way we are looking at a minimum of two or three generations of hard working people growing up to have good-paying secure jobs in the shale fields that will support families, children, communities across the country, etc…Makes me proud to be an American.
Disclaimer: I am long shares of Whiting (WLL), Continental (CLR), Apache (APA), and frac sand supplier Hi-Crush (HCLP), plus short a couple of others.
Don’t think Ron intends this to be an investment blog. TOD was run by academics and generally frowned on it. It’s the sort of thing that can generate lawsuits.
Yes please spare us this sort of stuff. It is what CNBC exists for, enough already.
OK, let’s see how these stocks are doing. Let’s start with WLL since that’s the example you focused on. Stock price hit a high of 74 in April 2011 and now stands at 69. In the intervening period it hit a low of 35. Now, sure, if you bought in 2009 at 17 you would have done great, but that train has left the station.
How about Apache? Hit a high of 133 in April 2011 and now stands at 61. Ouch!
CLR? Previou high in April 2011 was 95, now 121. Not bad, 27% return over two years. So why is UBS downgrading them?
Following significant NAV expansion from downspacing & Lower Three Forks de-risking in 2013, we believe the next round of NAV growth will be slower to realize given the need to determine the longer term impact on well productivity from inventory addition. With shares trading at 0.84x 2P NAV (9% above oily E&P average vs. in-line historically) and above peers on 2014-2016E EV/EBITDX, we believe CLR’s rich valuation reflects its premier positions in the Williston Basin & SCOOP plays, …
In other words, CLR has done a very good job. Got in early, got good spots, worked efficiently. But as good as they have been, UBS sees a neutral future for CLR at best.
Next, HCLP. This isn’t even an oil company. They provide sand to frackers and they’ve only been around for since August 2012, just in time to cash in on the biggest growth period in LTO drilling. Stock went from 19 initially to 39 today. Great deal, if you got in on it early. Will it continue? Maybe — this company might be a great bell weather to watch as a proxy for future drilling activity.
Bottom line, there are always winners and losers. And for the past five years it’s been kind of tough to be a loser in the LTO business. Will it continue? Will you be able to pick the winners for next year? I have known many excellent investors in my time and they all have one thing in common — they don’t post their trades on blogs.
But as far as the great, secure jobs in the shale oil fields are concerned, you might what to actually check that reality with some of the people working in them.
Ha, got posted as Anonymous above. Anyway, here’s a bit more on HCLP (Source
Total debt sits at a reasonable two times distributable cash flow, but almost all of that debt is in a revolving credit line. The average rate, while low right now, is variable. The partnership’s finances are acutely affected by interest rates.
Of the company’s $68 million in distributable cash flow, $63.6 million was paid last year (based on today’s share count). That leaves a coverage ratio of only 1.069 times — pretty thin when considering that the company’s borrowings come from a variable-rate revolver. This is one risk that Hi-Crush carries.
So these guys are really operating at the edge — the business is basically financed on a credit card (revolving credit) and a rise in interest rates would severely impact them. The only way this company increases value is if drilling continues to grow at recently high rates as projected in the graph below.
But of even more concern to me as an investor is the fact that HCLP is organized as a master limited partnership. This is a relatively new legal entity that combines aspects of a limited partnership with aspects of a publicly traded company. This from wikipedia:
In practice, MLPs pay their investors through quarterly required distributions, the amount of which is stated in the contract between the limited partners (the investors) and the general partner (the managers or GP). Typically, the higher the quarterly distributions paid to limited partners, the higher the management fee paid to the general partner. This provides the general partner with an incentive to maximize distributions through pursuing income-accretive acquisitions and organic growth projects.[citation needed] Failure to pay the quarterly required distributions may constitute an event of default.
Because MLPs are classified as partnerships, they avoid corporate income tax at both state and federal levels. Additionally, limited partners may also record a pro-rated share of the MLP’s depreciation on their own tax forms to reduce liability. This is the primary benefit of MLPs and gives MLPs relatively cheap funding.
The tax implications of MLPs for individual investors are complex. While distributions from MLPs are taxed at the marginal rate of the limited partner, there may be no tax advantage to claiming the pro-rated share of the MLP’s depreciation when the investments is held in a tax deferred account. To encourage tax-deferred investors, many MLPs set up corporation holding companies of limited partner claims which can issue common equity.
Also, MLPs are used mostly by infrastructure companies, typically pipeline companies that have a long-term, reliable income stream. It seems to me that HCLP may be using the MLP as a vehicle for quick growth to enrich the founders, which it surely has already done.
Ron, I’d like to suggest that you adopt a policy of not allowing any posts that appear to be hyping stocks.
I actually think you should allow the stock hyping. It’s not like there is that much of it. Following the companies (and their SEC filings) is a good source of info. Imperfect, but still helpful intel. And the fellow was not even touting a specific stock. He touted the overall Bakken and just disclosed his holdings. It’s not like they’re taking over the place. And anyway, there’s enough stuff with sandals versus suits within the peaker community or even people hypeing their peaker newsletters or the like.
Agreed that the shale companies have been valued already for their windfall. It’s not 2009! Doesn’t mean it’s a bad industry, though. Just for investors, the value is already priced in and now you are just picking winners/losers or playing the slots essentially.
Markets are well aware of these companies and all the articles about them and all their news releases…so you won’t beat the pros. Odds are just that you are the average. Probably better off being in some low cost index fund and not burning up transaction costs “playing” the market. And Cramer is an idiot.
As far as the jobs, don’t agree. These are good jobs for American engineers and tradespeople. Don’t turn down your nose at that stuff. Not everyone can be an I-phone designer. And it beats filling out TPS sheets. 😉
Found this interesting though it is from one year ago I suspect the figures are still about the same.
New Crudes, New Markets
Bakken producers have found willing buyers on both the US Atlantic and West Coasts, albeit at a heavy transportation cost per barrel – estimated to be $12/b to move Bakken from North Dakota to Albany, NY.
It was New York that caused the shutdown of railcar loading in late February. They investigated content and found it to be less than 100% crude.
This is the Transport cost that Rune Likvern uses in his economic analysis of Bakken oil companies.
It might be a little cheaper to move the oil to the West Coast, but price differentials makes it profitable to move to both coasts. I believe that I have read that it is about $9/barrel to move the oil to the west coast which would imply a $3 price differential at the refinery gate between the East and West coast.
When I look at the refiner acquisition cost from the EIA and compare the price differential, the East coast refineries pay about $5 more than the West coast refineries for their crude on average since Jan 2011.
There are hundreds of oil companies in the Bakken. The money chasers are there. Go to the well search function at the NDIC oil and gas website and you can write down every oil company there in the Williston Basin. Engulf and Devour is not a corporation, although, it might be there on the well search on the NDIC website. lol
Choose a company like Statoil, sto, and the investing you do will make you a better world. They pay a dividend and the price is about right with regard to p/e.
Had you bought KOG, Kodiak, at 1.67 and held, your investment would be in good shape today.
It’s a funny ol’ ride out there in the wilds of the west. That’s the way it goes moving west.
If there were no oil on the planet, it would be money chasers chasing another money making investment strategy to make a buck at whatever. Whether it be investing or working an industry to butter your bread, perusing a fungible commodity to take advantage of all the financial machinations to mark a gain in the world in investing is how the world of investing grinds the bones to bake its bread. As it is now, that is all about there is left to do in this world.
As long as oil flows and the organisms that use it continue to exist, the money will be the driving force.
An old farmer that I have known for many years also owned an oil rig. Why? Well, first and foremost, farmers are fond of oil. Makes their world a paradise. Food production becomes advanced by light years. And the secondary why? Because it has a good possibility of a huge payoff. Simple economics. Supply and demand. Oil does work. Pure, plain and simple no brainer. You’re going to make some money when you strike oil.
Conservation of resources is going to grow in importance. Investing will be relegated to sharking loans.
Hi Nony,
Here is the chart. and for others the basic explanation is that I used RRC data for Eagle Ford C+C and statewide TX C+C to find the % of TX C+C output coming from the Eagle Ford Shale play (EF).
I call this %EF/TX.
I then use EIA C+C output data for Texas [TX C+C (EIA)] to get a better estimate of Eagle Ford C+C output by multiplying %EF/TX by TX C+C to find the EF estimated C+C output (EF est).
More info can be found at the link below
http://peakoilbarrel.com/revisiting-ieas-world-energy-outlook-2013/comment-page-2/#comment-15251
Wow, that overall TX line is getting higher and higher. Any projections if we exceed the 3.5 MM bpd record from 1970?
Hi Nony,
In a world where oil never peaks, of course 🙂
We live in parallel universes. When the Eagle Ford peaks (likely in 2 years +/-1 year would be my guess), it is possible that the Permian could take up some of the slack and prevent a rapid decline, but that depends on how successful development efforts are for the tight oil in that basin. Time will of course answer these questions definitively.
I’m not saying it would stay at 3.5. I just want it to cross there so I can rub it in the peaksters noses crack some cornie champagne.
test
better testReally impressive. Doubled production in three years. The total production line looks like a straight line from July 13 onward. Is that real production or just some kind of linear extrapolation?
linear extrapolation. Ron and Dennis have posted about this.
Hi Calhoun,
Nony is partly correct, I believe it is Ron that has posted about this linear extrapolation and I think it is pretty clear that he is correct.
It seems that the EIA looked at TX C+C production from March 2012 to March 2013 and it looked fairly close to a straight line and they just extrapolated this forward in time out to Dec 2013. Hopefully they will do some statistical sampling to test this in the future.
Before the big budget cuts in 2011 the EIA used to get output data directly from the largest oil companies operating in Texas and then determined that these 20 (or 30 I don’t know the number) companies historically had produced say 75% of total TX C+C, their estimates assumed that this percentage remained fixed and if the companies reported 1000 kb/d of output they would estimate total Texas output as 1333 kb/d=1000 times 4 divided by 3. The percentages would be updated yearly based on RRC of TX data from 2 years earlier (which is about how long it takes for all the TX C+C to get into the system.)
These days they probably do this annually to see how far off their extrapolations are.
The true output lies somewhere between the EIA data and the RRC data, the EIA is likely to be high (for recent months especially) by 2 to 5% (a WAG on my part).
Our own Jeffrey Brown quoted in Forbes. First reasonably intelligent thing I’ve seen come out of Forbes.
This is why the notion of energy independence is unrealistic. Midwest producers like Hamm talk about rising oil production as if we have a surplus, but we are a long way from domestic production levels that would reduce imports to zero. Even if we achieve those levels, we are unlikely to maintain them for long.
Amen to that.
On the other hand, we have this garbage: U.S. Oil Production Surpasses 10% of World Total
As Ron has shown, if it weren’t for LTO, the world would be showing a decline. So part of the reason the U.S. has a larger percentage is because everyone else is producing less. But, yes, we are producing more. Or, as I prefer to put it, draining our reserves faster. We produce more so that we will inevitably produce less later. Is that a good thing? I would like my son to have oil in his lifetime.
better to use it know. oil futures are backwarded. 😉
I was suggested this web site by my cousin. I’m not sure whether this post is written
by him as no one else know such detailed about my difficulty.
You are amazing! Thanks!
Pretty nice post. I just stumbled upon your weblog and wanted
to mention that I’ve really loved surfing around your
blog posts. After all I’ll be subscribing to your rss feed and I hope you write again very
soon!
Also visit my web-site face365y51.com
Howdy I am so delighted I found your web site, I really found
you by mistake, while I was browsing on Askjeeve for something
else, Regardless I am here now and would just like to say many thanks for
a fantastic post and a all round exciting blog
(I also love the theme/design), I don’t
have time to read it all at the moment but I have bookmarked it and also included your RSS feeds, so when I have
time I will be back to read much more, Please
do keep up the great job.