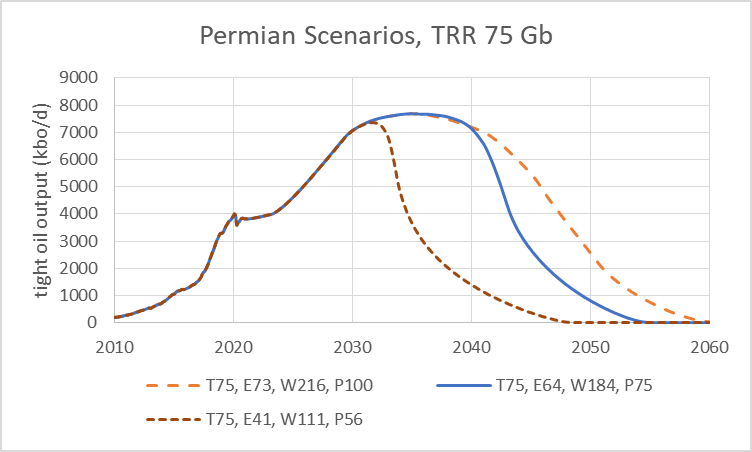
The future of tight oil output in the US will depend in large part on future development of Permian Basin resources in Texas and New Mexico. I have developed nine scenarios for future Permian basin tight oil output based on 3 levels of technically recoverable resources (TRR) and 3 different future oil price scenarios. These are summarized in the chart below.
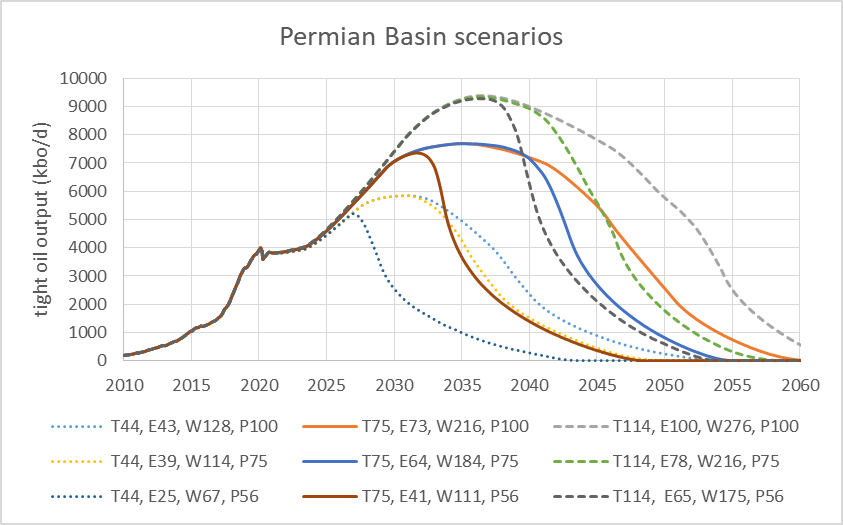
For the chart above I use the following abbreviations: T75 represents a TRR of 75 Gb, E64 means the economically recoverable resource (ERR) is 64 Gb, W184 is short for total well completions of 184 thousand wells, and P75 indicates an Oil Price scenario with a maximum real Brent Oil Price of $75/bo in constant 2019 US$. The details on the oil price scenarios are discussed later in the post.
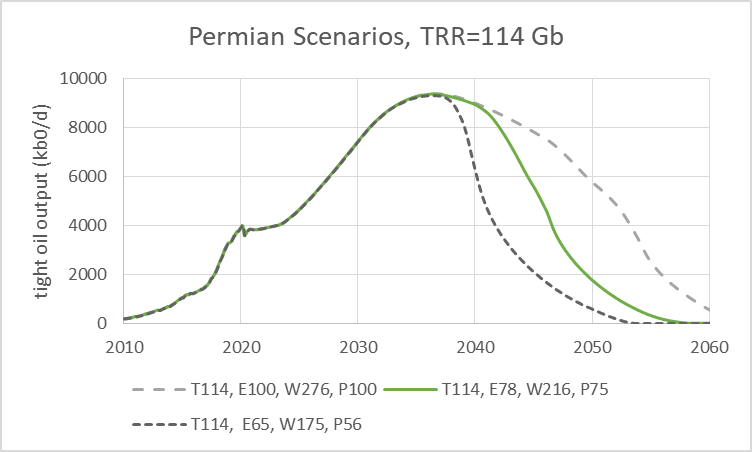
The United States Geological Survey (USGS) has several studies on tight oil resources in the Permian Basin. The mean TRR estimate has about 60.36 million acres that can be developed in the Permian basin, I assume about 1500 foot well spacing and average lateral length of 9000 feet per well which is approximately 300 acres per well for wells developed from 2020 and into the future. I use the end of 2017 as the baseline (the USGS studies were published from 2016 to 2018) when about 15500 wells had been completed, so we take 60.3 acres million divided 300 acres to get 201 thousand wells developed after 2017 for a total of 216 thousand wells completed for the full TRR case. Applying economic assumptions reduces the number of actual wells competed to less than this maximum possible number. Similar logic is used to develop the low TRR and high TRR cases with probabilities of TRR being larger than these estimates of 95% for the low TRR case (F95) and 5% for the high TRR case (F5). For F95 case the TRR is 44 Gb with 33.63 million acres and the F5 case the TRR is 114 Gb with 91.5 million acres. Total well completions are 128 thousand wells (W128) for the T44 case (F95) and 325 thousand wells (W325) for the T114 case (F5).
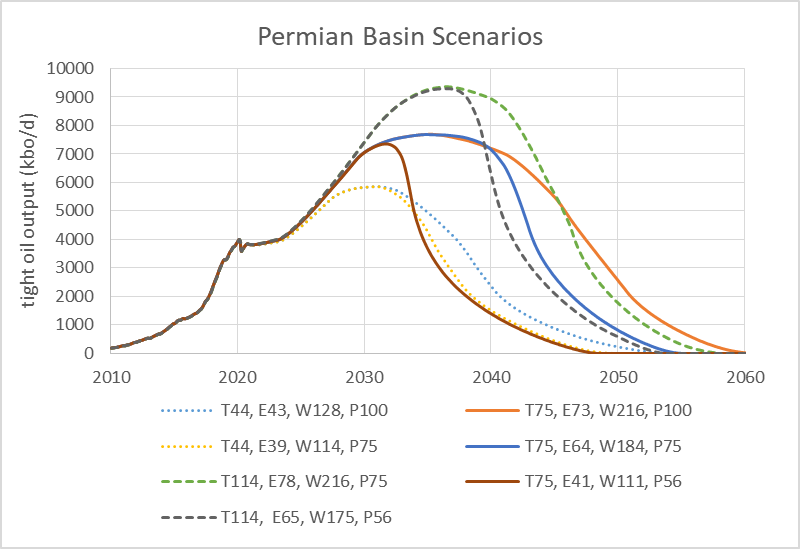
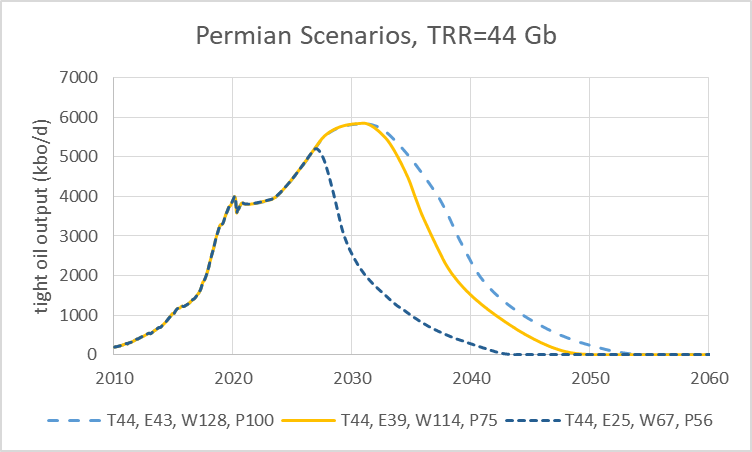
Figure 2 drops the T44, P56 case and the T114, P100 cases from figure 1, in my view these 7 cases are the most likely cases. The reasoning is that a low price scenario is less likely if resources are lower as scarcity is more likely in that case, the reverse is true for the high resource case where the high oil price scenario (P100) is less likely. The ERR ranges from 39 Gb to 78 Gb for these 7 scenarios. Note that the higher peak for the high resource case is due to arbitrarily allowing a higher maximum well completion rate (850 new wells per month) for those scenarios, likewise a lower maximum completion rate of 600 new wells per month was assumed for the low TRR cases and the mean TRR case used an intermediate assumption of 724 new wells completed per month. The choices were arbitrary, but show how these assumptions affect the shapes of the scenarios, had a single maximum completion rate been chosen for all scenarios, the peak output levels would have been very similar for all scenarios, the changes in prices and/ or the choice of maximum well completion rates, mostly affects the tail of the output curve for any set of other assumptions.
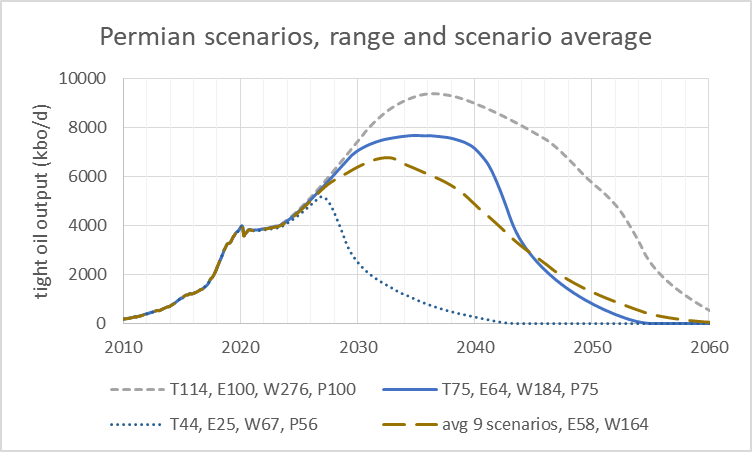
Chart above shows the full range for all 9 scenarios, along with the middle case with T75, E64, and P75, in addition the average for all 9 scenarios is shown which has E58 and W164. The full range of the ERR is 25 Gb for the lowest case to 100 Gb for the highest of the scenarios, with a mean of 58 Gb for all 9 scenarios.
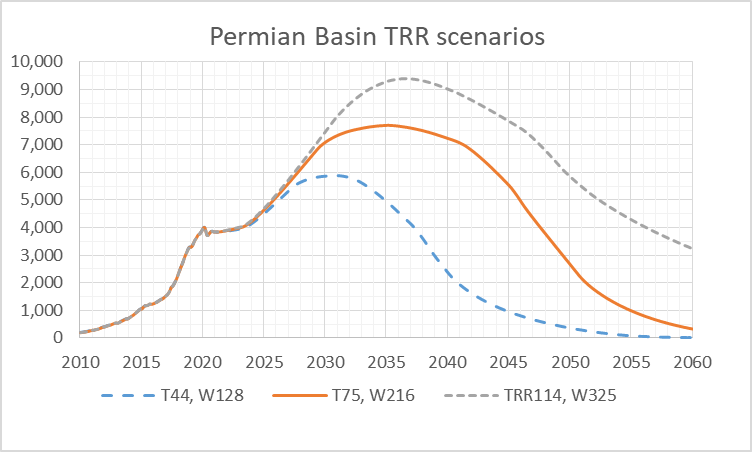
The TRR scenarios use no economic assumptions (or actually uses the EIA’s AEO 2020 high oil price case as the price input to the model). The subsequent ERR scenarios for the three different oil price scenarios are covered below (figures 5 to 7).
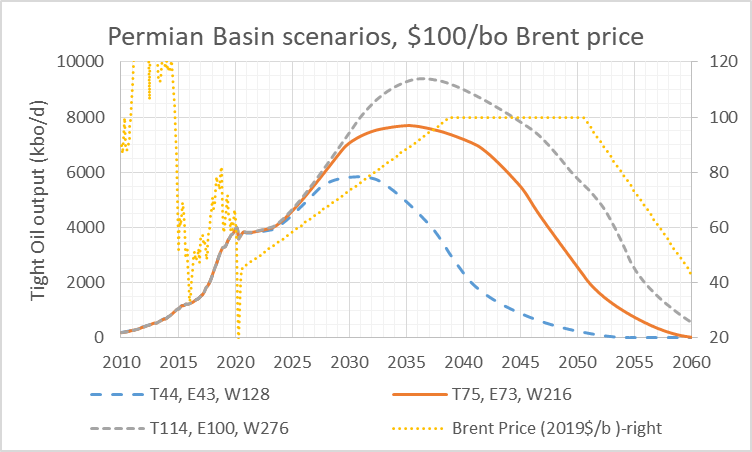
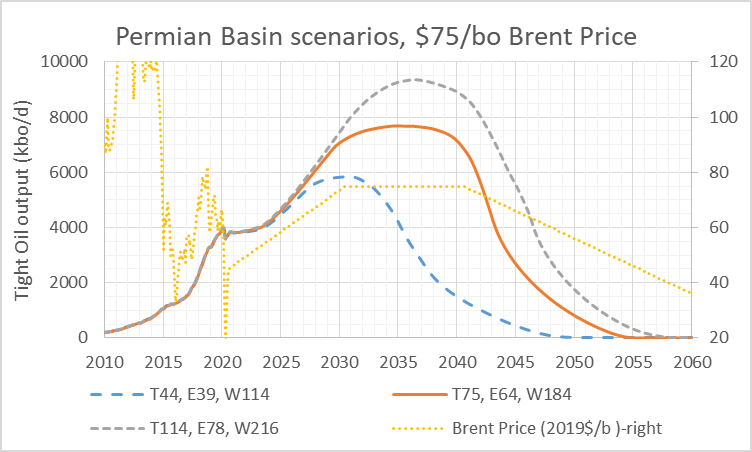
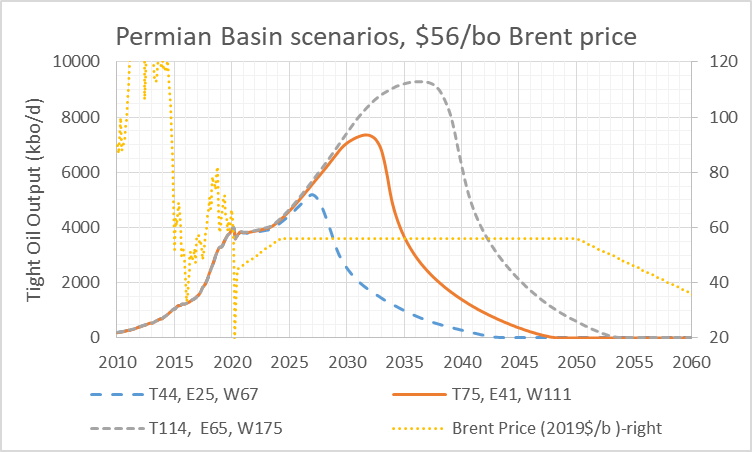
The following three figures compare the different price scenarios for each of the three levels of TRR, note how the P100 price scenario has TRR and ERR nearly equal for figure 8 (T44), where in figure 10 (T114) P100 has a much bigger difference between TRR and ERR.
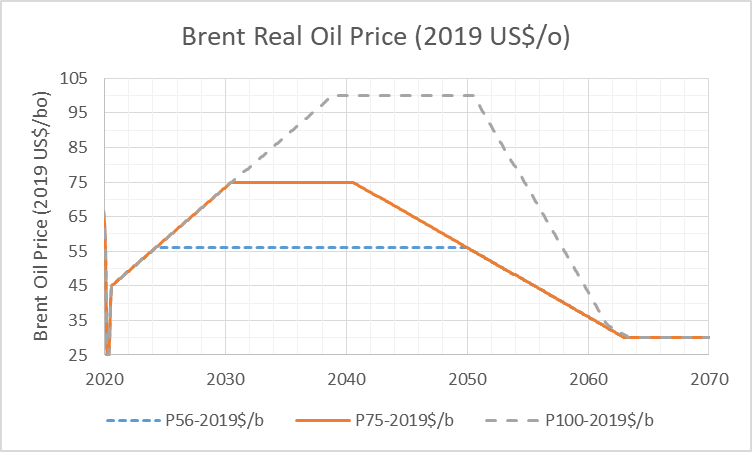
The three oil price scenarios used for the scenarios are compared in a single chart below. For those that prefer to think in terms of WTI oil price, subtract about $5/bo from the Brent oil price.
Below we look at the EIA AEO 2020 Brent Oil Price scenarios with the reference case being the EIA’s best guess as of Jan 2020, the low and high cases might cover the 95% confidence interval and I take the average of the reference and high cases for the high/med case and the average of the low and reference cases for the low/med case. The spread between the high/med and low/med cases might be roughly a 70% confidence interval.
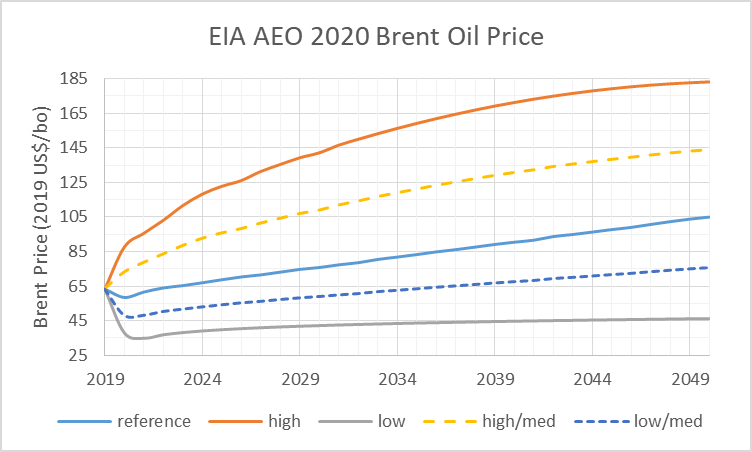
Below the cases I use for the Permian scenarios are compare with several EIA AEO 2020 cases.
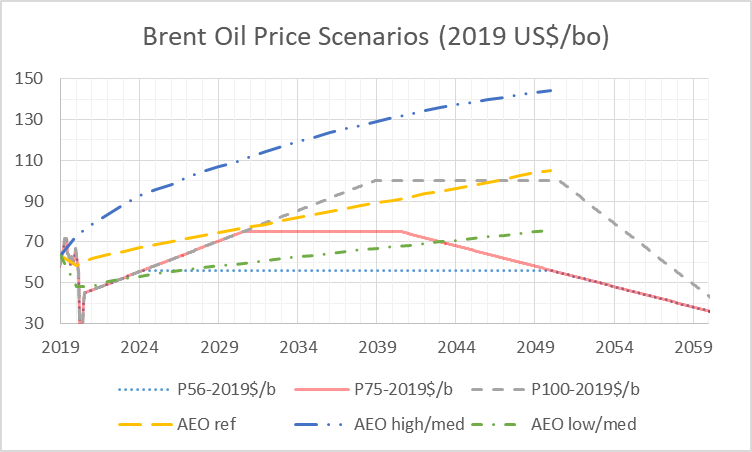
Of course as wise people often remind me, nobody (including the EIA) knows what future oil prices will be. I agree. In any case my guess is that oil prices are more likely to be between my P75 and P100 scenarios than below my P75 scenario, but I am often wrong about future oil prices. As I write this the Brent futures price is above $55/bo, and has increased about $7/bo over the past month, my scenarios have Brent in 2019$/b reaching $55/bo in 2023.
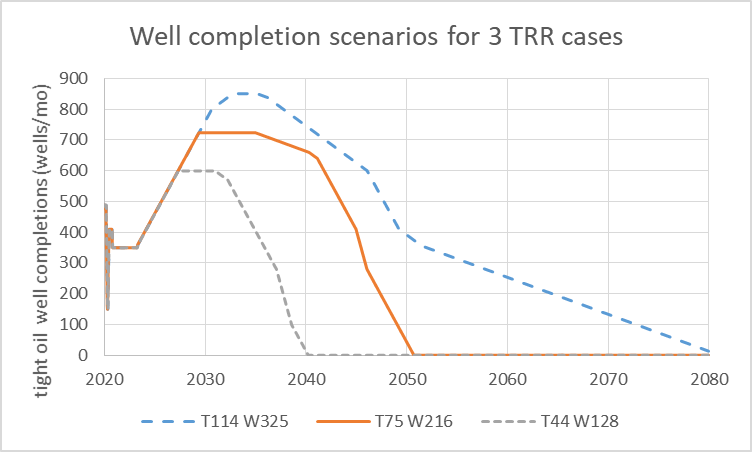
Figure 14 above shows the well completion rates for the 3 TRR scenarios, the down slope changes for the different oil price scenarios based on the future discounted net revenue of completed wells.
Thanks Dennis, a lot of good work summarized here.
A couple comments/questions:
What is the source of your TRR and ERR estimates and ranges? I assume from the USGS? Given all the money that has been lost in the shale plays, do you think the ERR estimates are too high?
Going forward, I’ve seen some say that they think that companies are going to proceed with more caution in the resource plays. With that in mind, do you think its reasonable to expect production to increase from the current 4 mmbpd to 6 or even 8-9 mmbo? (I guess to achieve the EUR numbers in a reasonable time frame, that has to happen. I just have a hard time seeing Permian Basin production doubling.)
In that light, what would have to happen to Permian basin infrastructure to accommodate that?
thanks,
Also, Dennis,, what is the total production to date for the Permian resource plays?
Are you able to separate conventional Permian production from unconventional, or is the conventional production low enough that it is included, but just gets lost in the noise?
SouthLaGeo,
TRR estimate comes from USGS, the ERR is based on my own analysis. I assume natural gas can be sold at about one dollar per barrel in costant 2019$, royalty and taxes assumed to be 28.5%, transport cost at $4/b, and LOE at about 13/bo, full cycle well cost assumed to be 9 million all of these in 2019$.
Discount rate assumed to be 10% per year and interest rate 7.4% per year.
I use a discounted cash flow analysis with average oil and natural gas EUR and assume wells are only completed if discounted net revenue over life of well is more than well cost. That determines ERR.
Note that well completions are paid from cash flow after Dec 2020 in all of these scenarios.
Also note how steep output rises from 2017 to 2018, the rate of increase for scenario is much slower.
About 6 Gb tight oil has been produced since 2000 in Permian and with no new wells completed after Dec 2020 I estimate ERR would be 11 Gb when exising wells stop producing.
Mistake above Natural gas sold at One dollar per thousand cubic feet at wellhead.
SouthLaGeo,
Chart below is same as figure 2 from the post but with a log vertical scale to show the rate of increase of output in percentage terms (slope of curve being percentage rate of growth for a positive slope. Output increased in the Permian Basin by roughly a factor of 4 from 2015 to 2020 (from 1000 kbo/d to 4000 kbo/d). My scenario has output increasing from about 4000 kbo/d in 2023 to 8000 kb/d (a factor of 2 increase) in 2036, so 13 years for a doubling vs about 2.5 years during the 2015 to 2020 period. To me this seems fairly conservative (I am using the E64 scenario).
There’s more to be had from the Permian for sure, but the CEO from Pioneer sees little growth for several years in the Permian and says the Bakken and Eagle Ford are tapped out.
https://oilprice.com/Energy/Energy-General/Pioneer-CEO-Paints-Gloomy-Growth-Outlook-For-US-Shale.html
” A priest, an engineer and an economist were stranded together on a desert island. Given their location, fish seemed to be a logical source of food. So, they discussed how to get some. The priest said that the three of them should pray. The engineer said he thought a better approach would be to fashion a net from materials on the island. The priest and the engineer then turned to the economist for his input. With his hand on his chin, the economist thought for a moment and then looked up and said, “Assume a fish.”
“What is so obviously missing, of course, are physical resources. Hence, “assume a fish” illustrates the slight of hand which most economists perform when referring to the physical world.”
https://resourceinsights.blogspot.com/2020/12/the-priest-engineer-and-economist.html
Many thanks to Kurt Cobb for this.
Dennis, Respectfully, I think you should take up fishing.
Note that the resource estimate come from geophysicists at USGS.
The economics makes cost and price assumptions to determine how much of thecresource is profitable to produce.
Parables are entertaining, but tell us little in this case.
Without meaning to speak for him, I think John S is referring to the EROEI of shale. Which is roughly 2:1. The money can always be printed but the underlying resources to extract shale, can’t. They must be sourced from inventory or the economy at large.
Hume,
For and individual product such as oil, a producer on the microeconomic scale is concerned with producing money, not energy. EROEI has no bearing on individual producers decisions, only cost and price. On a societywide scale EROEI matters for all products produced, but no single product is determinative.
Basically, the oil is physically there, if cost to produce (in dollars) and revenue (determined by oil prices primarily) make it profitable to produce, then it is likely to be produced.
Dennis,
“Basically, the oil is physically there, if cost to produce (in dollars) and revenue (determined by oil prices primarily) make it profitable to produce, then it is likely to be produced.”
Shale oil hasn’t been profitable, yet it’s still being produced. You could argue profit can be made on volume, although this wouldn’t account for all dry holes being drilled which needs to be paid for out of any surplus an operator can realise.
Yes it has not been profitable yet. It will be for the scenarios presented. The average well includes dry holes. Average is total output divided by all wells completed which includes dry holes.
The problem being pointed to here is that the cost of oil drives the costs of production. If EROEI is too low, the cost of producing the oil will increase faster than the profit from selling it.
Hume,
I was not really thinking about EROEI. I was thinking about the 31,000 unconventional wells in the Permian basin and looking at a well productivity cumulative distribution chart for these wells at 120 months of production from Shale Profile. ( Sorry, I couldn’t figure out how to post a pdf chart at POB)
How could these wells, which at 120 months shows pretty exactly how these wells have performed over 10 years and future wells wont get any better produce the oil to meet Dennis’s assumptions?
My brother-in-law is a former USGS geologist. Reading one of the USGS reports and believing it is reality is the same as looking at a Sears and Roebuck toy catalog when I was child and believing that Santa would bring me every toy in the catalog.
IMHO, Dennis assumptions/ models are not based in reality. You cannot wish fantasy into reality if you never leave the fantasy.
2019 average well will likely have an EUR of 420 kbo and another 200 kboe of natural gas. I use data from shaleprofile.com to make the EUR estimate.
Dennis,
Will you please tell me the EUR you are using for your average 2017 Permian Basin wells and what your model estimates for cumulative production and average daily well flows for the average 2017 well after 34 months of production (since first flow)?
I went back to Shale Profile and looked at my well productivity distribution chart and there are only 393 wells that have produced for 120 months.
I don’t want to go back further than 2017. I am trying to stay in front of the 2014-2016 price drop. I am getting bogged down in details as I am not a technical person.
Also do you recognize any difference between Midland Basin and Delaware Basin wells for 2017
JohnS,
I do not model Midland and Delaware Basins separately, I just take the Permian Basin average well.
For the average 2017 well my well profile has 222.5 kbo at 34 months after first flow and daily output is 90 b/d. At shale profile the estimate from Sept 2020 is 224.2 kb of cumulative output after 34 months for the average Permian basin well. For 2018 average Permian well cumulative output is 197 kbo after 22 months, my well profile has cumulative output of 196.6 kbo after 22 months from first flow. For 2019 wells after 10 months the average well has 141.6 kbo of cumulative output, my wellprofile has 140.4 kbo at 10 months for the average 2019 well.
Well profiles EUR is assumed to decrease starting in Jan 2020 for my scenarios, also well profile EUR increases from 150 kbo in 2010 to 420 kbo in 2018. Chart below has well profiles for the years 2020, 2030, and 2040 (there is actually a slightly lower well profile each month in the model) for the T75, E64, P75 scenario.
John S,
EUR for 2017 well is about 375 kbo for the well profile I use which assumes the well produces until reaching 8 bo/d at end of life.
Sorry for small chart in comment above, click on it to expand.
Dennis,
Respectfully, I can put you into a 84 well cube multi-horizon, primarily Wolfcamp D prospect in the heart of the Permian Basin! There are other multiple objective horizons shallower and deeper But the Wolfcamp D is the primary objective And I think it is the USGS sweet spot in the Permian. I have a very reputable operator who will operate on a contract basis. Cost overruns should be kept to a minimum. I am not as confident in the crude oil purchaser, but we will keep an eye on him.
2 15,000 foot laterals, 10 10,000 foot laterals to start. I am going to scale up the vertical well cum production in the area by a factor of 5 to get an EUR of 1.5 MM barrels of oil so we cab get all the benefit from the USGS TRRs.
You must take a minimum 1% interest in the project. Initially, I will AFE you just for the 12 Wolfcamp D wells at $4 MM and cash call you for your share of $40,000 per well up front, (standard industry practice) Total initial investment $480,000 up front. Cost over runs will be cash called too. By approving the well AFE you are in for the project, no matter what the final cost. If you don’t prepay on any AFE cost overrun the penalty for is forfeiture of your interest and your sunk costs ( again, standard industry practice).
Are you interested? Where do I send the JOA and AFEs? Welcome to the Permian Basin!
I need other working interest partners. Any interest?
“Dennis, Respectfully, I think you should take up fishing. ” 🙂
Good one John S , but I like it with Dennis here , maybe later . Take care .
John S
Thank you for the wonderful story. It made my day.
Yields on long term US treasuries finally picked a path. So we have a steepening yield curve until FED decides it wants to cap rates. Everybody is on the same side of the boat here. They are short the dollar. Long stocks, Long commodities, short long term bonds. Steepening of the yield curve is dollar bullish until Fed caps rates. And right now they aren’t talking capping rates they are laying out the plan to taper QE which is the exact opposite of capping rates. Keep in mind Biden is promising trillions. And should be able to deliver now.
This is the set up for the dollar wrecking ball to return. Everybody assumes trillions in spending will be dollar bearish. It matters where the money comes from. If the FED is tapering QE at the same time the US treasury and government are blowing out debt. There is nothing dollar bearish about that. And there is the dollar short squeeze wrecking ball.
Price of oil at the end of 2021 will be mainly determined by what the FED does or doesn’t do.
HHH, the next Treasury secretary is Janet Yellen and she was also Fed Chairman . She knows a lot about coordinating with the FED . However ,the problem now is that matters are spinning out of control and day by day the authorities (politicians +FED+ Treasury) are flying blind for a solution . It is now a matter of not ” if” but “when” and “what” will trigger the collapse . My take is that it will start in the currency market when a CB ( best bet UK) will run into trouble and that will lead to contagion in other markets .
HHH,
The petroleum market reacts to supply and demand fundamentals. Financial instruments can abate demand pressure, but can’t act as a substitute for the commodity. The U.S. has more or less abandoned shale. Energy policy will focus on global supply outside it’s economic sphere. Namely Iran and Venezuela.
Dennis
Those are a lot of good and interesting “What-if” scenarios.
Many of the participants on this site have noted in the past that drillers go after the sweet spots first. The latest data on Permian well quality indicates that well productivity/quality has begun to flatten and possibly roll over. So, what have you assumed for well quality going forward. In other words, are the total barrels and production profile constant for each new well activated each year? If so, is it a reasonable assumption?
From March to October 2019 the number of well completions was close to 500. I note that your Figure 14 shows higher rates from 600 to 800 completions per month for a few years before beginning to decrease. What will be driving drillers to complete so many wells per month? The concept of drill drill drill reduced the price of oil from $70/b in May 2018 to the low $50s in late 2019.
This raises the question for these drillers of what is the optimal drilling rate to maximize their profit and keep oil prices and costs at sustainable levels. Does your model contain feedback loops that cause costs to increase as demand for rigs and personnel increase and associated shortages begin?
Ovi,
I assume sweet spots are drilled first and gradually producers will move to less productive areas.
No costs are assumed constant in real terms, note that well costs per barrel of oil produced have mostly decreased from 2010 to 2019. Also and assumption of decreasing new well EUR (as in my scenarios) with constant well cost is am assumption of increasing costs per barrel of output. Note also that in 2019 the average oil price was about $62/bo for Brent in 2019$, so if we were to assume higher oil prices increase costs, we never reach that case for the $56/bo scenario and it would be several years (until 2026) until we get to that case .
EUR for three TRR cases with maximum Brent oil price at $75/bo in 2019 $.
Well completion rate (12 month centered moving average) for Permian basin scenario with TRR=75 Gb, ERR=64 Gb, total wells completed=184 thousand, Brent oil price maximum= $75/bo in 2019$.
Well completion rate reaches 500 new wells per month in 2025 for this scenario, note that by this time other tight oil plays such as Eagle Ford, Niobrara, and Bakken will start to see reduced oil completion rates so there will be excess rigs and fracking equipment that can be put to work in the Permian basin. Also by 2026 Brent oil prices are assumed to rise above the 2019 price level so there may be an incentive to gradually increase the completion rate as oil prices will continue to rise to $75/bo by 2030. Like every scenario of the future, these are WAGs that are likely to be wrong, I have chosen 9 possible scenarios out of an infinite number of possible futures, odds are very low any scenario chosen will be correct.
Scenario below uses TRR=75 Gb, but assumes a 600 well maximum completion rate (7200 wells per year) vs original scenario with 724 well maximum completion rate (8688 wells per year). ERR drops to 60 Gb from 64 Gb and peak output drops to 6670 kb/d from about 7685 kb/d for original (E64) scenario. Total wells completed drops to 172 thousand wells from the original scenario with 184 wells completed.
chart 2 comments above is mislabelled the lowest line should be T44, P75 and the middle line should be T75, P75, the labels are reversed. sorry.
There is one more thing in the balance. The shale oil producers have 200 billions dollars of debts to payback in next years. At the end of 2019, the number of new wells was decreasing and the financial health of shale oil companies was improving, meaning that the shale oil producers were lowering their investments (drilling and completions of wells) in order to be able to pay interests on their respective debts or payback in advance part of their debts. Then, the level of drilling activity at the end of 2019 could be a figure to estimate the level of drilling activity compatible with profitability in future. But, this is also an ouroboros. Indeed, at the end of 2019, the output growth was slowing down, meaning that in future, less cash would be coming from less wells in activity. And meaning, more precarious financial health for shale oil companies.
Jean,
Note that for my Permian scenarios, I assume a constant well cost of 9 million per well in constant 2019 $ (wells were shorter and cheaper from 2010 to 2016 so this likely overestimates capital costs) I calculated accumulated debt using well costs, LOE, royalties and taxes, transport costs and oil prices over the Jan 2010 to Sept 2020 period and also assume average annual interest rates on debt of 7.4%. After Sept 2020 wells are financed out of cash flow for future wells, based on these same interest rates and other economic assumptions and the price scenarios presented.
Chart below is for my Permian Scenario with TRR=75 Gb and ERR=64 Gb, 184 thousand total wells completed, and Brent oil price maximum of $75/bo in 2019$.
Debt is completely paid back by 2029 and cumulative net revenue (cumulative profits) reach 928 billion 2019 US$ by 2050.
Quite a lot of talk about cities emptying. Hard to see how that’s going to reduce consumption.
Significant pockets of good quality oil (and gas) now being developed offshore Guyana and neighboring Suriname.
EXXON’S MEGA OIL FINDS IN GUYANA ARE JUST THE BEGINNING
“This is a highly profitable asset for the integrated oil major, even with weaker oil prices, because of its particularly low breakeven costs. According to partner Hess, which has a 30% interest in the block alongside Exxon’s 45% and CNOOC’s 25%, the Liza oilfield is pumping crude oil at a breakeven price of $35 per barrel, and this will fall further. Hess claims that the breakeven price for the second FPSO to be deployed, Liza Unity which is scheduled to commence operations in 2022, will pump crude at an even lower breakeven price of around $25 per barrel. With an API gravity of 32 degrees and 0.58% sulfur content, the crude oil produced from the Liza field is relatively easily and cost effectively refined into high quality low sulfur content fuels. That will ensure that it does not sell at a significant discount to the international Brent price benchmark.”
https://oilprice.com/Energy/Crude-Oil/Exxons-Mega-Oil-Finds-In-Guyana-Are-Just-The-Beginning.html
What is the consensus on the Kavango basin and the prospect of the much touted 120 billion barrels of oil it might contain?
It’s too early to tell regarding the Kavango Basin (onshore Namibia and Botswana). At this stage, the 120 BBO is pure advertising hyperbole. Attached is a link to a 2019 vintage geology overview of the area from GEO ExPro, a very reputable petroleum geoscience publication.
https://www.geoexpro.com/articles/2019/10/the-hydrocarbon-potential-of-onshore-namibia
Comparisons have been made to the Permian Basin – at least similar age rocks, large footprint, onshore setting. It seems like there has to be something there worth pursuing, but there have been very few wells drilled, and some of those have not tested the most prospective intervals, and also very little seismic. Could have significant conventional and unconventional potential.
This is definitely an area to keep an eye on.
Southlageo,
Thank you for the link. It seems as though there hasn’t been sufficient test drilling to come to any definitive conclusion as to the hydrocarbon potential of Namibia. Although Nick Steinsberger (who I read is a big name in the shale industry) believes in the project.
Obviously my interest centres around Reconnaissance Energy who owns the rights to the entire sedimentary basin. All 8.75 million acres of it. Do I take a punt on their ridiculously cheap share price or do I wait and watch and keep buying up Exxon Mobil who have an interest in the Namibe Basin?
Hume,
I did look at some of Recon’s materials, including an online presentation from January-2021. Nick Steinsberger is one of the technical consultants and board members referenced in the presentation – a drill and completions guy. They appear to have a pretty strong technical team.
They have plans to drill 3 initial wells. They spud the first well in December-2020. Their objectives for these wells are to test out the petroleum systems – source rock quality, reservoir presence and quality in particular – and not necessarily to test prospects in favorable structural positions. So I interpret that to mean they could have “geologic” successes without finding any oil.
They’ve raised enough capital to fully fund this drilling campaign.
Hume , little I know about the Namibia basin . However I can assure that it will not be devolped . Shale was/is a US phenomenon just like tar sands is Canada . That is why shale in Argentina is loosing money ,they gave up the leases in UK . Shale was possible in USA because PPS( Petroleum Production System ) was already in place . To devolp new roads ,pipelines refineries etc in Namibia is just prohibitive . If the oil extracted is difficult and too expensive to send out to six Joe pack in Montana then it is not going to be extracted . Lack of proper and COMPLETE infra is why shale has not been devolped in the other parts of the world . No investment advice ,just an opinion .
Hole in Head,
The objectives in the Kavango basin are both conventional and unconventional. I’m sure Recon would much prefer to find large conventional discoveries.
You are right about infrastructure – it is lacking in this part of Namibia, making unconventional resources that much more challenging.
Hole In Head,
When this particular topic popped up my first inclination was as yours. For an operator it is understood that everything about a new well is theoretical until the truck comes and buys your oil.
While details are foggy, I recall that a great deal of conventional oil was discovered a dozen years ago in Uganda and Kenya and to the best of my knowledge it still resides where it was found. That is not to say it will never represent significant levels of production.
I would gladly accept some education from someone more informed.
Dennis,
I agree with your comment earlier that it is EROI of society as a whole that is important for determining how much shale oil will be extracted but you are missing something fundamental here in all your assumptions.
The purpose of shale oil or any other fossil fuel extraction is to provide energy to the society along with providing energy for the process of extraction itself. This process includes drilling ,fracking ,extracting, transporting, processing and finally delivering the oil to the consumer.
All of these steps require energy and there must be significant energy leftover after this for the energy source to be reliable. This is the difference between Saudi oil and U.S shale oil.
Remember MONEY IS A LIEN ON ENERGY. This is why shale is unprofitable and always will be. In fact after sweet spots are gone it will become even more unprofitable as EROI further decreases.
Your point about societal EROI being important is absolutely correct. Because we still have high EROI sources in U.S like shale gas, coal, nuclear, hydro along with imported energy products this allows us to go after low EROI sources like shale oil. Once those start to decline it will not be possible.
So your projections may be mathematically be correct but are completely removed from reality.
The purpose of shale oil or any other fossil fuel extraction is to provide energy
Not really. Energy from other sources (coal, natural gas, wind, solar, etc) is much, much cheaper (and higher net energy). The purpose of oil production is to provide liquid fuel which is a form of portable storage of energy.
MONEY IS A LIEN ON ENERGY
Nah. Money is just a medium of exchange: a way of buying and selling stuff.
Why are oil exporters in such trouble these days? Because they thought that natural resources were the primary source of productive value, and that countries with large natural resources were “set”. IOW, they thought that their resources would take care of them, kind’ve like a benign father figure takes care of children.
Actually, it’s intellectual capital that does the trick (combined of course with hard work and natural resources). If you send your kids to madrassas (or yeshivas or seminaries) to learn nothing but religion, you will eventually end up like Venezuela, Russia, Saudi Arabia and Oklahoma: stagnating economically, looking for get-rich quick schemes and blaming outsiders.
NIck,
This type of comment is what drove me away from even simply reading the POB comments for my edification. When you went on a jag a few months back pummeling folks that I will categorize as religious, you went way, way too far beyond making any rational point.
Venezuela, Russia and SA have nothing in common with Oklahoma anyway.
FYI, I’m a Christian living in OK who works for a living in the business with a PE, primarily using my hands and you would be welcome here. That’s one thing that makes us different.
Yeah, my apologies. My last sentence was way, way too general, and I shouldn’t have included Oklahoma. I’m aware from personal experience that it’s oil industry is declining, and I’ll admit that I’m a little stressed lately by what I perceived as Christian In Name Only rural folks traveling to Washington DC, taking their misplaced frustrations out in a destructive way, so that may have flavored it a bit. OTOH, I really didn’t mean to slam religion, I meant to criticize bad education. BTW, you’d be welcome here, as well.
I’m afraid that distracted from a serious point: people on POB, as well as people in resource-rich countries, tend to place too much emphasis on physical resources, and too little on education and innovation. Countries like Venezuela, Russia and KSA have become way too dependent on oil.
Nick,
Thank you for your contrite response.
Most of us are stressed right now possibly beyond that which we’ve endured in our lifetimes. The problem with people is that they’re human and therfore flawed. Not to continue any sort of lecture but when one is put on the defensive, the true exchange of ideas is stunted and for some completely stopped.
While this is an energy blog, I’m going to be brief here. Being a Christian is a process not a static existence of sinlessness; of having arrived. It takes great restraint in these times to lead by example, for lack of a better word at this hour. Some are better equipped and/or disciplined than others.
Regarding your last point, I would say that it’s hard to learn and improve our world when are hungry, cold, naked and subjugated. I think that I hit on the basic human needs.
Shalom.
Nick,
Perhaps a discussion of education and religion etc is more appropriate in the Non-Petroleum thread. Generally religion is a topic that should be avoided in my opinion, lots of heat and little light is generated.
Dennis,
While your comment was directed at Nick, I must own my participation.
What I did in discussing those matters here was intentional as the frays of the recent past were also on the petroleum thread. I might guess that some folks who were somewhat affected by those comments don’t necessarily visit all of the threads.
I respect what has taken place here to, let’s say, manage the site to greater productivity and the only reason that I finally got involved was your efforts. My sole goal last night was to add some humanity and elicit some in return. After all, this whole site, at the end of the day, is about what has, is and presumably, what will happen to humanity.
Thank you for your accommodation.
Rasputin , cool down . I am 100% in disagreement with Nick always and about 50% in disagreement with Dennis ,but that does not inhibit us from airing over viewpoints . As long as the exchange is civil ,it is acceptable . Ok if you fire a volley now and then that also is within the range . The forum needs real oilmen like you as SS, SLG , Mr Kaplan and Mike S to educate us non oilmen on how the most precious commodity on the planet gets to our fuel tank . Your input is greatly appreciated .
Dennis,
I agree.
I included religious education primarily because I had a train of thought about OPEC, whose members I believe have depended far too much on oil, and greatly overestimated how much oil can provide for their economic security. KSA in particular has promoted purely religious education which has crippled their citizens’ ability to think and be productive.
Rasputin,
It was Nick who initially extended a discussion of oil into education and religion, areas that are better in the non-petroleum thread where almost anything goes. Often oil industry folks are not really very interested in the same topics as Nick and the way he frames them is often offensive. I make similar mistakes myself, but I am trying to be better.
Nick,
Probably if you stopped with education and held off on religion, many might find it less offensive, religion is a very sensitive topic for many and it is doubtful that any discussion on that topic will be useful in my opinion, unless one’s aim is to piss people off, in that case your just trolling and many will click on the x next to your name and you will be ignored.
Hi Dennis,
As I think you know, I do try very hard to avoid personal offense. As I look over my comments about religion, I see where they could be misconstrued: in particular, I think that KSA’s educational practices are harmful in the same way that schools that taught nothing but sports or movie-viewing would be: they aren’t intended to teach work skills. Actually, I think that’s by design: the KSA royal family doesn’t want citizens to interfere with the running of the country, so it’s better to avoid empowering them with work & managerial skills and give them do-nothing government jobs, and have skilled expat non-citizens actually do the work.
I think that shouldn’t be offensive to anyone here…let me know…
Kira,
We will see, so you think all 9 scenarios are unrealistic? Note that if my EUR estimates are correct (they are likely to be conservative), tight oil wells that have already been completed through September 2020 will produce about 11 Gb of tight oil from the Permian basin (about 6.6 Gb have been produced from Jan 2000 to Nov 2020). I agree the highest cases are not very realistic, but disagree strongly that the scenario with TRR of 44 Gb (USGS estimates there is about a 95% probability that the tight oil resource is at least this large) and maximum Brent price of $75/bo which has an ERR of 39 Gb (so about 28 Gb from wells completed after Sept 2020) is very realistic and likely this level of output will be exceeded, my best guess remains about a 60 to 70 Gb for the mean USGS TRR estimate.
The EROEI is not an important consideration in my view, there is plenty of surplus energy from nuclear, wind, solar, coal, and natural gas, as well as from stripper well oil, Middle East Oil, Offshore Oil, and Russian oil on a Worldwide basis and that is all that matters.
Money is not a lien on energy, that is an assertion, not a fact.
Dennis,
Your scenarios are correct conditionally, and the condition is that the EROI of other sources is maintained for the timeframe in your scenarios.
Lets do a simple thought experiment. Consider U.S to be an isolated system which has to power and maintain itself through high energy flows.
The sources of energy that are internal(domestic) with high EROI are Natural Gas, Coal, Nuclear and Hydro.
The external sources with high EROI are petrochemical products, imported Oil.
(Solar panels and Wind Turbines are also imported but have very low EROI when taking storage into account so I have excluded them)
Fracked Oil has low EROI so it has energy deficit by the time it reaches the consumer after all the steps I mentioned in my previous comment.
This deficit is subsidized by the energy sources mentioned above in the physical world. In the financial world the deficit is subsidized by debt and this is what makes fracking unprofitable at any price.
Consider this scenario – Lets say we produce 50-60 million barrels of fracked oil per day in U.S with low EROI and try to power everything with it and reject all high EROI sources internal and external. This would not be possible because there will be very little net energy even if aggregate energy is more than enough.
Also EROI of fossil fuels that you mentioned will decline or is declining after a while so I wouldn’t count on them for a long time
Kira,
One can create thought experiments where there is a net energy deficit, but in the real world it is physically impossible. Wind and solar create plenty of net energy, natural gas, nuclear, and hydro can fill the gaps, also a highly interconnected system with wind and solar widely dispersed has very little need for storage.
When we do a thought experiment is is best not to include unicorns. 🙂
Do any of my scenarios have even close to 50 or 60 Mb/d of tight oil? For all US tight oil and the “average” Permian scenario presented in the post in figure 3 for the $75/bo scenario US output peaks in 2029 at 9 Mb/d (roughly 11% of World C+C output).
EROEI, just is not that important for individual energy products.
Dennis,
The thought experiment that I described is how the world works in reality. Just because a product was imported to U.S does not mean it magically appeared out of nowhere. I know it is tempting to think that way. But it was manufactured elsewhere with energy inputs or it is an energy product itself.
What do you possibly mean by “but in the real world it is physically impossible.”?
Lets say a barrel of Shale Oil has 100 Joules of energy. At the wellhead you may only need 20 Joules of energy to extract. But taking into account the energy for drilling, fracking, moving frack sand, transporting, refining and everything else the energy may exceed 100 Joules by the time it reaches the fuel station. And it is from this fuel station that fracking companies will also fuel their machines since they cannot use the fracked oil directly either without processing. This deficit in energy is what causes fracking to be unprofitable.
It has been documented by people like Charles Hall (the man who coined the term EROEI) that Solar and wind have low EROEI.
Also Solar Panels and Wind turbines use fossil fuel for the manufacturing process. If you try to replace that with electricity (if its even possible since many processes require temperatures that electric furnaces cannot reach and heavy machinery that cannot be powered by electricity) the net energy will be either very low or may go into negative. If you want to read any further about the problems of Solar and Wind here is a link.
http://energyskeptic.com/2017/eroi-explained-and-defended-by-charles-hall-pedro-prieto-and-others/
Also because of intermittency and low energy density Solar and Wind are incredibly difficult to scale up as seen with Germany’s disastrous “energiewende” program.
https://damnthematrix.wordpress.com/2019/07/20/how-not-to-run-a-modern-society-on-solar-and-wind-power-alone/
I never said any of your scenarios project 50-60 million barrels of tight oil. Please read my comment completely before replying. I said
“Consider this scenario – Lets say we produce 50-60 million barrels of fracked oil per day in U.S with low EROI and try to power everything with it and reject all high EROI sources internal and external…..”
It was to explain my point about problems with using low EROI sources like shale oil exclusively for powering our modern civilization without taking net energy into account.
Kira,
The point is that 50-60 Mb/d of tight oil production will never happen, that’s your unicorn. So yes, I did not say it, you did, and it is not a thought experiment worth considering, kind of like, lets say we have viable fusion reactors.
As to physical reality, I look at things from a World perspective.
Perhaps you would agree that EROEI for all energy sources used worldwide of less than 1 is not physically possible long term.
That is my point, it is not physically possible. As to individual prices of a product, net energy does not determine that, the assertion that energy is the source of value is nothing more than an assertion without proof. It assumes what needs to be proven.
Any good can be used as a measure of value, Marxists like labor, but we could use bananas, gold, water, energy, or capital, all would work equally well using an input output matrix and some simple linear algebra. You assume energy determines cost, not really true in practice.
As long as low EROEI energy products are profitable to produce due to high demand due to their convenience, they will be produced. As long as total net energy for all energy produced by society worldwide(including all processing and distribution and energy used for inputs to the production process) is positive, there is not a problem. If energy becomes scarce it will become expensive and will be utilized more efficiently.
Also keep in mind that 2/3 of fossil fuel energy produces only waste heat, a move to electricity for powering transportation will reduce much of this waste. Likewise wind and solar energy due not suffer from this waste heat production. Widely dispersed highly interconnected wind and solar output leads to perhaps 10% of average electricity load needed to fill in gaps when system wide wind and solar output are low, this is easily provided by natural gas peaker plants or even from green hydrogen produced during periods when excess output is provided by the system.
The analysis by Hall and Prieto is not very good.
Dennis,
I know Kira will be along soon to reply, but I couldn’t resist, especially with what serves for rational thought in your response.
“As to individual prices of a product, net energy does not determine that, the assertion that energy is the source of value is nothing more than an assertion without proof. It assumes what needs to be proven.”
If what you wrote here were true how do you explain the petrodollar system which underpins the value of the U.S. dollar? The world reserve currency I might add.
“As long as low EROEI energy products are profitable to produce due to high demand due to their convenience, they will be produced.”
Neither shale nor renewables are profitable or convenient. Both are heavily subsidised through higher yielding EROEI energy sources. Kira has already made this point, though it wasn’t addressed so it’s worth restating.
“this is easily provided by natural gas peaker plants or even from green hydrogen produced during periods when excess output is provided by the system”
To store the hydrogen in a liquid state at atmospheric pressure it must be cooled to -252 degrees Celsius. Where do you suppose the energy is going to come from to achieve this?
Hume,
Petrodollars don’t exist. They used to exist, somewhat, when OPEC nations were accumulating large dollar reserves, but now those countries are bleeding deficits.
Renewables are profitable and convenient. They aren’t subsidized by FF. Remember, horses hauled oil barrels, until they didn’t. Diesel will install solar….until it doesn’t.
Hydrogen stores quite well underground, IF it’s needed:
“ Underground hydrogen storage is the practice of hydrogen storage in caverns,[1][2] salt domes and depleted oil/gas fields.[3] Large quantities of gaseous hydrogen have been stored in caverns for many years.[4] The storage of large quantities of hydrogen underground in solution-mined salt domes,[5] aquifers[6], excavated rock caverns, or mines can function as grid energy storage[7], essential for the hydrogen economy.[8] By using a turboexpander the electricity needs for compressed storage on 200 bar amounts to 2.1% of the energy content.[9]”
https://en.wikipedia.org/wiki/Underground_hydrogen_storage
Nick G,
https://www.quora.com/Can-we-think-of-hydrogen-as-a-future-fuel
Quote from poster Dave Mohr
“I don’t know why we would be thinking in that direction— at least not at this point. I get the impression that some folks see hydrogen as ‘something magic’, but, when we get down to engineering details, that ‘magic’ tends to vanish. I should add that this tendency follows the same path as anything ‘new’ does, as we start to find out more about it.
At the moment, we should consider hydrogen to be a ‘fossil fuel’. Reason—at the moment, hydrogen (at least that I have any experience with) is obtained by distillation of natural gas, which is certainly a fossil fuel. This distillation process is quite energy-intensive, and kind of (at this point) ‘punches some holes’ in the idea of hydrogen as a ‘green’ fuel.
At the point where we exhaust our fossil fuels (or before that, perhaps) hydrogen is obtainable thru ‘electrolysis’ of water. This is a common high school science experiment. It seems like ‘magic’. However, what this experiment does not demonstrate is that the thermal efficiency associated with the process is approximately 8%. It’s not very cost effective—which is why we switched to distillation of natural gas in the first place. If you don’t like the idea of $3 per gallon gas, you ain’t seen nothin’ yet.
As far as use of hydrogen in automobiles is concerned, there are (at least) a couple of quite ‘sticky’ problems involved.
First, the ‘energy density’ of hydrogen is pretty bad compared to what we are accustomed to in the design of cars. Although hydrogen has about 3 times the ‘heat of reaction’ of gasoline (on a per-pound basis), its density is so low that a fixed-size gas tank that holds hydrogen will store only about 1/4 the energy of the same size tank holding gasoline. This does not (at this point, anyway) bode well for the un-refuelled range of the automobile.
Second, in order to maximize the density of the hydrogen, it will need to be stored at temperatures of below -400 deg F. Tanks like this in a 10–20 gallon size cannot generally be insulated very well, and loss of our car’s fuel due to ‘boiloff’ of the hydrogen (over a weekend, perhaps) becomes a very disturbing problem.
Lastly, hydrogen is an enormously difficult stuff to store without leaking. When coupled with the fact that the leakage is an explosive gas that is now in and around the ‘confined structure’ of a car, we create a new problem (that hydrogen people have to deal with routinely) called ‘Hazardous Gas Detection’.
None of these problems are particularly insurmountable, but it does tend to make one question why we would want to move in this direction (at least at this point).
To summarize, I suppose we could think of hydrogen as a ‘future fuel’, but that’s different from implying that it is a particularly desirable one.”
Hume,
That discussion is about hydrogen as a fuel for passenger cars. It makes perfect sense…for passenger cars. Batteries are far cheaper and more energy efficient…for passenger cars.
But when I’ve discussed H2 recently on POB, it’s been primarily as a centralized storage for seasonal (winter) storage. That’s a very different animal. It can be stored very cheaply underground in salt caverns, old oil wells, etc., and it can be powered by clean & cheap surplus wind & solar power.
Another potential use is for large fleet vehicles: long-haul trucks and long-distance container shipping.
———————————-
H2 for these purposes has a lot of competition:
seasonal renewable intermittency can be solved by long distance transmission; overbuilding; other forms of storage; DSM; etc., etc. One of these may win out, though it’s far more likely that it will be a synergistic combination of all of these.
Similarly, fleet vehicles could be powered by batteries; onboard PV; synthetic diesel, methane, methanol, ammonia, etc., etc.
There are lots of competitors…
Nick G,
A hydrogen future is a non starter. Ignoring the problems of generating hydrogen and storing it won’t make those problems go away.
Hume,
Who’s talking about “a hydrogen future”? I’m talking about something much more limited. Your use of that phrase suggests to me that you’re not clear on that.
Okay, now…what’s the problem with generating hydrogen that you’re concerned about?
“(Solar panels and Wind Turbines are also imported but have very low EROI when taking storage into account so I have excluded them)”
I see things differently.
Wind and solar power can go a VERY long way in terms of reducing demand for coal, oil and gas.
The EROI on wind and solar power is EXCELLENT, even considering curtailment due to excess capacity at certain times.
Storage is not yet a real problem, except for the loss of production due to curtailing output.
We will be able to use several times as much wind and solar juice as we do today without much if anything in the way of new DEDICATED STORAGE INFRASTRUCTURE.
Electric cars and trucks will be charged opportunistically anytime wind and solar production is high and other demand is low.
Houses, appliances, stores, schools and industrial infrastructure can be optimized to use wind and solar electricity without batteries as such.
You can for instance for trivial amount of money triple the size of an existing worn out water heater, currently running exclusively on gas or coal juice, so that it can be kept topped off with wind and solar juice. This in effect creates a defacto battery that will last indefinitely with zero maintenance and hold charge for anywhere from three or four days to a week in a typical household, even with cloudy rainy weather with little wind.
A heat pump running opportunistically when renewable juice is cheap can be used to chill or heat a large tank of water or a couple of truck loads of gravel dumped into a crawl space during new construction, and the energy captured this way is available for later use.
There are numerous people who could justify spending ten grand on a solar installation of their own, if they could buy a reliable second hand electric car cheap……… because they would save enough on gasoline, maintenance and repairs by driving that electric ANYTIME IT’S CHARGED UP rather than driving their existing pickup.
Consider an auto parts store that has two or three pickups doing a hundred miles plus per day in stop and go traffic. They typically have at least one spare for really busy days or days one is in the shop.
A number of my tight fisted neighbors would do the same thing….. install solar and buy an electric car…. if both could be had somewhat cheaper than at present.
The smart grid is a real thing….. and it will be coming to your town soon.
But not for eight billion people. Ever.
I know it feels nice to be a suburbanite driving a Tesla powered from a Power Wall and Solar City PV cells as one goes to Whole Foods. So long as you’d don’t believe this is even remotely doable for civilisation.
There simply isn’t the fossil energy to grow this out and support it.
And given projections for how much fossil fuels we’ll be using decades from now, seems a lot of people would agree with me who happen to be in this industry.
I could provide extensive research to show that these ideas are unrealistic, but…isn’t this kind of disccusion supposed to be on the non-oily side?
Kira,
At some point in the procurement of energy the EROEI has to come into play. In this instance the petroleum market regulates the activity for shale oil. John S further up thread outlined (in graphic detail) why backing for shale producers just isn’t there due to the prohibitive costs. Conventional oil doesn’t encounter this problem as it’s EROEI justifies the initial investment.
Hume the costs are prohibitive at $40 to $50 per barrel for tight oil. At higher oil prices (over $60/bo) tight oil can be profitable for a well run company (EOG for example).
But at what cost to the economy? That is the question. We could source hydrocarbons from Titan, as the old joke goes, but I don’t think the market is there for it.
Kleiber,
If resources from Titan could compete in the market we would have them, the reductio ad absurdum argument is not convincing.
Pretty sure nobody is suggesting resources from Titan or other galaxies (to take the absurd to even further lengths) are being proposed.
Talk to those in the oil industry, nobody cares about EROEI and the research is all over the place.
In my 35+ years of oil industry experience, drilling decisions have always been made on economic considerations, not EROEI considerations. Now I grant you that a well with better economics will have a more favorable EROEI, but the decision to drill or not is made on the well’s economics. In fact, I’ve never ever seen an oil industry finance guy calculate EROEI – I wouldn’t know how to do it.
But,, even though I’m retired now, I’m going to try and check this out with people I know from the industry who may know better. Stay tuned on that.
My finance contact confirmed my previous comments.
Yeah, EROEI just makes no sense.
Just as a very very rough example, let’s say an operator replaces on-site diesel generated electricity at 20 cents per kWh with off-peak grid power at 5 cents per kWh (or on-site PV at 5 cents). The EROEI wouldn’t change at all, but the cost of power would be reduced by 75%.
Obviously dollar cost would be the *only* consideration.
My POV on EROEI . First very difficult to calculate because the inputs are electricity ,NG, diesel , lubricants etc and the output is oil . However at the end of the day if EROEI is negative it will show up in the balance sheet . Yes , you can manipulate the balance sheet by taking on debt for some time , delaying supplier payments , fooling new investors but at the end it will emerge , just like it did in shale . You can run but you can’t hide .
Southlageo,
The economic viability of a well is a proxy for EROEI. Simply put an operator isn’t going to spend more on extracting a resource than he gets out of the ground.
Hole in Head,
Well put.
Hume,
You claim EROEI is a proxy for profits, your claim is incorrect.
Listen to SouthLaGeo, he is correct that the oil industry does not consider EROEI, Mike Shellman, and Shallow Sand might agree.
All of these men know far more about the oil industry than me.
When they speak, I listen, sometimes I question, but only so I can learn more.
Dennis, my point was nothing to do with EROI and everything to do with supply and demand at cost. If the oil is accessible at $150, but a third of the globe is priced out, it’s utterly redundant to economic activity even if energetically still useful (which liquid fuels have as an advantage anyway).
No one cares if only, say, the rich can afford a product so vital. iPhones may make killer sales, but Apple is going for profit over market share. Base resources are far more problematic over whether everyone can afford consumer gadgets.
Kleiber,
Market forces take care of high cost. High cost energy sources are utilized more efficiently and substitutes become competitive and replace some of the high cost energy source. If real Brent Oil prices reach $150/bo in 2019 US$, then EV sales for all types of land transport will take off, and more efficient rail will replace long haul trucks and some rail will be electrified. From 2011 to 2014 real oil prices averaged about $110/bo in 2019$, the World economy grew in real terms at about 3% per year over that period. I doubt prices rise to that level for a 3 year period in the future as demand will fall below supply as more EVs will be sold and reduce demand in response. After 2035 I expect World demand for oil will fall faster than supply of oil will fall and we will see decreasing oil prices to balance the World oil market.
My $100/bo maximum oil price scenario for Brent in 2019 US$ is an F5 scenario with only a 5% probability that oil prices will be higher than that scenario (considering 12 month centered average oil prices).
MacroVoices #253 Art Berman: U.S. Oil Production Still Set for Steep Decline in 2021
Art Starts around 18:00
https://www.youtube.com/watch?v=ijyYiqHRPEY
LongTimber,
I would like to preface what I’m about to say by stating Art Berman has forgotten more than I’ll ever know about the oil and gas industry. But yesterday I saw an interview with him where he said the printing of the dollar caused the oil price to fall. I did a double take when I heard that. He also said natural gas prices shouldn’t be over two dollars. When you consider the U.S. had record exports for natural gas in November just gone and the adverse weather conditions in places like Spain where 12 inches of snows has fallen and market supply tightening in Asia. It seems Art might need to step back and look at the whole picture.
HUME,
I tend to agree with you based on what I am learning about some of the operational practices in the
Marcellus. We might know more by year end or it might continue as is. My crystal ball is cinder block brick.
John S,
You have the advantage of me, as I didn’t know what the Marcellus shale basin was until you mentioned it and I googled it. I did learn increased discovery and production of shale and natural gas at that location were in part responsible for low gas prices. A lot of small independent gas producers across Texas and the Midwest are struggling with low gas prices and could face bankruptcy.
Although the European gas import price is double what it is in the U.S. at $5.85/MMBtu. Why aren’t U.S. producers capitalising on the price differential?
p.s. I don’t know what you were referring to in regards to operational practices and how it might confirm what I previously wrote. You’ve ventured beyond my limited understanding of the industry.
Hume,
Art knows about oil, but not much about economics, or that is my impression when I see or read interviews he has given.
Over the past year the Correlation between US Dollar price and Oil price has been NEGATIVE about 87% of the time. And that negative correlation has been quite strong (about -0.73 over past 6 months or so). But this isn’t always the case, but I’d say these dynamics are more important than supply and demand (a frequent almost incessant refrain here at the POB). Maybe at the time of the interview the correlation was positive, but those are rare times.
Twocats,
World oil output is not well correlated with the real price of oil, mostly the output of oil correlates most strongly with real World GDP. For an individual oil producer, the price of oil will affect their profits at the microeconomic level, that is the basis for my model which assumes oil companies try to maximize profits. Not a perfect solution, just simple mainstream economics which may well be flawed.
I have never seen a model that reflects the real world with perfection. I doubt I ever will, particularly when human behavior is involved (inanimate objects tend to be unaffected by knowledge, humans sometimes change their behavior based on what they know).
“World oil output is not well correlated with the real price of oil” sounds like another way of saying supply and demand do not correlate to oil price. which I would agree with.
I’ve seen pretty good data showing oil price volatility corresponds well to uncertainty in supply or demand. I’m not sure you could show this with hard data, but I imagine the influence of supply and demand on price matters most during extreme supply/demand events. Pandemic signals huge demand slump = extended low oil price (Feb to Nov this year). Peak cheap oil signals supply shortfall = extended high oil price (like 2011 – 2014).
But it doesn’t take rocket science to see that when the dollar goes down, things priced in dollars will go up.
Two cats,
No supply can be too high or too low relative to demand.
Here is how it works, real GDP growth determines demand for oil with very little influence from the price of oil. Supply of oil depends on profits which depend on the price of oil. When Oil prices rise oil supply sometimes grows faster than demand for oil leading to an increase in stock levels of crude and petroleum products, then oil prices fall and producers reduce output.
Get an introductory microeconomics textbook at your local library, only basic algebra is needed.
Future oil prices will not follow smooth lines as shown in the above graphs. I know modelling requires oil prices as input. But when we look at oil prices since 2005, when conventional oil production started to peak, we see that high oil prices never lasted for very long (the 2011-2014 period the longest and the 2008 price shock the shortest) and that the price maxima decreased over time: $140, $110, $80. This suggests that the world economy can afford high oil prices less and less. Much like a patient who gets one heart attack after the other. Covid-19 is complicating and accelerating all this.
Matt,
I agree future oil prices are unlikely to follow smooth lines. The fact is we do not know what future oil prices will be, any scenario devised will be incorrect. I think I said this in the post.
Give me the “correct” future oil price scenario and I will use it in the model. 🙂
The middle scenario has oil prices only increasing to $75/bo and the low scenario to $56/bo in 2019 US$ for Brent. Does the “low” scenario seem too high to you?
If oil prices are lower than $56/bo long term, then tight oil output will be lower than the scenarios I have given. My analysis suggests oil prices have been low due to excess oil supply since the middle of 2014. Perhaps the excess oil supply will continue indefinitely, my expectation is that there will be a strong recovery in oil demand when the pandemic is under control in June 2022. There has been a lack of oil industry investment from 2015 to 2020 and supply will be inadequate by June 2022 and World oil stocks will be well below the 5 year average by that point. Oil prices are likely to rise and it is likely my “middle” oil price case will be exceeded by 2023.
I am unconvinced by the affordability argument, oil prices have been low due to excess supply rather than a lack of demand, I doubt that will continue over the 2022 to 2030 period.
I agree with Dennis. The only real reason, other than catastrophic mismanagement or pure bad luck that the world economy won’t grow beginning again in a year or two, depending on how long the Covid crisis lasts, is a lack of essential inputs such as oil, water, timber, phosphorus, etc.
It’s looking as if the demand for oil will be there, and I’m inclined now to believe there will be enough produced to meet the demand…… again assuming no catastrophic bad luck overtaking other oil producers such as has happened in Venezuela.
The immediate real question is how high the price has to go to get it to market.
The REAL bottom line is that supply is determined by demand at any given price.
Politicians and bankers to have the ability to run the price up or down by throwing money at supply…… so if money is thrown at oil producers, they WILL produce more.
So the second question is :
Does subsidizing oil to keep it cheap when the real cost of it is higher good or bad for the economy and the people, taken all around?
My opinion is that it’s good in the short term, because it helps keep the overall economy moving along, rather than stalling and turning downward, perhaps very sharply downward.
In the long term, it’s very bad, because it slows the transition away from fossil fuels, which DO after all deplete, not to mention environmental issues.
SO maybe subsidized cheap oil is actually good for us, in the long term, because it’s allowing us to make the necessary investments in efficiency, conservation, renewable energy, etc, that must scale up five or ten times over at least for the transition to succeed.
Ask anybody familiar with military history, and they will tell you that one absolutely critical piece of good luck for our side in WWII was that we had an ample supply of well experienced men in uniform still with us from WWI ……. men capable getting the job done, not only the fighting itself, but the scaling up of training and all the countless logistical supply infrastructure.
Our only real hope of a successful solution to the depletion problem is to scale up renewables fast enough to cope.
This probably means good times NOW are essential to expanding the renewable energy industries to the point they can grow fast enough later when depletion is staring us in the face rather than from out near the horizon.
OFM,
Why subsidize oil to help the economy? Most of the subsidy would go to higher income folks, as they are the primary consumers of oil, and much of the money would be saved and not spent. It would be far better to just send checks to low income folks, to spend on whatever they need.
OFM , hello , I think you are not being real on worldwide growth . So here is my synopsis for the 10 largest economies of the world .
1. USA ; Devastated by Covid . Only money printing , unofficial UBI and MMT at work . If it was not the reserve currency status it would be third world .
Not interested in assigning blame for Covid mismanagement .
2. China : Heck , no coal for electricity . Just wondering how do electric motors on the machines work?
Covid outbreak No:2 is back in action .
3. Japan : Zombie economy from as long as I can remember . Now they put Greater Tokyo in lockdown and next in line are some other cities .
4. Germany : Has been recording negative growth for the last 3 qtrs . Now in lockdown till 15th March .
5 . UK : Dead duck . In lockdown till Easter .
6. France : Dead . I am surprised Mr Macron is not under a guillotine as is French tradition . ( I live 40 Km from France)
7. India : I have posted several times on the situation there , so will not amplify .
8. South Korea : Tied at the hip to China and japan . No hope .
9. Australia : Idiots . Picked up a fight with China where 40% of there exports were destined .Well , China hit back by putting a duty of 200% on their products . Today China has an electricity problem but ships carrying Australian coal are not allowed to unload .
10 . Canada : Tied at the hip with USA . Self explanatory .
What is your optimism based on ? Please save me the vaccine solution explanation , it is so boring and outdated .
Hole in head,
Clearly you know the future and others do not. I would simply say I think the IMF and World Bank, etc might be correct and you may be incorrect.
The boring, outdated explanation is the correct one, imo.
The pandemic will not last forever.
Dennis , nobody knows the future and both of us make our viewpoint with data or information that is currently available . I have listed my POV based on the info available and listed it above .
The pandemic will be over and even if not it will be brought under control ,but the economic damage it has done will be permanent .The changes it will bring to our lifestyle will also be permanent . The changes will be in the direction of contraction and not growth . That is the summary . As to WB and IMF projection what my opinion on them is already known .
Hole in head,
What is the basis for thinking the economic damage will be permanent, historically that has rarely been the case, in fact the reverse has generally been true. Usually there is pent up demand during a crisis, when it is over money gets spent and the economy rebounds. You assert this time will be different than most of the last 250 years, I think you have provided little evidence why it will be different this time. Yes you have asserted that the IMF and World Bank have not made perfect predictions in the past and thus they should be ignored. I think they have done pretty well as the expectation statistically for perfect predictions of the future is 1 (perfect prediction) divided by infinity (number of possible future scenarios) or zero.
Only Cassandra can meet your expectations. 🙂
Dennis, in reply to Kira you said “As to physical reality, I look at things from a World perspective. ” Do you ? I gave a synopsis of the 10 largest economies . you could not find a fault with my reasoning but went off on a tangent as to what happened in the past etc .
To add, the first quarter 2021 is a washout worldwide . China just put 28 million in lockdown . I would appreciate if you point at a flaw in my POV of the 10 bullet points I have enumerated .The vaccine is a solution to a health issue ,it cannot undo the damage done to the economy , just like a pace maker cannot undo the damage to your heart .
Hole in head,
I agree there has been an economic down turn. Nothing you said gives any evidence that the economic damage will be permanent.
You simply say the economy has been bad during the pandemic for most of the 10 nations, then you assert there will be no recovery.
I agree the World economy has done very poorly during the pandemic, that is rather obvious.
I am unconvinced by assertions that this time is different, that requires some proof.
New reserve estimates are out for year end 2019
https://www.eia.gov/naturalgas/crudeoilreserves/
For Permian Basin proved reserves were about 12 Gb at the end of 2019 and cumulative C plus C production from Jan 2000 to Dec 2019 was 5404 million barrels, so we would expect a minimum URR of 17.4 Gb if probable and possible reserves and contingent resources are zero (this is highly unlikely). If we only assume possible reserves and contingent resources are zero (also not likely) and that probable reserves are about 4800 million barrels (typically probable reserves are about 40% of proved reserves or 2P=1.4*1P reserves) then URR would be 22 Gb, this is fairly close to my low end scenario (ERR=25 Gb) with low TRR and low oil price. Perhaps there are many here who believe such a scenario is more “realistic”, I disagree strongly. Also note that many here have claimed that my past scenarios have been unrealistically optimistic. Over time, my “best guess” scenarios have invariably been too pessimistic rather than too optimistic (where pessimistic means output was lower than reality and optimistic the reverse). We can look back and see if this is true again in 5 years.
My expectation is my best guess scenario (say an ERR of 60 Gb for Permian Basin tight oil) will prove conservative, the 58 Gb average ERR for all 9 scenarios has 25 Gb of cumulative tight oil output by the end of 2030, the peak output for that average scenario is 6800 kb/d in 2032 and cumulative tight oil output is about 29 Gb at the peak.
Notice what grain did today. It is climbing higher yet in the overnight. Grain has been on an absolute tear since last fall.
Oil followed grain down in 2014, about a six month lag. Will it follow grain up in 2021?
We are less than $7 from our WTI sweet spot. Even our guys in the field said they thought oil would spike after the election.
Predicting commodity prices is a tough one, I haven’t figured out after 30 years.
SS, not my department but the Chinese are buying grains left ,right and centre . The floods last year destroyed 37500 sq km of farmland . They just purchased a shipment of rice from India even as both countries are staring eyeball to eyeball on the Himalayan border . Read a book ” Who will feed China” by Lester Brown to know what China’s food requirements are . Interesting info in there . Glad that oil prices are up for you and get some relief . China’s food problem .
https://www.scmp.com/economy/china-economy/article/3117279/chinas-food-security-again-beijings-agenda-nations-bitter
The USDA greatly lowered corn yield and carryout for the 2020 corn crop. S America has some weather problems.
At the cash prices, it is as if the oil price went from $40 WTI to $90 WTI in 9 months.
Of course, oil has went from disaster to profitable in 9 months.
If you can find it, look at oil prices in the 1950s. Barely moved 25 cents for months or even years at a time.
Wonder how many paper bushels and barrels are being traded now for every physical barrel?
SS, maybe US corn has gone up 2.25x in 9 months but globally FAO cereal index has gone up 18.4% (from 97.7 in March to 115.7 in December).
http://www.fao.org/worldfoodsituation/foodpricesindex/
John .tks . Why did YT delete videos of ” The ice age farmer ” who was warning about a crisis about agriculture ? Is the next battle between food prices and oil prices ? What came first chicken or egg ? Interesting .
look at oil prices in the 1950s. Barely moved 25 cents for months or even years at a time.
Weren’t oil prices being managed then by the TRRC?
Nick , my POV has been that financialistion of commodities though profitable for speculators prevents real price discovery . Example : Would we have a minus $ 37 per barrel price if only spot prices prevailed ? How do we know that KSA and other producers or consumers are not buying and selling futures ? There is no transparency . As to your question of TRCC well , I was not even born ,so no comment .:-)
I should have made clear that my comment was for Shallow Sand, in his discussion of oil prices in the 50’s.
Nick , ok . maybe I jumped the gun . Tks
Shallow Sands,
“Wonder how many paper bushels and barrels are being traded now for every physical barrel?”
I’ve been meaning to ask the forum if there are any petroleum experts who trade the oil futures market and can spot excessive open interest in the commodity and report their findings.
Today the oil price was down roughly 1.5%. I ask myself how can oil be trading lower given China’s power outages, record prices paid for LPG in Asia. Large oil inventory draws in the U.S. (up to 5 million barrels), under investment in oil. Then I think of the futures market and the ease with which it’s manipulated and then it dawns on me what is the real price of oil?
I’d certainly put less stock (heh) in the validity of futures traded prices for commodities given how the financialisation of the world has made these roulette wheels for the rich and powerful.
It actually doesn’t take too much to move a market, even a big and fairly liquid one on a futures exchange. There’s a good story in Mark Douglas’ Trading In The Zone where a wealthy fund manager basically shifts price on a whim to make a point with regards to certain preconceptions of predicting a market.
Shallow sand,
So around $55/bo for your WTI sweet spot, interesting. I hope oil prices continue to rise to where things are better for small oil companies as I wish all the best for you, Mike Shellman, Rasputin, and other small oil businesses.
Over 4,000 deaths per day, and when that number was 700 airline travel was still down 65%. That’s 4,000 plus even with all measures in place.
Once again I direct attention to the excess deaths page of the CDC. Official covid attribution of deaths was probably exaggerated last year, and this year it will be underestimated to persuade people that the vaccine is effective. Ignore all that and just watch excess deaths.
It seems unlikely this summer the daily death number will be lower than last summer. Deaths will decline in the summer because they do that every year even pre covid. But there are simply too many virus particles around now compared to last summer to expect the numbers to look like they looked last summer.
The CDC, or one guy in the CDC, says there are enough deaths to bring overall society life expectancy down about three years. I say no. It’s only a couple of weeks or months. He did his math wrong.
I think people are leaving cities. They will drive more.
Friends , you have to read this from Mike S . Dennis is making graphs till 2050 and Mike says shale is another 3 years and party over .
https://www.oilystuffblog.com/single-post/storm-s-a-comin?postId=5ffdd266694256001722b479
P.S : Dennis , I am not discounting your work but when Mike S speaks one has to get his/her ears up .
Hole in head,
Yes Mike Shellman has great stuff. For the Permian proved reserves are about 12 Gb and proved nonproducing reserves approximately 7.2 Gb at the end of 2019, so proved developed producing reserves in the Permian basin were about 4.8 Gb at the end of 2019 with about 1.2 Gb of oil produced in 2019 and 1.4 Gb for the Dec 2019 to Nov 2020 period.
Mr Shellman is calling the proved non-producing reserves “probable” reserves, but as he well knows a petroleum engineer uses that term very differently. A proved reserve (whether producing or not) is estimated to have at least a 90% probability of being produced. In 2020 the reserves will be lower due to low oil prices, and in 2021 it is likely reserves will increase because oil prices will be higher. The proved plus probable reserves (2P reserves) have at least a 50% probability of being produced, those numbers will also change in 2020 and 2021 due to changes in prices. The EIA does not report 2P reserves only proved reserves. For the UK North Sea 2P reserves are typically about 1.4 times higher than proved reserves. So at the end of 2019 Permian 2P reserves might be 16.8 Gb, if a similar ratio holds for Permian basin reserves as is found for the UK North Sea reserves.
Look at Enno Peters supply projection for Permian basin output, that projection has output falling a bit, maybe 500 kb/d with only 200 completions per month assumed.
Mike may assume oil prices will remain low for the foreseeable future, perhaps he is correct, though lately they seem to be rising, that obviously can change.
Listening to Mike S Hellman make economic forecasts is like going to your auto mechanic for cancer.
The price of oil over the last 10 months reflects oil pricing over supplied from a worldwide pandemic. When LeBron plays a game with the flu and only scores 15, 6 and 5. It doesn’t mean it time for him to retire. Demand will return and the market will rebalance back to the to cost of the next marginal barrel.
Mikey is just looking for attention to keep his cult followers uneducated.
HB where in the article has Mike S made a price forecast ? I don’t see it . A golden rule for you is ““It’s better to keep your mouth shut and appear stupid than open it and remove all doubt” . Mark Twain
HiH,
I think HB is giving Mike the benefit of the doubt. I think Mike’s main argument is that investors won’t be willing to underwrite a lot more shale production, given it’s historic losses. But, that argument would be weak if oil prices rise sharply: investors have a surprisingly short memory about losses (e.g., they keep lending to Greece!), and are hungry for any investments that promise a decent return. So, HB is assuming that Mike’s argument is based on relatively low prices in the coming years.
Nick , my issue is that he called Dennis ,me and others ( including Ron ) who respect Mike S, as a cult . Second what he assumes is BS . Mike S has forgotten more about oil then HB will learn in his lifetime . In his article he makes no forecast for oil prices . He can assume all he wants I don’t care but please think before you post , that is my POV .
I have said several times that you and me are in disagreement 100% but do we go uncivil ? I don’t think so . I presume we are on the same page when I say ” bad manners are bad manners ” .
I suspect further discussion of this would be controversial.
Nick , agree and accepted . Tks .
Did you notice that even in 2019, they were still losing money with an oil barrel price around 61$? We are still far from this…
Jean,
Look at EOG for 2019.
https://finance.yahoo.com/quote/EOG/financials?p=EOG
Well run companies did fine in 2019.
Dennis , ” one swallow does not the summer make ” . For every EOG ,I can list 10 names that are in chapter 11 or bankruptcy . The fact is that shale is a Ponzi . Further EOG is not a PURE shale player .
Hole in head,
EOG is mostly in tight oil, not sure any large publicly traded company is a pure tight oil producer.
I agree that many of the tight oil companies have not done a very good job.
EOG has produced 1.4 billion barrels of tight oil about 21% of total US cumulative tight oil output. The next largest company is Occidental whose cumulative output is about half that of EOG.
Data from
https://shaleprofile.com/blog/us-monthly-update/us-update-through-september-2020/
Dennis ,tks for the explanation , many things i still have to learn .
Attached is the latest STEO US production projection out to Dec 2022. Note that for the onshore L48, production over the next two years, Nov-20 to Dec 2022, is expected to increase by 0.62 Mb/d or 0.31 Mb/d/yr. This is significant because it clearly means that the US will not be the swing producer it has been in the past. From 2015 to 2019, it was able to meet the yearly increase in world demand and forced OPEC to reduce their production. This means that within a year, OPEC should regain full control of the oil market if it not already has.
it was the yearly production increase from the US that was critical in determining the price of oil. Since the yearly increase may be more important than the actual production number I am wondering if DENNIS could take one of his medium term projections and show us a chart of yearly production increase from the Permian.
Some are thinking this STEO projection to be extravagant given that during 2020 not enough wells have been completed/drilled for shale oil to balance the decline of conventional oil production during 2021.
JFF
In March 2020, 969 wells were completed. The number of completed wells in November 2020 is expected to be 366, 603 less than in March. The low point in production in the Onshore chart above is expected to occur in March and is projected to be 8.73 Mb/d.
Ovi,
Where do you get the completion data? At shale profile this data for recent months (through September) is very incomplete, I doubt the EIA does much better, my Permian model has 300 wells completed in the Permian basin in November 2020 and assumes this remains constant through June 2020, then rises by 5 completions per month through Dec 2022.
Also consider frack spread count which was 270 in March, 45 in May and now is up to about 143.
https://www.aogr.com/web-exclusives/us-frac-spread-count/2021
Dennis
I am just using the data in the Drilling productivity report and will send it you.
Jean,
Note that tight oil output fell from 8232 kbo/d in March 2020 to 7031 kbo/d in Nov 2020, so a decrease of 1200 kbo/d in tight oil output. For all US L48 onshore the decrease was about 1500 kbo/d, note that the STEO does not project US L48 w/o GOM rising to the March 2020 level by Dec 2022.
I agree however that the STEO projection looks optimistic, by perhaps 500 kbo/d.
Ovi,
I modified the completion rate a bit to fit output data through Nov 2020 a bit better, this is a T75, E61, W174, P75 scenario. Output falls to 3610 kb/d by June 2021, then rises to 3972 by Dec 2022. Economically recoverable resources (ERR) are 61 Gb, horizontal tight oil wells completed from Jan 2010 to August 2043 in the Permian basin are 174,368.
My guess is that the STEO may be too optimistic, but much depends on future oil prices and economic recovery.
Alternative scenario attempt to match STEO for increase in L48 onshore assuming most of this comes from Permian basin, this scenario has completion rate increasing from 300 wells in Dec 2020 to 475 wells completed in Dec 2022, output increases from 3642 kb/d in April 2021 to 4347 kb/d in Dec 2022 and increase of 705 kb/d over that period. ERR for scenario from 2010 to 2079 is 62 Gb and 178 thousand wells are completed from 2010 to 2043 (no wells completed after 2043).
Dennis
My main interest is the yearly rate of increase in production to see how much of world demand the US can supply. Looking at the above chart, it is showing close to 300 kb/d/yr from 2022 to 2023. This is less than half of the rate from January 2019 to January 2020
Ovi,
Keep in mind that there is a lot of OPEC capacity being held back at present, so for the period under consideration (up to Dec 2022), that will not be a problem, it will take some time for the World economy to recover, I don’t expect World demand for C+C to return to the 2019 level until 2024 or so.
Scenario below shows centered 12 month output for Permian basin scenario with ERR=62 Gb and maximum completion rate of 600 wells per month. In 2030 12 month average output reaches 6650 kbo/d and peak is in 2033 at 6736 kbo/d. The 2020 average for the scenario is 3774 kbo/d and 2021 average is 3694 kbo/d. Chart below shows 2015 to 2030 for Permian.
Good news for those concerned about the rapid approach of decline in global oil availability and the resultant abrupt crash in civilization.
We have come up with a little breathing room to learn how to tighten our belts. A time extension, provided by the moderate covid pandemic and the resultant 10-20 % slowdown in economic activity.
Deferred energy consumption, in effect keeping oil in the bank for a little longer.
It adds to the banked oil in the ground as a result of Geo-political maneuvers- sanctions initiated by the USA on Iran and Venezuela.
Combined, these ‘banking’ phenomena reinforce the projections of a long tail of oil production after peak, rather than the ‘Seneca Peak” scenario.
And each extra year that we get through without running out of oil brings us rapidly closer to the time when oil for transportation (72% of crude oil use) is less and less irreplaceable. The technology of electric transportation, from bikes to cargo, has rapidly matured and battery costs/power continue to improve. By the end of this decade, ICEngine and electric motor vehicles will be commonplace on the roads of the world, both viable. But trending sharply in opposite directions.
I am not hoping or suggesting that the world should strive to regain all the lost GDP and resume rapid growth at all costs. ‘At all costs’ meaning an unstable economy with high debt and frequent gross mis-allocations of resources, the destruction of the natural world, and the trampling of ‘inconvenient’ populations.
But we will. The human bulldozer will keep rolling on for more decades.
We will need to learn to live with slower growth (and even contraction in some regions), and learn to live with less energy at all levels of economy. Fortunately we are in a state where vast amounts of energy are simply wasted. I suggest we use this grace period wisely.
I suggest we use this grace period wisely.
In other words, we should transition away from oil burning as quickly as possible: stop building ICEs and fossil fuel generation, and incentivize efficient use of existing infrastructure by taxing the burning of oil and fossil fuels heavily (with revenue rebated to low income folks).
This should have been done decades ago anyway when the existential risk to the species was brought to the fray in carbon output. That fossil fuels aren’t not only not slowing in build out, but accelerating in many areas, makes me think anything else a pipe dream. Renewables have merely allowed for more efficient usage of those fossil fuels, not replaced.
And given 2ºC is pretty much baked in, we’re well past the debate case for whether we should. That ship has long sailed, but if we want to not set fire to literally everything, it should probably be looked at.
Hicks , are we able to have an INVOLUNTARY curtailment of oil and still expect BAU ? There is what are called ” unintended consequences ” . The problem is that the way our economic system is designed the formula is “continuous growth based on continuous debt ” . When the cycle stops , the system stops growing . “The end of growth is the beginning of collapse ” . The unintended consequences are political ,social collapse . We will witness those in the coming years . As an observer ( not based in USA ) the riots ( what ?) on the 6th Jan is a teaser trailer . Wait till the movie is released and don’t leave in the interval . ” Only in a world of infinite resources can men live as brothers ” .
“Goldman Sachs has flipped on their bearish natural gas stance to a bullish one” Who saw $30 /MM in Asia? Liquid Gold.
https://oilprice.com/Energy/Energy-General/Goldman-Sachs-Warns-Of-Bullish-Perfect-Storm-For-Natural-Gas.html
Also – ISO NE snapshot is 55% NG and 3% Coal during daytime. https://www.iso-ne.com/ The gas to run the world as we know it can’t stay next to worthless forever or can it?
LT , GS is talking the book . The problem with gas is pipelines . The largest economic producers are (Russia , Qatar and Iran ) USA is the largest producer but UNECONOMIC . The largest importers are Japan , Taiwan , South Korea and India . They all depend on LNG and not on piped gas . If prices are going to where GS says the 3rd largest ,the 7th largest and the 8th largest economies in the world would crash( I have no info on Taiwan ) . Crap. LNG is boutique trade ,it will last but not for long . How long ? I would be very rich if I knew this .
P.S : Russian and Qatar output is already pre sold on long term contracts . By the way tks for the post ,it assists in clearing BS .
Of Interest- Benchmarks of debt-to-equity (D/E) ratios for some US Upstreams.
https://www.fool.com/investing/2021/01/10/3-energy-stocks-to-buy-right-now/
Expect a wild ride for Energy holdings after budget wonderland speech this eve?
Word out this morning is a whistleblower has pushed the SEC into an investigation of XOM’s valuation of Permian holdings.
Good news . Shale was / is a ponzi . It was nothing but an income distribution and a disguised employment scheme with good benefits .
https://www.oilystuffblog.com/forum/forum-stuff/uh-oh
Perfect timing for this blog post
New posts up
https://peakoilbarrel.com/opec-update-january-15-2020/
https://peakoilbarrel.com/open-thread-non-petroleum-january-15-2020/