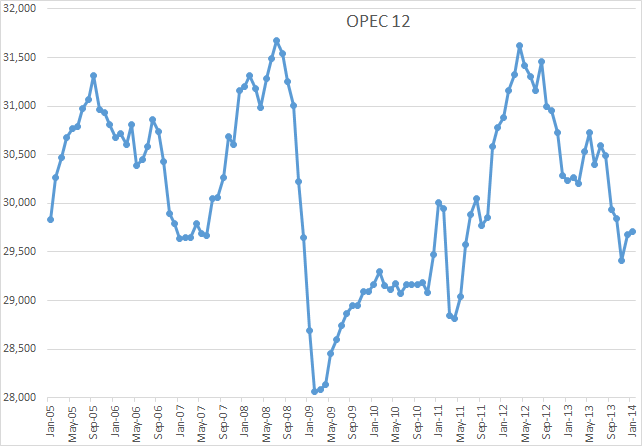
The OPEC Monthly Oil Market Report is just out with OPEC crude only production numbers for January 2014. OPEC Crude production was up 28,000 bp/d in January but that was after December production had been revised upward by 240,000 bp/d. November production was revised down by 51,000 bp/d.
Of course Saudi is always the one to watch because it is generally believed that they have spare capacity. I think they had spare capacity back in 2011 but are now producing flat out, just like every other OPEC producer.
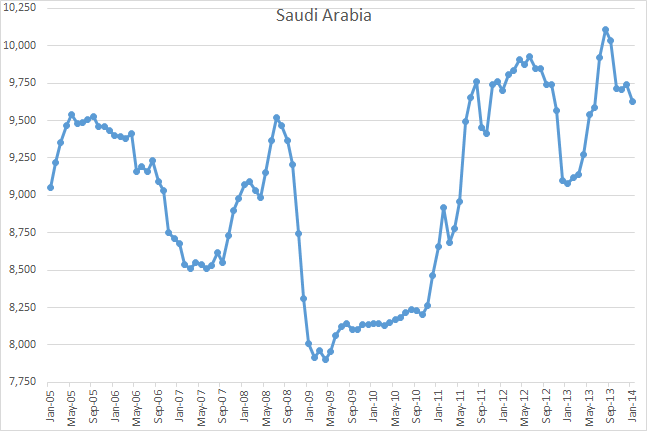
Saudi crude production was down 115,000 bp/d in January but that was after December production had been revised upward by 119,000 bp/d and November revised up 52,000 bp/d. I think that surge upward early in 2013 is a telling indication. That was Manifa coming on line.
Libya had the biggest gain in January, up 270,000 bp/d to 510,000. I guess peace may be breaking out in a few places there. Without Libya’s gain OPEC production would have been down by 242,000 bp/d.
Charts of all 12 OPEC nations can be found here: OPEC Charts.
The EIA’s Short Term Energy Report came out Tuesday the 12th. I found some of their projections interesting. The chart is in millions of barrels per day.
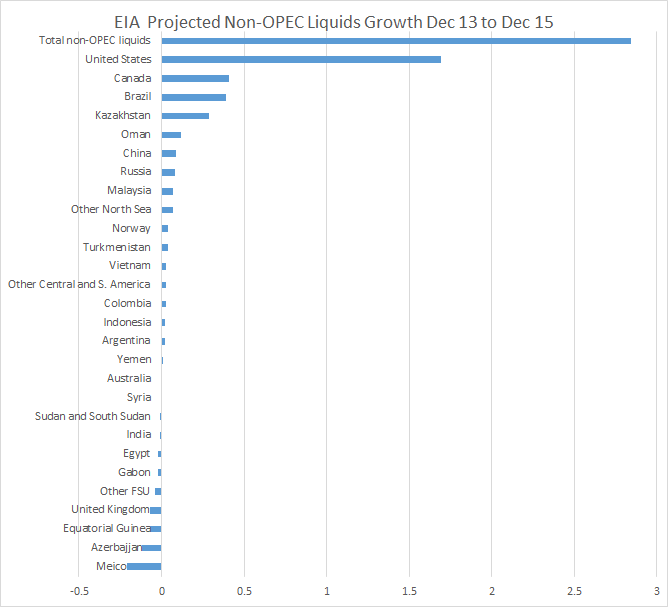
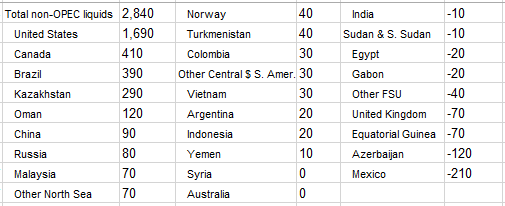
This two year Non-OPEC projection is all liquids, not C+C which I track. The EIA does not make C+C projections. Notice that 60% of all Non-OPEC increase is coming from the USA. Also the increase predicted for Brazil is very questionable, as is that of the USA of course Here is their actual predicted increase in thousands of barrels per day.
Here is a graph of their predicted growth for World Non-OPEC liquids in million bp/d.
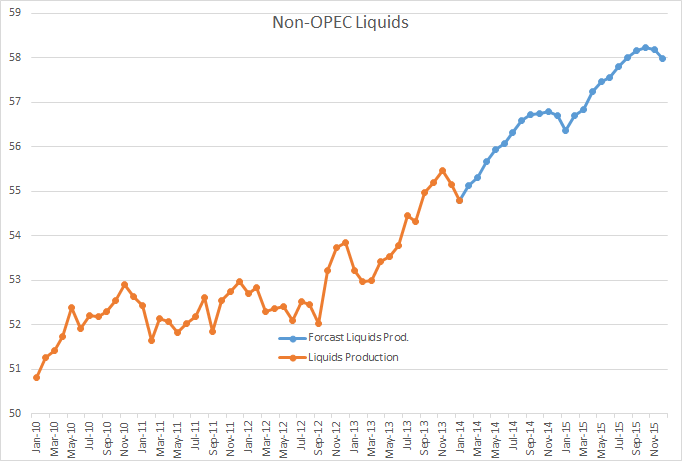
The orange is production through January 2014. The blue is their projected liquids production through December 2015. Notice that they have January 14 liquids below the level of September 13 liquids.
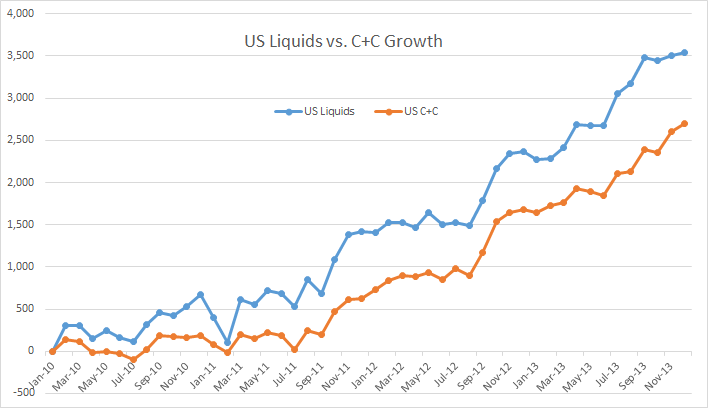
I thought it might be interesting to plot All Liquids growth verses C+C growth since January 2010. The chart below has January 2010 as zero. The data is kb/d. The EIA only has posted C+C data through September 2013.
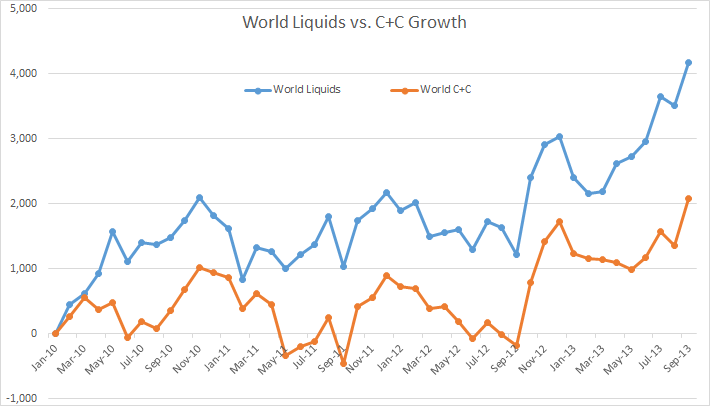
All Liquids, Jan. 10 through Sep. 2013 has grown almost exactly twice as fast as C+C, 4,170,000 bp/d vs. 2,086,000 bp/d.
The difference between USA Liquids and C+C is not quite as dramatic, 3,540,000 bp/ vs. 2,699,000 bp/d growth since January 2010 through September 2013. The EIA has published C+C data only through September 2013. But notice also that C+C has grown more in the US alone than total World. Without the USA’s contribution then World C+C would be down 306 kb/d January 2010 through September 2013 and likely a lot more if we had C+C data through December.
Iraq.
Looking at the politics of reporting there. Utter desperation to show a number above 3 mbpd to close the year on direct communications (page 61 of the report), requiring a 229K bpd increase from Nov to do so. haha that’s actually funny.
Both secondary and direct report a tiny uptick on the year 2012 to 2013, by 4K bpd out of 2.9 million bpd on the secondary report whilst acknowledging a 50K bpd decline Nov to Dec.
Hogwash, both.
Watcher, though I don’t put much faith in their “direct communication” numbers I think you are overreacting here a bit. OPEC’s “secondary sources” already had Iraq production numbers above 3 mb/d for November. And those numbers are not produced by Iraq or OPEC, they are a composite of several outside reporting agencies. While they are often off, as they are often revised quite a bit, I do think they are honest numbers. I see no reason why OPEC would be agree to fudge Iraqi production numbers when the have absolutely refused to do that with Iran’s and Venezuela’s numbers.
Venezuela has been complaining for years that OPEC’s “secondary sources” are under reporting their production numbers. That is primary reason why the MOMR started reporting “direct communication” numbers a few months back. They wanted to get Venezuela to stop bitching about their numbers being incorrect. Venezuela wanted to show that the strike, and the firing of all their striking oil workers, had no effect on their production numbers.
Nod, and that’s a good reply, but come on, there are different political imperatives there. Iraq is the poster child of the future of OPEC. Iran . . . is a threat to the Sunnis. Different kettle of fish altogether as regards who gets good numbers and who doesn’t.
Venezuela haha sounds like you call them the squeaky wheel.
Hmmm. Who funds OPEC? Do we have any data on the administrative budget for the “OPEC” organization/staff? That would also be relevant to . . . pressures.
http://www.opec.org/opec_web/static_files_project/media/downloads/publications/OPEC_Statute.pdf
Haven’t gone through it. Page 27 is not satisfying.
OPEC is funded by it’s members. Each, a few years ago, paid one million per year for operating expenses. That covers the expenses for their headquarters in Vienna. I don’t think they would have any reason to fudge the Iraqi numbers. There are several agencies that produce OPEC production numbers. Platts is one of them and their numbers match, very closely, the numbers produced by OPEC’s “secondary sources”. If they fudged their numbers the world would know it. Production is not like their “proven reserves” which are more easily hidden. Production is visible, reserves are not.
Iraq, like Iran, is now run by the Shia.
Ron:
Thank you for continuing to update us with peak oil status.
I find their predictions for an overall gain in North Sea production (UK-70, Norway+40, other+70) in Dec 2013-15 highly optimistic. UK production decline rates have been as high as 15% or more in the past few years (and I think are running at about 7% now).
The Scotland independence polling as of now says the vote will be no later this year, but should that reverse, I can’t see how that is going to goose reported UK production.
Ron, doesn’t Manifa have a ways to go yet before it reaches full production capacity? Will that be enough to offset decline temporarily? Looks like the initial bump from Manifa didn’t last too long. Doesn’t that imply a pretty drastic decline rate in the other fields?
Am I asking too many questions?
🙂
Here’s a short answer I found:
The Manifa field’s production capacity is expected to reach 500,000 bpd by July 2013, and is planned to reach its full design capacity of 900,000 bpd of Arabian Heavy crude oil by the end of 2014, while Saudi Aramco’s maximum sustained capacity will be maintained at the level preceding Manifa production.
So they should be somewhere between 500K and 900K right now just from Manifa, but overall production has been dropping pretty fast. Is there a disconnect there?
And what the heck does that last sentence mean?
http://www.saudiaramco.com/en/home/news/latest-news/2013/upstream-manifa.html#news%257C%252Fen%252Fhome%252Fnews%252Flatest-news%252F2013%252Fupstream-manifa.baseajax.html
It means that they will have the same maximum capacity as they had before Manifa was brought on line. And obviously it is Manifa that is enabling them to do that. Without Manifa their maximum sustainable capacity would be dropping.
Their production has not far, about half a million barrels per day in five months. We will have to wait about a year or so longer to see what is really going to happen. But I would bet they will never produce 10 million barrels per day again.
Saudi has been bringing on new production from Shaybah, Khurais and Manifa. This has enabled them to mask the declines from their old fields. But now they have no more such fields to bring on line. So we will know soon how well they can perform without new or old mothballed fields to bring on line.
That abrupt growth in the % of All Liquids that isn’t C+C is remarkable, I charted the historic percentages of each component a few years ago, and you saw a steady decline in C+C’s importance, but nothing so sudden as what your graph is suggesting, far as I can tell. It would be interesting to see how 2013 compares to other years.
The all liquids blowout is a bit credible. NGLs pay for gas fracking. The Marcellus is a liquids play. Only by the grace of a few API degrees do the Bakken and Eagleford not get classified as the same. It won’t push a single tractor around a farm.
Unless the technology of mega fracking stage count increase arrives, the rollover in this stuff is going to be really really steep.
Hi Watcher,
I know its not done much now, but is there any reason propane couldn’t be used for farm equipment. I know its not as good as diesel or gasoline, but it could be used with a little redesign of the engine I think. Maybe Mac can comment. He is both a farmer and a gearhead so I am guessing he may have thought about this.
Also a nice charting idea would be to take the volume of NGL and discount it by 70 % or so to account for its lower energy content per barrel and to do the same for ethanol (65%) and then liquids could be reported in BOE(barrels of oil equivalent). Its not perfect but better than what is commonly done by the IEA.
Chartwise, interesting. What gets my attention re 70% is . . . how is that fracked? Energy return-wise. Same fracking trucks go out, but how do you carry the gas? Gas trucks? Pressurized? The pipelines are going to face the same (or worse) rapid well death issue and can’t be laid economically before the flow stops? Or do they lay the pipes for the liquids and let gas into the pipe, too? But anyway, if we sneer at the energy return at the Bakken driving those fleets of diesel powered trucks around, what grimace do we use for those same fracking truck miles driven for lower energy output?
http://www.deere.com/wps/dcom/en_US/products/equipment/tractors/four_wheel_drive_tractors/9r_9rt_series/9r_9rt_series.page?
Now these are tractors. 500+ Horsepower. That’s what it takes to get 50,000 acres of crops collected in September before they rot. That would be one helluva lot of propane.
I suppose the ngls could be moved by rail. My main point was that ngls’s do provide energy, they are not as energy dense an thus are less convenient for tractors and cars and such, the best use is in places where natural gas is not available for heating, but as liquid fuels become scarce and the price propane rises far above the cost of electric heating with a heat pump, then propane will be used for transport if it is cheaper than liquid fuels. This won’t happen for 10 to 20 years but it may happen, it depends on prices and consumer preferences both of which are herd to predict.
http://www.alternative-fuel-vehicles.org/Cars-and-Trucks/propane-vehicles
Not a single propane powered vehicle has been produced for sale since 2004.
Hi Guys ,
I’m out of date these days and don’t really know what is going on with the biggest and newest equipment since I retired and no longer keep up with what goes on out in the midwest and on the plains where the biggest farm equipment is used.
But LPG fueled tractors were very common at one time in places where LPG was cheap and readily available.
Most farmers in the places where grain was grown and continues to be grown have some pretty big permanently installed tanks either owned or leased long term and buy LP by the truckload because it takes a lot to dry five hundred acres of grain, and nowadays five hundred acres is a pretty modest place. Five thousand acres owned and leased is not uncommon at all.
It is necessary to stock up for harvest because once the grain is coming in from the fields the delivery trucks have a hard time keeping up.
So with lp being cheap and the necessary tanks already in place plenty of tractors were built to run on it.It’s an excellent motor fuel and power is not a problem if an engine is originally designed to run on it but an engine converted from gasoline to lp loses some horsepower.
Converting an older gasoline tractor is as cheap and easy as bolting on an LP carburetor and tank and hooking up the fuel lines. There were lots of old gasoline tractors converted at different times because some farmers could get lp for peanuts depending on their location.
Diesel conversions are possible but rare and I don’t know anything about them other than that there are some out there and running.
Supposedly the conversion is a useful strategy in the event that diesel is unavailable in adequate quantity but you still need some diesel because LP doesn’t ignite satisfactorily from the heat of compression.
I don’t know if any tractors are being sold new to run on LP these days but there is no reason to stick to diesel if the price advantage of LP is big enough.
If it weren’t the middle of the night I would call a midwestern tractor dealer and ask what is available.
There may not be any price advantage these days.
Engines that run on lp are legendary for durability because it is super clean burning fuel and doesn’t crud up the works and the oil with sludge and acids and so forth.
It would be nice to know if those you recall were 500 horsepower machines.
I once looked into truck gas mileage and was quite surprised by the conclusions. The more horsepower the truck had, the better its mileage. The issue was hills over several hundred miles. The lower horsepower trucks hauling the same load struggled and the engine got inefficient as it labored. The big horsepower trucks zoomed right up the hill.
So moving to weaker fuel out of some sort of necessity (assuming there’s time to do such a thing) may not achieve anything. The big horsepower tractors probably push through mud without complaint. Lower horsepower on lower quality fuel may just wind up burning a lot more joules to do the same thing — slower.
The tractors that have 500 horses are the very latest and biggest ones and there are very few of them out there. A big tractor ten years ago was 250 horsepower and twenty years ago a hundred fifty horsepower was a big tractor.
In my line of work a hundred horsepower is still a big tractor because we just never needed any more power than that.
I got by just fine with a forty horsepower tractor by using a pesticide sprayer equipped with it’s own engine.
The older tractors that were built to run on lp were probably mostly under a hundred horsepower but I can’t say for sure.
Tractors last almost forever and I’m sure there are a lot of them still around on smaller farms.
But a new tractor if it is engineered to run on lp will perform just fine under any circumstances that are commonly encountered.
And the normal circumstance for a tractor is that it is running at or pretty close to flat-out hammer down full throttle doing field work because you buy your tractor to match the power needs of the equipment you use with it. New tractors of the sizes used for field work on large farms these days run well up into six figures.You don’t buy any bigger than you actually need.
The difference between two hundred horsepower and five hundred is enough to put a new tricked out pickup for Daddy and a new Caddy for Momma in the driveway.
Nod, good info.
Of course the issue is 20+ years ago there were 1-2 billion fewer people to feed so farms could be smaller. Big got big from necessity.
Those big guys also use tank-like tracks instead of wheels. Youtube has lots of vids of tractors with wheels getting stuck in the mud. A day spent towing a tractor out of mud is a day of crops rotting.
NYT: Giant Laser Complex Makes Fusion Laser Advance, Finally
http://nyti.ms/NDmYvf
To say it is dubious is to put it nicely. After a big shake-up and threatening to shut it down, the project quickly turned around and successfully demonstrated ignition. Surprise!
I’m personally all in favor of just about any kind of basic scientific research because there is always the possibility of spinoff technologies that have the potential to be real game changers.
But there is always a larger envelope to be considered and I’m afraid that fusion energy research is too much of a long shot to survive the budgeting problems associate with it.
There’s a good article on it at the Scientific American website with free access right now that is reasonably honest about the long term prospects and to put it mildly they are dismal.
The odds are very high that nobody reading this website today will live long enough to see even a demonstrator scale nuclear fusion plant built and building a commercial plant would probably take another ten years absolute minimum and maybe as long as another half a century depending on the number of political, technical , and budgeting difficulties encountered. EVEN THIS time frame is assuming that funding is continuously available !
Most kinds of research and most new technologies are able to in effect bootstrap their own expansion. LED lights for instance were commercially feasible early on for use as the displays in cheap and not so cheap consumer goods such as clocks and calculators and that allowed the people building them to fund research into improving out put and color and lower the cost since it looked like a good bet that they would succeed.Success has followed success time after time and the LED industry is now able to manufacture lights that are bargains for residential and commercial use.
A nuclear fusion plant on the other hand will require that a considerable number of new materials not only be invented but manufactured and tested and then fabricated into the components of a new and uber complicated machine that exists only as a concept in the minds of the physicists and engineers who are in fact actually acknowledging that if it ever gets built——that it will be built by their grandchildren.There are not likely to be any stepping stones to success on the way to a functioning fusion reactor that will pay expenses since the whole process is utterly cutting edge. It will have to be funded start to finish with the entire R and D effort paid up for a century in advance.
Speaking as a long time observer of the political process and as a believer in global warming and peak fossil fuels in particular and pretty much peak everything in general, I can say with confidence that the odds of the money for fusion research and development will be cut off within the next couple of decades are fairly close to one hundred percent.
Just paying for the promised entitlements is apt to break the political camel’ s back within the next two decades considering that we are deep into overshoot.
A rational government would be directing energy related research money into technologies that have the potential to pay dividends within a politically defensible time frame.
There are probably dozens or maybe hundreds of such technologies already demonstrated to be technically feasible that might pay off at a thousand to one if they can be commercialized. A method to manufacture a cheap super insulating material suitable for use in homes and commercial buildings is a great example.
Cheap super magnets are another possibility as they can be used to manufacture more efficient electric motors.
Any sort of light weight material that can potentially be used in cars and trucks is another.
Self driving vehicles are also a potential game changer although they will be a tough item to sell given that a lot of people drive for a living. SELf driving trucks could run just about bumper to bumper in dedicated lanes at half the ordinary speed limit and thereby save a huge amount of fuel. I am not saying that such a scheme will ever be practical but simply mentioning it to illustrate the possibility of saving energy by means of new technology that can be made to work within the short to medium term.
“…believer in global warming and peak fossil fuels in particular and pretty much peak everything in general…”
Wish you wouldn’t put it like this, OFM. It’s not a matter of belief, which is the preferred framing of deniers. It’s a matter of data observation.
Perhaps you and I could say ‘we believe in data observation’, and leave the deniers to believe in fairy tales…
http://www.nytimes.com/2014/02/13/business/energy-environment/an-oil-industry-awash-in-crude-argues-over-exporting.html?hpw&rref=business&_r=0
This in an article about exporting oil in the NYT that goes into some considerable detail.
There is a ten article per month free policy in effect and after that there is a paywall.
Sometimes you can get past it by switching user accounts on the same computer.
As noted in the NYT article, Mid-continent refiners love the current arrangement, since they buy crude at WTI prices and sell refined products based more on global product prices, which are more closely linked to the Brent crude price. In any case, I think that this is largely irrelevant to US consumers, and it’s basically a fight between some US producers and some US refiners.
However, a critically important point is that rising production in a net oil importing country like the US affects the demand for global net exports of oil, but it has no effect on the supply of net exports. Combined net exports from the (2005) Top 33 net oil exporters (GNE, or Global Net Exports of oil) have been below the 2005 rate for seven years, with the developing countries, led by China, (so far at least) consuming an increasing share of a declining volume of GNE, relative to 2005. I define Available Net Exports (ANE) as GNE less Chindia’s Net Imports (CNI).
Gap chart (2002 to 2012) for the (2005) Top 33 net oil exporters:
http://i1095.photobucket.com/albums/i475/westexas/Slide1_zps3161a25b.jpg
Gap chart (2002 to 2012) for ANE:
http://i1095.photobucket.com/albums/i475/westexas/Slide04_zpsd68833b7.jpg
In my opinion, it seems likely that 2013 was the eighth year in a row that annual Saudi net oil exports were below their 2005 annual rate of 9.1 mbpd.
Saudi net oil exports 2002 to 2012, total petroleum liquids + other liquids, EIA, mbpd:
2002: 7.1
2003: 8.3
2004: 8.6
2005: 9.1
2006: 8.6
2007: 8.1
2008: 8.8
2009: 7.6
2010: 8.1
2011: 8.3
2012: 8.7
2013: 8.7 to 8.8 (Estimated)
Jeff,
Do you have any info on, or feeling for, which significant country(s) will be next in making the exporter-to-importer transition? To my mind this is as important a PO metric as any. I expect you’d agree. It’s interesting, to me at least, to monitor this process being playing out in affected countries; of course there are always mitigating circumstances. Clearly Egypt and Argentina are in disastrous straights with Indonesia not far behind.
From personal observations (I was in Hanoi last fall) I know Vietnam is coping fairly well, at least for now. Of course, the VN economy is growing from a low base and people there are especially resourceful. The UK is possibly more interesting. From the hype, and on the surface, their economy is well into recovery mode. However, even in bonny Scotland, where I also spent some time last year, people, especially in rural areas, were complaining about how high fuel (gas) costs were eroding the viability of their farm operations. Of course farmers are chronic complainers but similar grievances are common all the way to London.
Anyway, I look forward to your view(s) on these matters.
Doug
P.S. This question was posed further back and you may have missed it; or deemed it unworthy of comment.
Hi Doug,
Ok I’ll take you up on that I think the next major producer to become a net oil importer might be:
Mexico
Total Crude Oil Exports:
2008 1,403
2009 1,222
2010 1,361
2011 1,338
2012 1,256
2013 1,178
Oh course I may be missing a more likely candidate so hopefully someone will jump in with a better suggestion if I’ve missed something obvious.
Marcus
Marcus,
Suppose that might have been my guess as well — it would certainly be a significant shift! However, there’s so much conflicting info about Mexico’s potential it all leaves me totally confused. Anyway, your numbers certainly support your conclusion.
Doug
Mexico’s net exports (I think you are showing gross exports) fell from 1.8 mbpd in 2004 to 0.7 mbpd in 2012 (EIA, total petroleum liquids + other liquids).
At the 2004 to 2012 rate of decline in their ECI ratio (ratio of production to consumption), they will approach zero net oil exports in about six years.
Jeffrey,
My bad yes they are gross exports. Do you by chance have an easy link for your numbers? I’m a real Luddite when it comes to navigating the Pemex website.
0.7 in 2012 so we must be pretty close. I think all the hype about opening up Mexico’s oil production to foreign firms will be about as successful as Brazil i.e. not too great at all.
Shoot me an email, and I will be happy to send you our data table. It’s all based on EIA data, given the increasing gaps in the BP data base. For production, I’m using total petroleum liquids + other liquids.
westexas AT aol Dot com
As I keep pointing out, the real–and almost totally overlooked–story is CNE (Cumulative Net Exports) depletion. For example, I estimate that Mexico had already shipped about half of their post-2004 CNE by the end of 2009.
Globally, I estimate that we have already burned through about one-fifth of post-2005 Global CNE, in just the seven years from 2006 to 2012 inclusive.
Doug,
Following is a chart showing the list of (2005) Top 33 net oil exporters and their 2005 to 2012 rates of change in their ECI ratios (ratio of production to consumption):
http://i1095.photobucket.com/albums/i475/westexas/Slide1_zps5a656e89.jpg
How soon they approach an ECI ratio of 1.0, and thus zero net oil exports, is a function of the actual rate of change in their ECI ratio, and the actual ratio in 2012.
The faster that the ECI ratio falls, from a given ECI value, the faster that they will approach 1.0, and the lower the ECI ratio, for a given ECI rate of decline, the faster that they will approach 1.0.
For example, two countries with similar ECI rates of decline (4% to 5% per year range), Saudi Arabia and Mexico.
The 2012 Saudi ECI ratio was 4.0, with a 2005 to 2012 rate of decline of 5%/year, which implies that they would approach zero net oil exports in about 28 years (from 2012).
Mexico’s ECI ratio in 2012 was 1.33, with a 2004 to 2012 rate of decline of 4.1%/year, which implies that they would approach zero net oil exports in about 7 years (from 2012).
All of the Top 33 countries had net exports of 100,000 bpd or more in 2005. As of 2012, 8 of them were below 100,000 bpd (and in some cases they were net importers in 2012).
The 8 that were below the 100,000 bpd net export mark in 2012 were: Argentina, Trinidad & Tobago, Denmark, Syria, Yemen, Sudan, Vietnam and Malaysia.
Jeff,
Thanks for responding to my question. It will be interesting to see if your 28 year Saudi projection point holds up over time given their rapidly increasing internal consumption rates. Though I suppose this remains a relatively small part of their vast production capability and that depletion is really the more important factor.
Doug
The latest Highlights of the latest OMR is out this morning. Non-OPEC is starting the year out on a down note:
Global supplies fell by 290 kb/d in January, to 92.1 mb/d, on lower non-OPEC output.
However this headline seemed to be of most concern to the media:
Total OECD industry stocks plummeted by a further 56.8 mb in December, taking 4Q13 OECD stock draws to 1.5 mb/d, the steepest quarterly decline since 4Q99. At 2 559 mb, total OECD oil stocks stood 103 mb below their five year average at the end of December, while product stocks covered 28.8 days of forward demand.
Those who subscribe get the full report. It will be posted free in two weeks. However it apparently contained a dire warning because it generated this headline in the Financial Times:
IEA urges Opec to sustain oil production
Opec will need to sustain production at its current level of almost 30m barrels a day if badly depleted oil inventories in the developed world are to be rebuilt, according to the International Energy Agency…
“Far from drowning in oil, markets have had to dig deeply into inventories to meet unexpectedly strong demand,” the report said.
Many forecasters have been warning of an oil supply glut and sliding prices because of surging US shale oil production and rising supply from Opec members such as Iraq and Libya. However, it has failed to materialise.
This is part of the abundance narrative. If you postulate abundant supply, then every time there is an inventory drop it must mean booming economy and consequent growing demand and applause. If there is an inventory increase, it means prices are about to be lower and applause.
Here is a good article from Bloomberg:
http://www.bloomberg.com/news/2014-02-13/oil-inventories-fell-most-since-1999-on-demand-in-iea-estimate.html
This Bloomberg/IEA story gets more and more interesting.
Let me see, 1.3 is less that 43.7, right? That can’t be good.
Brazil? The same Brazil whose oil production is down in 2013 and whose net oil imports are increasing? I can believe we will continue to see increase for U.S., but I expect Brazil will be a net negative in 2014 and going forward.
Some time indeed.
What I want to know is at what level do diminished stocks start to have a real impact. Inventories now stand at 2.6 billion barrels. So being 103 million barrels below the five year average doesn’t seem like a critical issue, unless there is some kind of inflection point, some minimum level of oil inventories that is needed just to run the system. Would love to know the answer to that.
The OMR includes an interesting discussion topic they call The Crude Wall. Briefly, the Crude Wall is the maximum crude oil processing capability that exists in the U.S. and Canada. The idea is that once that maximum processing capability has been reached, as the result of expanding LTO production, the oil will have no place to go. The IEA sees this as a potential cap on production since nobody will produce oil that has no place to go.
If this Crude Wall is reached, the ban on exports of crude oil will have to be lifted to give the excess production a place to go. The question is when will the Crude Wall be reached and then will exports of crude be allowed. The issue is of particular relevance to LTO due to the predominance of lease condensate:
It’s not like the good old days where an oil well produced predictably for many years and the infrastructure could be built out with confidence that there would be a long term return on investment. Now we have jump around to different sweet spots, spend ten times as much to drill a well that will produce for a much shorter time. The level of certainty of long term return is much lower. Who will put up the money for new transportation and processing infrastructure? Someone probably will, but they will require a hefty profit margin to get their investment back quickly given the uncertainty.
How will the American public respond to efforts to allow the export of “our” crude oil? Won’t the majority view it as a giveaway to big business? Won’t politicians be wary of supporting such a measure despite the industry demands?
So now the limitations on LTO production may have less to do with geological issues and more with capital and political ones.
Block quotes didn’t come out right in previous post, so here’s another try.
The OMR includes an interesting discussion topic they call The Crude Wall. Briefly, the Crude Wall is the maximum processing capability that exists in the U.S. and Canada. The idea is that once that maximum processing capability has been reached, as the result of expanding LTO production, the oil will have no place to go. The IEA sees this as a potential cap on productoin since nobody will produce oil that has no place to go.
If this Crude Wall is reached the ban on exports of crude oil will have to be lifted to give the excess production a place to go. The question is when will the Crude Wall be reached and then will exports of crude be allowed. The issue is of particular relevance to LTO due to the predominance of lease condensate:
“Much of the LTO is produced in the form of lease condensate, which is most optimally processed in a condensate splitter. There is currently only one condensate splitter in the US, although at least five others are in various stages of planning and construction.”
It’s not like the good old days where an oil well produced predictably for many years and the infrastructure could be built out with confidence that there would be a long term return on investment. Now we have jump around to different sweet spots, spend ten times as much to drill a well that will produce for a much shorter time. The level of certainty of long term return is much lower. Who will put up the money for new transportation and processing infrastructure? Someone probably will, but they will require a hefty profit margin to get their investment back quickly given the uncertainty.
“Although there appears to be room in the market to accommodate further supply expansion in 2014 without any immediate change in export regulations, how long this can continue is open to debate. Given these constraints, it may not come as a surprise that the regulations governing US crude exports have recently come into the public spotlight. Several US lawmakers have raised the issue and come out either in favour or against a relaxation of the current statute, and a hearing on the implications of liberalising US crude exports has been scheduled at the US Senate Committee on Energy and Natural Resources for 30 January.”
How will the American public respond to efforts to allow the export of “our” crude oil? Won’t the majority view it as a giveaway to big business? Won’t politicians be wary of supporting such a measure despite the industry demands?
So now the limitations on LTO production may have less to do with geological issues and more with capital and political ones.
Hi Calhoun,
The US will never produce more oil than it can refine, period. Canada does not have export restrictions so excess oil will be exported from Canada. Not really a problem, except in a world where LTO will grow even more than the EIA expects, which is doubtful IMO.
Current output is about 7.8 MMb/d, US refinery inputs are about 15 MMb/d, when output doubles we will have a problem, also remember that swaps are allowed to give refineries flexibility so if the LTO doesn’t work for refinery x thay can swap imported crude for the LTO and export the LTO to Italy (where their refineries are designed for super light Libyan oil.)
Another big draw in US natural gas storage (down 237 BCF). Subject to where storage levels end up at the end of the heating season, subject to how much new production the industry puts on line this year–as they battle decline rates from existing wells (which Citi Research puts at about 24%/year)–and subject to what kind of winter we have 2014 to 2015, we might be looking at some severe natural gas supply problems next winter.
Summary
Working gas in storage was 1,686 Bcf as of Friday, February 7, 2014, according to EIA estimates. This represents a net decline of 237 Bcf from the previous week. Stocks were 863 Bcf less than last year at this time and 631 Bcf below the 5-year average of 2,317 Bcf. In the East Region, stocks were 315 Bcf below the 5-year average following net withdrawals of 106 Bcf. Stocks in the Producing Region were 232 Bcf below the 5-year average of 845 Bcf after a net withdrawal of 89 Bcf. Stocks in the West Region were 84 Bcf below the 5-year average after a net drawdown of 42 Bcf. At 1,686 Bcf, total working gas is below the 5-year historical range
Regarding this winter, subject to weather conditions in the next six weeks, I would think that we are going to be hearing about more commercial and industrial users (with interruptible gas contracts) in the US having to curtail their natural gas consumption, in order to maintain line pressures.
Are we approaching limits to the proper functioning of the natural gas storage facilities? Scroll down to operational dynamics (base gas). https://server1.tepper.cmu.edu/Seminars/docs/Thompson_paper.pdf
Upon further evaluation of old and current charts I now realize that the current EIA chart graphs “working gas” in storage and does not include base gas. Thus there would seem to be adequate storage – at least for this year. I assume that the line pressures described by JJB could be a different matter??
The drawdown in storage is of course not uniform, and some areas will be more heavily impacted than other areas, as a result of low storage volumes. Also, as storage declines, the pressure declines in the storage reservoirs, although I assume that they can at least partially address this through the use of compressors.
And during periods of high demand, there is only so much gas that gas companies can force through their systems.
In any case, there have already been some reports of commercial/industrial users having to curtail their gas consumption, but as noted above, the potentially widespread problems could be next winter.
Perhaps I can partially blame my previous ignorance to sub-optimal terminology used by AmericalOilman.com http://americanoilman.homestead.com/GasStorageGraph.html
Latest NEB >a href=”https://www.neb-one.gc.ca/clf-nsi/rnrgynfmtn/sttstc/lqdptrlmgs/lqdptrlmgs2014.xls”>LPG stats (xls file)…
Rising propane price frustrates Thunder Bay homeowner
CBC News Posted: Feb 11, 2014 12:35 PM ET
Propane prices, supplies a pain
By Sam Shawver – The Marietta Times – February 12, 2014
From this week’s EIA TWIP…
EIA Weekly NG Storage Report
Bill Powers believes we may see 1.2 Tcf storage by the end of Feb and possibly down to 800 Bcf by the end of March.
If the Marcellus and other shale gas fields are not able to add 17 Bcf in 2014 to offset the 24% annual decline rate, we may be heading into the winter of 2014 with a 15-25% lower storage level than we had in 2013.
If the Arctic continues to warm as many of the MORE INTELLIGENT Climate scientists forecast, we may see the same kind of weather pattern this winter. Thus, we will see continued dry and warmer conditions in the west and colder and more precipitation in the east.
If these two patterns (energy & climate) continue… this may totally change the U.S. natural gas cycle… for quite some time (if not forever).
steve
Steve,
“If the Arctic continues to warm as many of the MORE INTELLIGENT Climate scientists forecast, we may see the same kind of weather pattern this winter.”
You don’t really have to resort to the view of the MORE INTELLIGENT climate scientists to advance your argument because you’ be hard pressed indeed to find ANY who don’t already expect increasing Arctic warming.
And, I don’t think it’s really cricket to label people as more intelligent because they happen to agree with you — not that we don’t all think that way!
Doug,
While I appreciate your opinion of my use of “adjectives”, I doubt I would have done the same if the table was turned. Regardless, the MSM controls the media, and when you see that some of the less intelligent folks are promoting the work of the 3% of climate scientists who do not believe in human induced climate change, I thought it was worthwhile in using that adjective.
Lastly, I never try to compare the data and information from others against my ideology, but rather to the consensus who makes the best argument.
That being said, you’re more than welcome to offer your opinion on how I might better “Edit” my responses…. but dear sir, you will never see me taking that approach.
Now, if someone was to say something really “STOOPID”, well then, I might offer different data or information that I believe is more credible.
steve
Steve,
Personally I think climate change deniers are morons, there I said it. Frankly it mystifies how anyone, and there seems to be lots of them out there, could hold this view given the overwhelming evidence to the contrary. In some cases there seems to be a biblical argument in the background, God will provide, or something like that. Otherwise, it totally boggles the mind. And, as far as I’m concerned global worming dooms us: not me, our children perhaps, certainly our grandchildren.
Ron, I am derelict in expressing my appreciation to you for establishing and maintaining this site. You are making an extremely valuable contribution. Thank you.
I have spent the last twenty five years trying to prepare my family and rural community to cope with the traumatic changes that are even now are occurring due to diminishing natural resources, over population and excessive debt. I believe that I have had significant success in this endeavor. Previously, I directed friends and neighbors to TOD for education in these matters. Now I direct them to this site. It seems to me that the more people we get on board , the better it will be for all of us.
I also appreciate the comments on this site because I gain new information and, believe it or not, I frequently recognize flaws in my own thinking. I do have one criticism of some comments. From my perspective, unnecessary ridicule of the views of various groups of people (politicians, political parties, climate change skeptics, Christian fundamentalist, etc.) is destructive. I refer any body who will listen to this site regardless of their personal beliefs. When they follow my recommendation and are greeted with ridicule, they do not stay to get properly educated and in my opinion we all lose.
Doug,
I see we are on the same page here….
steve
Climate change is here now and it could lead to global conflict
Nicholas Stern – The Guardian, Friday 14 February 2014
Extreme weather events in the UK and overseas are part of a growing pattern that it would be very unwise for us, or our leaders, to ignore, writes the author of the influential 2006 report on the economics of climate change
Blast rocks Kentucky natural gas pipeline amid storm
By Scott DiSavino – Reuter – Thu Feb 13, 2014 12:14pm EST
http://peakoilpetroleumandpreciousmetals.yuku.com/topic/23475/NaturalGas-Futures-Rally-8-as-Supplies-Tighten
‘Big oil’ getting smaller as production keeps falling
* Top seven western majors all seeing liquids output fall
* Supermajors’ share of global market dropping every year
* BP reports fastest decline of 30% from 2009-13
* Production becoming more evenly split between oil and gas
Combined output of crude and other liquids by the seven biggest western majors — ExxonMobil, Shell, BP, Chevron, Total, ConocoPhillips and Eni — amounted to 9.517 million b/d last year, down 2.2% from 2012 and marking the fourth consecutive year of decline.
Liquids output from the same group has been falling every year of late, having been as high as 10.865 million b/d in 2009.
As a group, the seven have seen their combined liquids output fall by 1.348 million b/d, or 12.4% over the period from 2009 to 2013.
With all majors down 12.4% in the last five years it makes you wonder how the national oil companies are managing an increase. Are the numbers we are getting from the IEA, EIA and BP for national companies reliable ? Of all the major oil companies BP is denying peak oil the loudest yet their production numbers are down 30% in the last five years.
Ron,
You bring up an excellent point. I keep bringing up Bill Powers, but he wrote in his book “Cold, Hungry & In the Dark.” that he believes the EIA is inflating energy production figures as much as 10%…. and that as off late 2012, early 2013.
When you factor what is taking place in the energy majors (as you have shown), it seems quite strange that the world continues to increase its overall production… even though the majority of gains have come from the U.S. & Canada, when the largest oil companies are showing declines.
Here is one more TIDBIT. The U.S. BEA – Bureau of Economic Analysis stated that the U.S. had a GDP of $17.1 trillion in Q4 2013. If we consider that the U.S. consumed 101 Quads Btu in 2007 when the GDP was $14.7 trillion, and we have added $6.1 trillion in U.S. Govt Debt while our total energy consumption is lower at 97 Quads… how in the living hell do we print a $17.1 trillion GDP?
Of course it’s all smoke and mirrors, but I believe if we deduct the “Economic Juice” we got from the $6.1 trillion in govt debt along with the lower energy consumption… I would imagine the U.S. GDP is actually closer to $11-12 trillion.
Seems like everything is being FUDGED.
steve
1) The oil majors can report lower production while the world grows because reserves are now mostly held by the Rosnefts, the Petrochinas, Petrobras, etc.
2) Most of the gain in the US is coming from Continental Resources types in the shale fields and not the Exxons, Chevrons and Conocos. So yes, even the US output can rise while Exxon falls.
3) GDP measured in dollars has no meaning when they are printed with impunity. In the past the punishment would have been via currency differential, but as of now other central banks coordinate to prevent differential and avoid global destruction. In the end it will fail because oil joules tell the entire tale.
This article is well worth reading an discussing for both what is in it and what is not.
I don’t have time to go into it right this minute but I am hoping some of our resident experts see it soon enough to comment on it at the Economist website while it is still fresh and comments are still open.
It has some very interesting statements in it that in only a slightly round about way indicate that peak oil is very serious concern among professional economists and also some factual errors (in my opinion) in respect to the performance of fracked wells of the sort that are drilled in the Bakken–but I am not altogether sure since I don’t have the relevant figures in my head.
http://www.economist.com/news/united-states/21596553-benefits-shale-oil-are-bigger-many-americans-realise-policy-has-yet-catch
Steve Kopits presentation at Columbia:
http://energypolicy.columbia.edu/events-calendar/global-oil-market-forecasting-main-approaches-key-drivers
Dennis, Dennis, Dennis, please watch this fantastic presentation by Steve Kopits. It puts the nail in the coffin of your favorite economic theory that it is bad government, not oil price or oil supply, that is causing the recession.
Don, thanks a million for this link. I would have completely missed it otherwise.
ND Bakken down by almost 50kbpd in December. It’s only a weather issue, or something more?
I added the Dec data. 2013 was the year with the slowest annual growth in ND of the last 3 years.
I will have a post on this later this day. The director’s cut has not been published yet. I guess he is trying to figure out a way to explain it.
Bakken Oil down 48,395 bp/d.
North Dakota Oil down 53,226 bp/d
Bakken wells producing up 40
North Dakota wells producing down 62
That means a lot of wells outside the Bakken were shut down in December, and likely a lot of Bakken wells also.
I smell my pet peeve, Ron. I’ll wait for your post to get verbose, but my pet peeve is the focus on fracking trucks and not on oil carrying trucks. If your on site tank fills up and no truck can get there to offload it, then you SHUT DOWN.
Thanks Kam, was watching for it. Let’s wait for Ron to lay it out.
Ron,
I think the following is important information given the interplay between global warming and the increasing use of natural gas which, of course, consists predominately of methane. The information below comes from a recent (Feb. 13, 2014) article in ScienceDaily News entitled AMERICA’S NATURAL GAS SYSTEM IS LEAKING METHANE AND IN NEED OF A FIX. http://www.sciencedaily.com/releases/2014/02/140213142225.htm
“…The first thorough comparison of evidence for natural gas system leaks confirms that organizations including the Environmental Protection Agency (EPA) have underestimated U.S. methane emissions generally, as well as those from the natural gas industry specifically…”
“…Even small leaks from the natural gas system are important because methane is a potent greenhouse gas — about 30 times more potent than carbon dioxide. A study, “Methane Leakage from North American Natural Gas Systems,” published in the Feb. 14 issue of the journal Science, synthesizes diverse findings from more than 200 studies ranging in scope from local gas processing plants to total emissions from the United States and Canada…”
“…The new analysis, which is authored by researchers from seven universities, several national laboratories and federal government bodies, and other organizations, found these atmospheric studies covering very large areas consistently indicate total U.S. methane emissions of about 25 to 75 percent higher than the EPA estimate…”
“…Perhaps surprisingly though, the analysis finds that powering trucks and buses with natural gas instead of diesel fuel probably makes the globe warmer, because diesel engines are relatively clean. For natural gas to beat diesel, the gas industry would have to be less leaky than the EPA’s current estimate, which the new analysis also finds quite improbable…”
Thanks for the link Doug. Very interesting but I think they give the short shift to natural seeps which, I believe, have dramatically increased in the last few years.
Some of the difference is accounted for by the EPA’s focus on emissions caused by human activity. The EPA excludes natural methane sources like geologic seeps and wetlands, which atmospheric samples unavoidably include. The EPA likewise does not include some emissions caused by human activity, such as abandoned oil and gas wells, because the amounts of associated methane are unknown.
Methane seeps from ocean hydrates and the tundra have increased dramatically in the last few years. This is a natural positive feedback from ocean warming especially in the Arctic. I think that is likely the major source of the increased methane in the atmosphere, not leaks in the delivery systems.
Ron,
Yes, I agree re the scary truth about “natural” methane leaks and the positive feedback aspects. But, in addition, the article sort of refutes the idea that natural gas is a kind of panacea, or lesser evil, to carbon dioxide emission concerns. Actually I sort of had that view myself – until now!
I, too, looked at the Bakken oil stats and have every month for one year. The macro picture, assuming $8 M per well, shows about $500+ for each additional barrel of oil. But yet the micro picture says (analysts anyway) $70/barrel (maybe a little more) is the marginal cost in the Bakken. Would someone please explain the discrepancy?
Sure. Ignore analysts.
http://www.commerce.nd.gov/news/detail.asp?newsID=1048
Gold in that link. I’ll repost when Ron posts the latest. Here are some nuggets:
>>Hundreds of diesel-fueled trucks are needed to accommodate such growth in a largely remote state, hauling crude to the nearest pipeline or rail head, hauling refined products to the drilling site or trucking in sand and water. These are key ingredients to hydraulic fracturing, or fracking, which involves injecting a mix of water, sand and chemicals into shale formations at high pressures to extract oil and gas.
That is on top of diesel used in the fracking process as well as the trains that transport Bakken crude to other states in the absence of sufficient pipeline capacity.
Local diesel terminals were sucked dry this month — some for hours, others for days — as a major Indiana refinery underwent planned maintenance while fuel demand rose due to seasonal demand from farmers and shippers at the tail end of the autumn harvest and the Bakken shale oil plays. Some truckers had to drive hundreds of miles to fill up.
“Trucks arrive at the loading station and some wait three to four hours and others in excess of eight hours,” said Bud Kerr, operations manager at J5, a hauling company in North Dakota. “The problem appears to be worse than what it was last year.”
>>
and
BNSF says a typical train in its fleet can move one ton of freight 495 miles on one gallon of diesel, based on average fuel consumption in normal conditions. Last week’s train hauling 70,000 barrels of crude — approximately 10,000 tonnes — would then consume some 34,000 gallons.
I think I remember reading that the pumping stations on big natural gas lines use some of the gas to fuel the engines that drive the pumps, at least in places remote from ample supplies of juice on the grid.
I presume that oil pipeline pumps must run on juice from the grid or else diesel fuel because to the best of my knowledge raw crude is just no good for engine fuel.
This brings up a question.
How energy efficient is a pipeline compared to a train?
Note that transport is away from the field. The big diesel consumption is the various pads taking the crude to the wellhead. Wells die so fast there’s no point laying a pipe to each one.